
Subwavelength Plasma Gratings Formation in the Process of Laser
Modification in the Volume of Fused Silica
Anna V. Bogatskaya
1,2 a
, Ekaterina A. Volkova
3b
and Alexander M. Popov
1,2 c
1
Department of Physics, Lomonosov Moscow State University, 1199991, Moscow, Russia
2
Lebedev Physical Institute, Russian Academy of Sciences, 119991, Moscow Russia
3
Skobeltsyn Institute of Nuclear Physics, Lomonosov Moscow State University, 1199991, Moscow, Russia
Keywords: Laser Microstructuring in Dielectrics, Birefringent Nanolattices, Fused Silica, Multiphoton Ionization of
Dielectrics, Plasma Formation, Numerical Modelling, Wave Equation.
Abstract: In this work, a numerical study of the formation of plasma periodic subwavelength nanogratings in fused
silica along the propagation of a focused laser pulse is carried out. It is shown that the tightly focused beam
creates a supercritical plasma in the focal plane, which provides an effective reflection of the parts of incident
and reflected laser pulse. As a result, standing wave of ionization occurs which generates a plasma lattice with
a period equal to the period of the standing wave in the medium. The results of modelling allow us to
determine the optimal laser parameters in the regime of linear (geometrical) focusing when the contrast
nanogratings can emerge. Analysis of energy release processes with subsequent melting of the fused silica
sample confirms the previously proposed mechanism of laser modification.
1 INTRODUCTION
In recent decades, significant efforts have been
dedicated to explore the intricate hierarchical
processes involved in altering physical properties of
materials exposed by highly focused femtosecond
laser pulses (Gattass and Mazur, 2008; Taylor, et. al.,
2007; Bulgakova, et. al., 2015). Advanced ultrafast
laser facilities have uncovered new mechanisms
underlying the interaction between electromagnetic
fields, plasma, and materials. These interactions
result in diverse structural changes in transparent
dielectric materials, including the generation of
micro- and nanoscale voids, densification zones and
micro-tracks (Shimotsuma, et. al., 2005; Sun, et. al,
2007; Beresna, et. al., 2011; Dai, et. al, 2016;
Mizeikis, et. al., 2009), periodic shifts in refractive
indices (Schaffer, et. al., 2001; Wang, et. al., 2007;
Mermillod-Blondin, et. al., 2008) etc.
Fused silica glass has garnered significant attention
since the publication of a pioneering work
(Shimotsuma, et. al., 2003) that initially introduced
the concept of creating birefringent volume
a
https://orcid.org/0000-0002-1538-3433
b
https://orcid.org/0000-0002-4883-3349
c
https://orcid.org/0000-0002-7300-3785
nanogratings in this material. Subsequent studies by
multiple scientific groups (Desmarchelier, et. al.,
2015; Bulgakova, et. al., 2013) have unveiled several
key mechanisms behind the formation of these
structures. These mechanisms include the coupling of
electron plasma waves with the incident light
(Shimotsuma, et. al., 2005; Shimotsuma, et. al.,
2003), the formation of nanoplasmas due to localized
field enhancements and their self-organization into
nanoscale patterns (Bhardwaj, et. al., 2006; Taylor, et.
al., 2008), and the attractive interaction and rapid
confinement of exciton-polaritons (Beresna, et. al.,
2012).
More recently, a novel approach to forming
volume nanogratings was introduced (Kudryashov,
et. al., 2021; Kudryashov, et. al., 2022). According to
the proposed mechanism the plasma stage of matter
self-organization in the dielectric volume involves the
following steps: (i) formation of highly reflective
electron-hole plasma of near-critical density in the
area of linear focus, (ii) longitudinal interference of
the reflected and incident parts of linearly polarized
femtosecond pulse in the pre-focal region, forming
Bogatskaya, A., Volkova, E. and Popov, A.
Subwavelength Plasma Gratings Formation in the Process of Laser Modification in the Volume of Fused Silica.
DOI: 10.5220/0012375200003651
Paper published under CC license (CC BY-NC-ND 4.0)
In Proceedings of the 12th International Conference on Photonics, Optics and Laser Technology (PHOTOPTICS 2024), pages 15-20
ISBN: 978-989-758-686-6; ISSN: 2184-4364
Proceedings Copyright © 2024 by SCITEPRESS – Science and Technology Publications, Lda.
15

the near-plane standing electromagnetic wave and the
corresponding ionization wave (plasma sheets) with
the period 𝜆2𝑛
⁄
, where 𝜆 is the wavelength of
exposed laser radiation, 𝑛
=𝑅𝑒[
𝜀
(
𝑧
)
] is the real
part of plasma refractive index, (iii) excitation and
interference of interfacial (at the boundary between
weakly/strongly photoexcited dielectric layers) sub-
wavelength plasmons, producing in each plasma
sheet a periodic modification along the laser
polarization with the period equal to half of the
plasmon wavelength Λ
2
⁄
~𝜆 2𝑛
⁄
. The recent
experimental studies (Kudryashov, et. al., 2022) have
shown that better implementation of the proposed
nanostructuring appears in a linear (pre-filamentary
regime). However, despite a number of experimental
studies, the assignment of nanopatterns to given laser
focusing regimes (the dependence of such
nanostructuring mechanism on the parameters of
laser exposure in the linear focusing regime) remains
not completely clear. In particular, the reproducibility
of well written («contrast») periodic structures in a
number of dielectric materials remains an important
and unexplored issue. Thus, it seems relevant to
develop rigorous numerical models to verify the
proposed mechanism, as well as to more accurately
predict the optimal parameters of focusing, duration,
and intensity of laser radiation for the best realization
of contrast nanostructures in the experiment.
In this work we perform a self-consistent
numerical modelling of a focused subpicosecond
laser pulse propagation in fused silica together with
the generation and evolution of electron-hole plasma
in order to verify the first step of the proposed
mechanism (i.e. plasma gratings formation along the
pulse propagation) for the parameters that are rather
close to those in recent experiments (Kudryashov, et.
al., 2022; Kudryashov, et. al, 2023). Our modelling
shows that strong reflection occurs in the region of
focal plane, which induces subsequent pulse
reflection from the focal plasma with the formation of
a series of plasma sheets in the pre-focal region. The
conducted analysis enables to reveal the optimal laser
parameters in the regime of linear (geometrical)
focusing when the most distinct subwavelength
plasma gratings can be generated.
2 MODELLING AND METHODS
According to the series of conducted experiments in
fused silica (Kudryashov, et. al., 2022; Kudryashov,
et. al, 2023) we choose pulses up to 1 µJ energy at
1030 nm wavelength and sub-femtosecond duration.
As in experiments the pulse repetition rate is low
enough (~100 kHz) compared to the characteristic
times of plasma diffusion and recombination, we can
neglect the inter-pulse effects, thus considering the
only intra-pulse dynamics laser induced solid-state
plasma.
Wave equation for the field propagation of a
linearly polarized pulse in a dielectric along z axis
reads:
∇
𝐸=
()
с
+
((,)
(,))
.
(1)
Here 𝜀
(
𝑧
)
=𝑛
≅2.1 is the dielectric permittivity
of fused silica (we assume that there is no dispersion
within the laser pulse spectrum width) 𝑛
is the
refractive index, and j is the current density created
by electrons in the conduction zone, 𝑗
is the so-
called ionization current due to the losses of field
energy during ionization (transitions between the
valence and the conduction zones). In general,
equation (1) is two-dimensional and describes the
focusing of the beam in some area inside the
dielectric, where electrons arise as a result of
multiphoton (or tunnel) ionization. We will solve the
problem (1) in the quasi one-dimensional
approximation (the validity of this approach will be
analyzed later):
(,)
=
()
с
(,)
+
(
)
.
(2)
According to the initial conditions of the problem, the
laser pulse is located on the grid in the region to the
left of the focal region and moves towards it. The
coordinate of the leading edge of the pulse 𝑧
∗
is such
that the entire pulse is to the left of the focal plane.
The pulse is characterized by a "sine-square"
envelope:
𝐸
(
𝑧,𝑡= 0
)
=𝐸
𝑠𝑖𝑛
𝜋
(
𝑧−𝑧
∗
)
ℓ
,
𝑧∈
{
𝑧
∗
,𝑧
∗
+ℓ
}
;
𝐸
(
𝑧,𝑡=0
)
=0,𝑧∉
{
𝑧
∗
,𝑧
∗
+ℓ
}
.
(3)
Here ℓ=0.012 cm is the length of the laser pulse
which is determined by the base of the pulse. Such a
pulse is rather close for the Gaussian pulse with the
pulse duration 𝜏
=0.3 ps (FWHM). Focusing of the
laser pulse during its propagation was taken into
account by multiplying the solution of equation (2) by
the function 𝐹(𝑧) which is a geometric factor
determining the degree of beam broadening as it
PHOTOPTICS 2024 - 12th International Conference on Photonics, Optics and Laser Technology
16

moves away from the focal plane. We define this
function by the expression
𝐹
(
𝑧−𝑧
)
=1
1+
,
(4)
where 𝑧
is the position of the focal plane, 𝑧
is the
beam focal length. In this case, the focused field
𝐸
(𝑧,𝑡) at the point with coordinate z will be obtained
via the solution (2) as
𝐸
(
𝑧,𝑡
)
=𝐸(𝑧,𝑡)×𝐹(𝑧).
(5)
It is the field that will determine the birth and
dynamics of electrons in the fused silica volume. The
current 𝑗(𝑧,𝑡) in equation (2) will be determined
within the framework of the Drude model:
𝚥
(𝑧,𝑡)
+𝜈
𝑗
(𝑧,𝑡)=
∗
𝐸
(
𝑧,𝑡
)
.
(6)
Here 𝜈
≈3∙10
s
-1
is the transport frequency of
electron scattering in the conduction band (we do not
take into account the effect of changing the transport
frequency as a result of its heating), 𝑛
is the electron
concentration, 𝑚
∗
=0.5𝑚
is the effective mass of
electrons in fused silica (𝑚 is the mass of an electron).
Equation (6) was solved at each node of the spatial
grid where the function 𝐸
(
𝑧,𝑡
)
is defined. Here we
also suppose that the number of electrons per field
period is practically unchanged. To analyse the
evolution of electron-hope plasma in the dielectric
volume, the following equation is solved
=𝐷
+𝑊
𝐼
(
𝑧,𝑡
)
(𝑁
−𝑛
)+
𝜈
(
𝐼
)
𝑛
1−
−
,
(7)
where 𝑁
=2.1 ×10
cm
-3
is the neutral atoms
concentration, D is the electron diffusion coefficient
which was estimated as 𝐷~
≈300 cm
2
/s, where
𝑉
≈10
cm/s is the Fermi speed, 𝜏
=150 fs is the
mean recombination time in fused silica (Audebert,
et. al., 1990), 𝑊
𝐼
(
𝑧,𝑡
)
is the rate of ionization in
fused silica calculated using the Keldysh formula
(Bogatskaya, et. al., 2023), 𝜈
(𝐼)=
(,)
∗
is the frequency of impact ionization. In expression
𝜈
(𝐼) one should set: 𝐼
=9 eV which is a value of
bandgap in fused silica, 𝜔 is the frequency of laser
radiation. It is worth noting that the radiation intensity
appearing in the expressions of multiphoton
(Keldysh) and impact ionization is calculated as
𝐼
(
𝑧,𝑡
)
=
〈
𝑛
𝐸
(
𝑧,𝑡
)
〉
, where brackets mean
averaging over the period of oscillation of the wave
field. The ionization current used in equation (2) can
be written as
𝑗
=
〈
〉
=
𝑊
𝐼
(
𝑧,𝑡
)
(𝑁
−𝑛
),
(8)
where
〈
𝐸
〉
is an averaged over the period field
𝐸
(
𝑧,𝑡
)
.
3 RESULTS AND DISCUSSION
Below we perform simulations for the following laser
beam parameters (see Table 1). In particular, we
choose the values of focal waists corresponding to the
focusing of 𝜆=1030 nm laser pulse by micro-
objective lenses with different values of numerical
aperture NA = 0.65, 0.55, 0.25 which are available at
laser workstation based on the femtosecond Yb-
doped fiber laser Satsuma (Amplitude Systems,
Pessac, France) with the fundamental wavelength λ =
1030 nm used in Lebedev Physical Institute RAS for
corresponding experiments on laser misstructuring
(Kudryashov, et. al., 2021; Kudryashov, et. al., 2022;
Kudryashov, et. al, 2023). The intensity range in
simulations is also determined by pulse energies and
durations available in the experiments in the pre-
filamentary regime. Recent analysis carried out in
(Bogatskaya, et. al., 2023) has demonstrated that the
intensity range required for effective ionization of a
sample lies in the range of 10-100 TW/cm
2
. It is worth
noting here that, based on the data in Table 1, the
spatial pulse length ℓ≫𝑧
, which makes the quasi-
one-dimensional approximation acceptable for
analyzing the propagation of the pulse wave field in
the near-focal region.
Table 1: Focused laser parameters.
𝐼=10 ÷ 100TW/cm
2
(peak intensity of the pulse)
ℓ=0.012 cm
𝑧
~2-30 µm
𝑧
=0.045 c
m
𝑧
∗
=0.0216 c
m
Let us start with the data on plasma density profiles
formed in the near focal region for 𝑧
=2 µm (this
corresponds to tight focusing conditions: NA~0.25)
for different values of laser intensity (Figure 1). The
profiles of plasma structures demonstrate the
appearance of periodicity with increasing pulse
Subwavelength Plasma Gratings Formation in the Process of Laser Modification in the Volume of Fused Silica
17
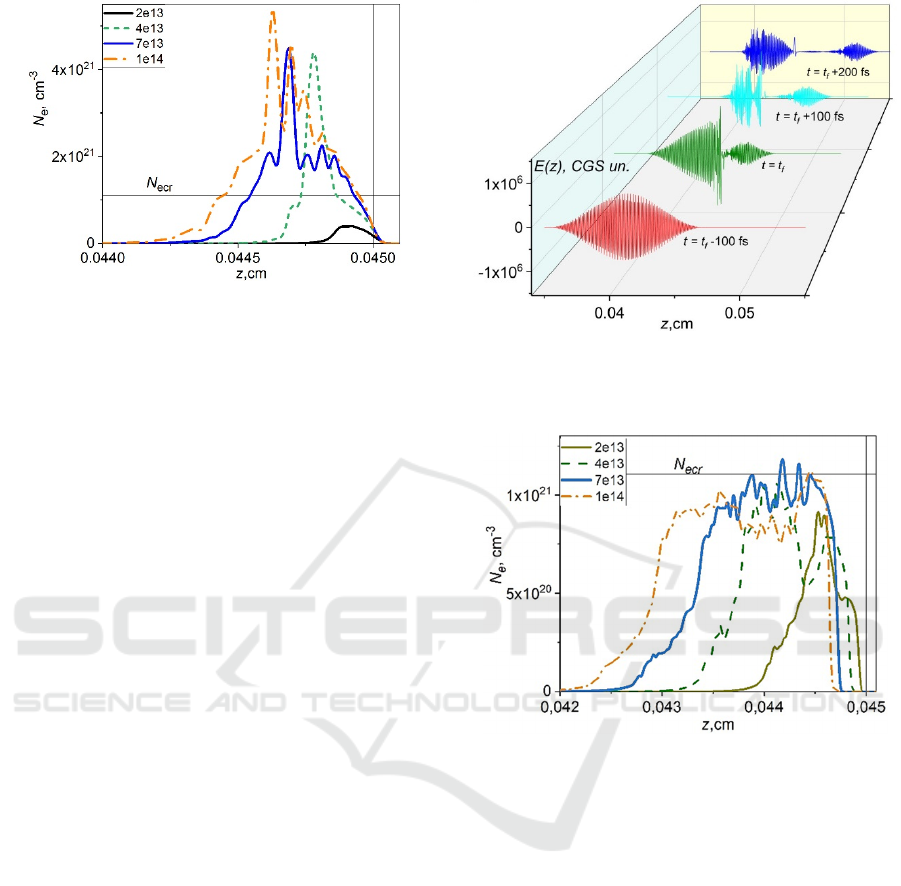
Figure 1: Plasma density profiles formed along the laser
pulse propagation in the pre-focal region for different peak
pulse intensities in W/cm
2
(see the plot legend). The value
of focal waist 𝑧
= 2 µm. The instant of time (𝑡=𝑡
)
approximately corresponds to the focusing of the central
part of the beam. The vertical grid line corresponds to the
position of focal plane. Horizontal grid indicates the value
of critical electron density (𝑁𝑒
=1.1×10
cm
-3
).
intensity. In addition, with increasing intensity, the
region of high ionization of the medium increases,
leading to supercritical electron concentrations and,
as a consequence, effective reflection of the laser
pulse. It is also worth noting that the formation of
structures occurs in the pre-focal region. To verify the
proposed idea of nanograting formation, based on the
pulse reflection from the focal plasma, we present
data on the wave field of the pulse at different times
(Figure 2). One can see that the area of effective
interaction of the incident and reflected parts of the
laser pulse occurs in the pre-focal region, while the
transmitted through the focal plane part turns out to
be insignificant for plasma formation.
It is worth noting that the spatial length of the
periodic plasma formation in the direction of laser
pulse propagation, in addition to the intensity, will
also be determined by the value of the focal waist. For
further analysis of the dependence of plasma grating
formation on the laser focusing length we present the
simulations of plasma density for the value of the
focal waist 𝑧
=7.2 µm (see Figure 3). Comparing the
electron density profiles presented in Figures 1 and 3,
it is appropriate to conclude that by increasing the size
of the focal waist, we thereby increase the spatial area
of effective ionization by a standing wave formed
during pulse reflection. On the other hand, as 𝑧
increases, one simultaneously observes a drop in the
maximum concentration level, which, in turn,
worsens the reflection coherence and leads to
decrement in the contrast of structures (the difference
in the degree of ionization at the nodes and antinodes
of the standing wave).
Figure 2: Pulse propagation for different instants of time (t
f
corresponds to the moment of focusing of the central part
of the pulse). Peak intensity is 70 TW/cm
2
.
Figure 3: Plasma density profiles formed along the laser
pulse propagation in the pre-focal region for different peak
pulse intensities in W/cm
2
(see the plot legend). The value
of focal waist 𝑧
= 7.2 µm. The instant of time is equal to
𝑡
+ 100 fs (instant of time at which the maximum electron
concentration in plasma gratings is reached). The vertical
grid line corresponds to the position of focal plane.
Horizontal grid indicates the value of critical electron
concentration (𝑁𝑒
=1.1×10
cm
-3
).
Thus, further increase of the focal waist length in
a given range of intensities does not ensure the
achievement of sufficient electron concentrations, as
a consequence, the periodicity of plasma lattices is
washed out (see Fig. 4). Importantly, in this case the
formation of plasma occurs in the region of space
farther from the focal plane, thus most of the pulse is
absorbed in the pre-focal region and does not reach
the focusing plane.
PHOTOPTICS 2024 - 12th International Conference on Photonics, Optics and Laser Technology
18
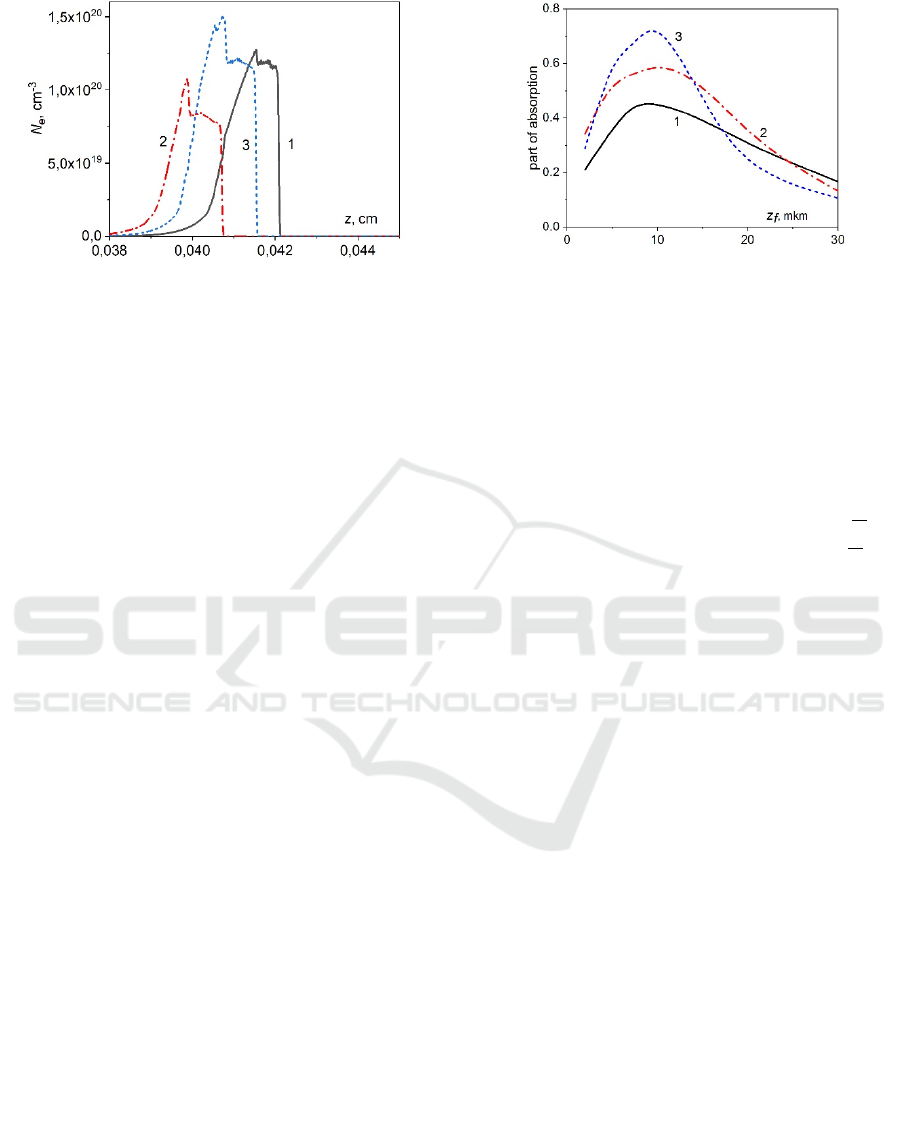
Figure 4: Plasma density profiles formed along the laser
pulse propagation in the pre-focal region for different peak
pulse intensities (in W/cm
2
): 1) 2∙10
, 2) 3∙10
, 3) 5∙
10
. The value of focal waist 𝑧
=30 µm. The instant of
time is the same as in Fig. 1.
Based on the analysis of simulation data, there
exist the optimal focusing parameters at which it is
possible to realize the most contrasting plasma lattice
profiles within the proposed mechanism. Figure 5
shows the dependence of plasma absorption versus
the length of the focal waist for three values of pulse
peak intensity. One can see that the highest absorption
in plasma can be reached for 𝑧
~5 − 10 µm. Indeed,
a shortening of the focal waist leads to a reduction of
the region of high ionization and, as a consequence,
pulse absorption drops; on the other hand, a
significant increase of 𝑧
results in smoother
dynamics of the pulse absorption during propagation,
which in turn worsens the process of its effective
reflection in the focusing zone. As was mentioned,
the contrast of plasma gratings is determined by the
degree of coherence of the incident and reflected parts
of the pulse, which turns out to be easier to implement
with tighter focusing conditions.
In conclusion, we would like to note that the
process of further modification of the dielectric
material is associated with the processes of heat
transfer and subsequent melting of the sample, which
will differ in intensity in the regions of weak and strong
sample ionization. Below we give qualitative estimates
of the processes of heating and melting of the sample.
From the data in Figure 5, we can see that the
maximum fraction of absorbed energy in the ionization
process is ~ 60 %. Assuming that the initial pulse
energy is ~0.5 µJ (0.1-1 µJ according to the
experiments (Kudryashov, et. al., 2021; Kudryashov,
et. al., 2022; Kudryashov, et. al, 2023)), the absorbed
energy can be estimated as 𝑄
≈0.3 µJ. Here we
suppose that the main contribution to the energy
absorption is made by the process of photoionization
of electrons. The energy required to heat the substance
to the melting temperature can be estimated as:
Figure 5: Plasma absorption versus the focal waist length
for different peak intensities of laser radiation (in W/cm
2
):
1) 2∙10
, 2) 3∙10
, 3) 5∙10
.
Δ𝑄=𝐶∙𝑀∙∆𝑇≈0.15 µJ,
(9)
where 𝐶=1.05 J/(g K) is the specific thermal
capacity of silica, 𝑀 is the mass of laser exposed
substance and ∆𝑇 is the difference between initial
temperature and temperature of melting ( 𝑇
≈
2000 K [29]) from the room temperature 𝑇
=300 K.
We estimate the mass 𝑀 as 𝑀≅𝜌∙
𝑆
∙
𝐹
(
𝑧−𝑧
)
𝑑𝑧 with 𝜌=2.2 g/cm
3
to be the fused
silica density and the beam area in the focal waist 𝑆
.
For typical values from the experiment (Kudryashov,
et. al., 2022; Kudryashov, et. al, 2023) 𝑆
≈10
µm
and 𝑧
=7.2 µm one obtains 𝑀≈10
g. The
energy required to melt a substance heated to the
melting point can be estimated via the expression:
Δ𝑄
=𝐿∙𝑀≈0.01 µJ.
(10)
Here 𝐿=140 J/g is the heat of melting in fused
silica. Thus, the above estimates show that the
absorbed energy 𝑄
is sufficient for heating with the
subsequent the formation of melting zones leading to
residual modification of the fused silica sample. The
melted regions after the sample cooling will be
characterized by a modified refractive index which
will differ from the initial value 𝑛
by an amount of
the order of Δ𝑛~10
which is confirmed by recent
experiments (Kudryashov, et. al., 2021; Kudryashov,
et. al., 2022; Kudryashov, et. al, 2023).
4 CONCLUSIONS
To conclude, a numerical analysis was conducted to
investigate the focused femtosecond laser radiation
exposure on solid dielectric materials. The aim was to
verify the proposed model that describes the
formation of plasma sheets during the reflection of
Subwavelength Plasma Gratings Formation in the Process of Laser Modification in the Volume of Fused Silica
19

laser pulse from the focal plasma with supercritical
electron concentration. The obtained results allow us
to identify the specific laser focusing conditions
necessary for this regime of material nanostructuring.
Notably, the research has revealed that the formation
of contrast plasma lattices requires a tightly focused
laser conditions. These findings represent a crucial
step in comprehending the intricate mechanisms
involved in modifying solids and the underlying
physical processes. It brings us closer to the
development of an advanced theoretical model that
will enhance our ability to precisely control
microscale laser modifications in solid dielectric
materials.
ACKNOWLEDGEMENTS
This research was funded by the Russian Science
Foundation (project no. 22-72-10076).
REFERENCES
Gattass, R., Mazur, E. (2008). Nature Photon, 2, 219–225.
Taylor, R. S., Hnatovsky, C., Simova, E., Pattathilet, R.
(2007). Optics Letters, 32 (19), 2888-2890.
Bulgakova, N. M.; Zhukov, V. P.; Sonina, S. V.;
Meshcheryakov, Y.P. (2015). J. Appl. Phys., 118 (23),
233108.
Shimotsuma, Y.; Hirao, K.; Qiu, J. R.; Kazansky, P. G.
(2005). Modern Phys. Lett. B, 19, 225.
Sun, H.Y.; Song, J.; Li, C.B.; Xu, J.; Wang, X. S.; Cheng,
Y.; Xu, Z. Z.; Qiu, J. R.; Jia, T. (2007). Appl. Phys. A,
88, 285.
Beresna, M.; Gecevičius, M.; Bulgakova, N. M.; Kazansky,
P. G. (2011). Opt. Express, 19, 18989.
Dai, Y.; Patel, A.; Song, J.; Beresna, M.; and Kazansky, P.
G. (2016). Opt. Express, 24, 19344
Mizeikis, V.; Juodkazis, S.; Balciunas, T.; Misawa, H.;
Kudryashov, S.I.; Ionin, A.A.; Zvorykin, V.D. (2009).
J. Appl. Phys., 105, 123106.
Schaffer, C. B.; Brodeur, A.; García, J. F.; Mazur, E.
(2001). Opt. Lett., 26, 93.
Wang, Z.; Sugioka, K.; Hanada, Y.; Midorikawa, K.
(2007). Appl. Phys. A, 88, 699.
Mermillod-Blondin, A.; Burakov, I. M.; Meshcheryakov,
Y. P.; Bulgakova, N. M.; Audouard, E.; Rosenfeld, A.;
Husakou, A.; Hertel, I. V.; Stoian, R. (2008). Phys. Rev.
B, 77, 104205
Shimotsuma, Y.; Kazansky, P. G.; Qiu, J. R.; Hirao, K.
(2003). Phys. Rev. Lett., 91, 247405.
Desmarchelier, R.; Poumellec, B.; Brisset, F.; Mazerat, S.
and Lancry, M. (2015). World Journal of Nano Science
and Engineering, 5, 115-125.
Bulgakova, N. M.; Zhukov, V. P.; Meshcheryakov, Yu. P.
(2013). Appl. Phys. B, 113(3), 437-449.
Bhardwaj, V. R.; Simova, E.; Rajeev, P. P.; Hnatovsky, C.;
Taylor, R. S.; Rayner, D. M.; Corkum, P.B. (2006).
Phys. Rev. Lett., 96, 057404.
Taylor, R.; Hnatovsky, C.; Simova, E. (2008). Laser
Photonics Rev., 2, 26.
Beresna, M.; Gecevičius, M.; Kazansky, P. G.; Taylor, T.;
Kavokin, A. (2012). A. Appl. Phys. Lett., 101, 053120.
Kudryashov, S. I.; Danilov, P. A.; Smaev, M. P.; Rupasov,
A. E.; Zolot’ko, A. S.; Ionin A. A.; Zakoldaev, R. A.
(2021). JETP Lett., 113, 493-497.
Kudryashov, S.; Rupasov, A.; Kosobokov, M.;
Akhmatkhanov, A.; Krasin, G.; Danilov, P.; Lisjikh, B.;
Abramov, A.; Greshnyakov, E.; Kuzmin, E.; et al.
(2022). Nanomaterials, 12, 4303.
Kudryashov, S.; Rupasov, A.; Smayev, M.; Danilov, P.;
Kuzmin, E.; Mushkarina, I.; Gorevoy, A.; Bogatskaya,
A.; and Zolot’ko, A. (2023) Nanomaterials, 13(6),
1133.
Audebert, P.; Daguzan, Ph.; Dos Santos, A.; Gauthier, J. C.;
Geindre, J. P.; Guizard, S.; Hamoniaux, G.; Krastev, K.;
Martin, P.; Petite, G.; and Antonetti, A. (1994). Phys.
Rev. Lett., 73 (14), 1990.
Bogatskaya, A.; Gulina, Yu.; Smirnov, N.; Gritsenko, I.;
Kudryashov, S.; and Popov, A. (2023). Photonics, 10,
515.
PHOTOPTICS 2024 - 12th International Conference on Photonics, Optics and Laser Technology
20
