
Comparing 3D Shape and Texture Descriptors Towards Tourette’s
Syndrome Prediction Using Pediatric Magnetic Resonance Imaging
Murilo Costa de Barros
1 a
, Kaue Tartarotti Nepomuceno Duarte
2 b
, Chia-Jui Hsu
4
,
Wang-Tso Lee
3 c
and Marco Antonio Garcia de Carvalho
1 d
1
Computing Visual Laboratory, School of Technology - UNICAMP,
R. Paschoal Marmo, 1888 - Jd. Nova It
´
alia, 13484-332 - Limeira, S
˜
ao Paulo, Brazil
2
Vascular Imaging Laboratory, Calgary University,2500 University Dr NW, Calgary, AB T2N 1N4, Canada
3
Department of Pediatrics, National Taiwan University Hospital Hsinchu Branch, Hsinchu, 300001, Taiwan
4
Department of Pediatrics, National Taiwan University Children’s Hospital, Taiwan
Keywords:
Tourette Syndrome, GLCM, Texture Feature, Shape Feature, Image Processing, Classification, Machine
Learning, MRI.
Abstract:
Tourette Syndrome (TS) is a neuropsychiatric disorder characterized by the presence of involuntary motor and
vocal tics, with its etiology suggesting a strong and complex genetic basis. The detection of TS is mainly
performed clinically, but brain imaging provides additional insights about anatomical structures. Interpreting
brain patterns is challenging due to the complexity of the texture and shape of the anatomical regions. This
study compares three-dimensional texture and shape features using Gray-Level Co-occurrence Matrix and
Scale-Invariant Heat Kernel Signature. These features are analyzed in the context of TS classification (via
Support Vector Machines), focusing on anatomical regions believed to be associated with TS. The evaluation
is performed on structural Magnetic Resonance (MR) images of 68 individuals (34 TS patients and 34 healthy
subjects). Results show that shape features achieve 92.6% accuracy in brain regions like the right thalamus
and accumbens area, while texture features reach 73.5% accuracy in regions such as right putamen and left
thalamus. Majority voting ensembles using shape features obtain 96% accuracy, with texture features achiev-
ing 79.4%. These findings highlight the influence of subcortical regions in the limbic system, consistent with
existing literature on TS.
1 INTRODUCTION
Tourette Syndrome (TS) is a genetic condition with
neuroanatomical and neurophysiological alterations,
mainly characterized by motor and vocal manifesta-
tions commonly known as tics (Johnson et al., 2023).
The development of TS typically occurs before the
age of 18, with the first symptoms potentially emerg-
ing between the ages of 4 and 6 years. The tics can
change, either by decreasing or increasing in intensity
during the growth process. TS is known to affect ap-
proximately 1% of the world population and is more
commonly diagnosed in male children (Jones et al.,
2023). Tics can be classified into two categories: sim-
a
https://orcid.org/0000-0003-2452-8128
b
https://orcid.org/0000-0002-4074-3672
c
https://orcid.org/0000-0003-3231-9764
d
https://orcid.org/0000-0002-6303-5564
ple tics, consisting of blinking, involuntary shoulder
movement, neck and lip twitching, and in some cases,
even coughing or grunting; and complex tics, which
tend to be more drastic, such as self-injurious behav-
ior or jumping (Cen et al., 2020). Diagnosing the
syndrome is challenging due to the potential presence
of other comorbidities, such as Attention Deficit Hy-
peractivity Disorder (ADHD), Obsessive-Compulsive
Disorder (OCD), as well as the coexistence of anxi-
ety, depression, and other psychiatric manifestations
(Jones et al., 2023). (Figure 1)
TS is a complex topic of study due to changes in
specific brain regions, such as caudate, thalamus, and
certain cortical areas. However, these alterations are
often difficult to identify solely through medical ap-
pointments. While current literature express the ad-
vantages of diagnosing TS via clinical data (Pring-
sheim et al., 2023), the increased use of medical
imaging modalities, such as structural Magnetic Res-
474
Costa de Barros, M., Duarte, K., Hsu, C., Lee, W. and Garcia de Carvalho, M.
Comparing 3D Shape and Texture Descriptors Towards Tourette’s Syndrome Prediction Using Pediatric Magnetic Resonance Imaging.
DOI: 10.5220/0012374200003660
Paper published under CC license (CC BY-NC-ND 4.0)
In Proceedings of the 19th International Joint Conference on Computer Vision, Imaging and Computer Graphics Theory and Applications (VISIGRAPP 2024) - Volume 3: VISAPP, pages
474-481
ISBN: 978-989-758-679-8; ISSN: 2184-4321
Proceedings Copyright © 2024 by SCITEPRESS – Science and Technology Publications, Lda.
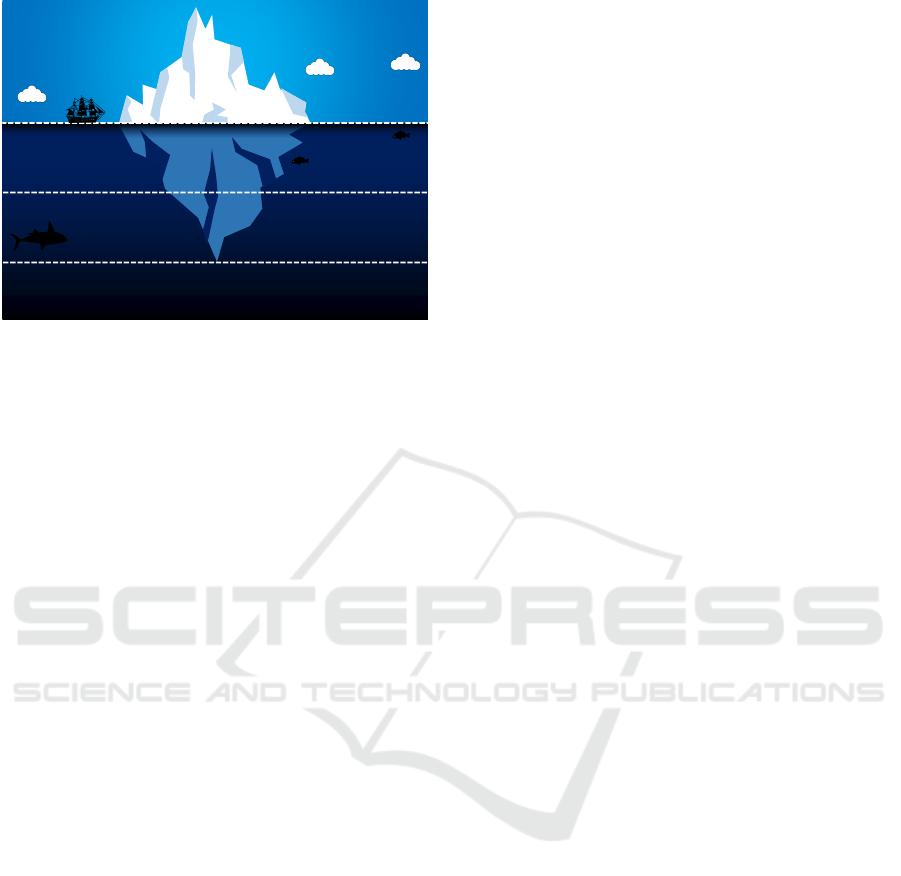
Tourette’s Syndrome
iceberg
Vocal tics
Motor tics
Attention
Deficit/Hyperactivit
y Disorder (ADHD)
Learning
Disabilities
Obsessive
Compulsive
Behaviors
Handwriting
Difficulties
Behavioral
Issues
Sleep
Issues
Impulsivity
Anxiety
Transition
Issues
Executive
Functioning
Deficits
Sensory
Processing
Issuesc
Social
Communicatin
Deficits
Figure 1: Tourette’s Syndrome: What we can see VS what
it can hide. Adapted from (Tourette.org, 2017).
onance (MR) images, is expected to provide benefi-
cial outcomes since it can identify patterns in the brain
that are hidden from human eyes. These patterns can
be captured by feature descriptors, techniques that ex-
tract specific information from a given structure. Two
prominent styles of feature extraction are either by
texture (repetitive occurrence of intensity tone in a re-
gion) or by shape (complex boundaries that surround
a certain region). However, there is no consensus on
which feature extraction style is better, leaving the
choice to the specific application.
In this work, we adopted a 3D Gray-Level Co-
occurrence Matrix (GLCM) (Haralick et al., 1973)
to extract texture features, whereas the 3D Scale-
Invariant Heat Kernel Signature (SIHKS) (Kamara-
jugadda and Pavani, 2022) has been used to extract
shape features. A further processing step is often per-
form to interpret these features, which can serve as
input to classify, for example, whether a child has TS.
Machine Learning (ML) techniques are commonly
used for this purpose, as they allows for unsupervised
feature classification.
The main goal of this work is to classify TS pa-
tients by comparing texture and shape features ob-
tained in MR images. The main contributions of this
work are: (1) classifying TS patients using shape and
texture features; (2) identifying brain regions that are
more susceptible to TS; and (3) studying which fea-
ture extractor ensemble is efficient for classifying TS.
The remaining sections of this paper are organized
as follows: the Section 2 outlines the existing work
and identifies the research gaps; In Section 3, it is de-
scribed our materials and proposed method; Section
4 provides our results, which are further discussed in
Section 5; Finally, Section 6 provides a summary and
conclusion of our work.
2 LITERATURE REVIEW
Adopting advanced computer methods to interpret TS
poses challenges due to slight known changes in both
texture and shape of anatomical regions. Most of
work often focus on clinical information, which might
not consider important unseen aspects of the subject’s
brain. However, such work that employs shape and
texture features have been frequently used in other
disorders (Betrouni et al., 2021).
Texture features have strong spatial characteriza-
tion that allows distinguishing between healthy and
symptomatic patients. In Silva (Silva et al., 2023),
a technique that involves GLCM and Wavelet trans-
forms is used to classify Alzheimer’s Disease (AD) in
three possible prodromal stages. They studied the im-
plication of using distinct classifiers, such as Support
Vector Machines (SVM) and Random Forests (RF),
towards improving the accuracy of the models. They
have shown that aligning texture and machine learn-
ing classification has the potential to unveil undiscov-
ered brain patterns. Aside from AD, texture features
have also being adopted in the context of Parkinson’s
Disease (PD) (Betrouni et al., 2021), where the au-
thors classified two symptomatic stages (early and
late PD) against healthy normal. First- and second-
order texture features have shown that regions like
putamen, thalamus, and caudate had shown signifi-
cant results. Shifting the attention to TS, 3D texture
patterns have been employed by (Barros et al., 2022)
in the context of identifying the statistically relevant
anatomical regions to identify TS. Each combination
of texture feature and anatomical regions was cor-
rected using the False-Discovery Rate (FDR), which
later indicated that regions such as putamen, caudate,
cingulate cortex, prefrontal, temporal, and parietal
cortex had the highest correlation with defining TS
patients.
Shape features are also a powerful domain where
techniques are responsible to distinguish the bor-
der/shape of an object. In Yeh (Yeh, 2020), the author
adopted shape analysis to diagnose brain tumors by
examining the morphology of association pathways in
the human brain. The study not only used structural
MR images but also diffusion MR scans. However,
the literature involving shape features combined with
medical images is still an open subject, but it deserves
attention since it has been proved that it is essential to
detect changes in boundaries. As expected, no other
work in our literature showed the use of shape extrac-
tion to identify TS patients.
It has been evident that using machine learning af-
ter image features (i.e., texture and shape) improves
the classification results. However, there is an ap-
Comparing 3D Shape and Texture Descriptors Towards Tourette’s Syndrome Prediction Using Pediatric Magnetic Resonance Imaging
475
parent limitation when those topics are implemented
towards identifying TS since most of the studies are
mainly performed using clinical input. We identified
that the major reasons for such limitation is the lack
of publicly available dataset and slight changes in the
brain between TS and healthy subjects rather than the
importance of image features.
This work differs from the literature due to: (1)
Addressing the understanding of TS using texture
and shape features; (2) Applying feature extraction
aligned with a classifier in specific regions, instead
of addressing the entire brain volume; and (3) Pre-
senting a selection of region-based classifiers that are
more suitable to predict TS.
3 MATERIALS AND METHOD
In this section, we define our materials and method
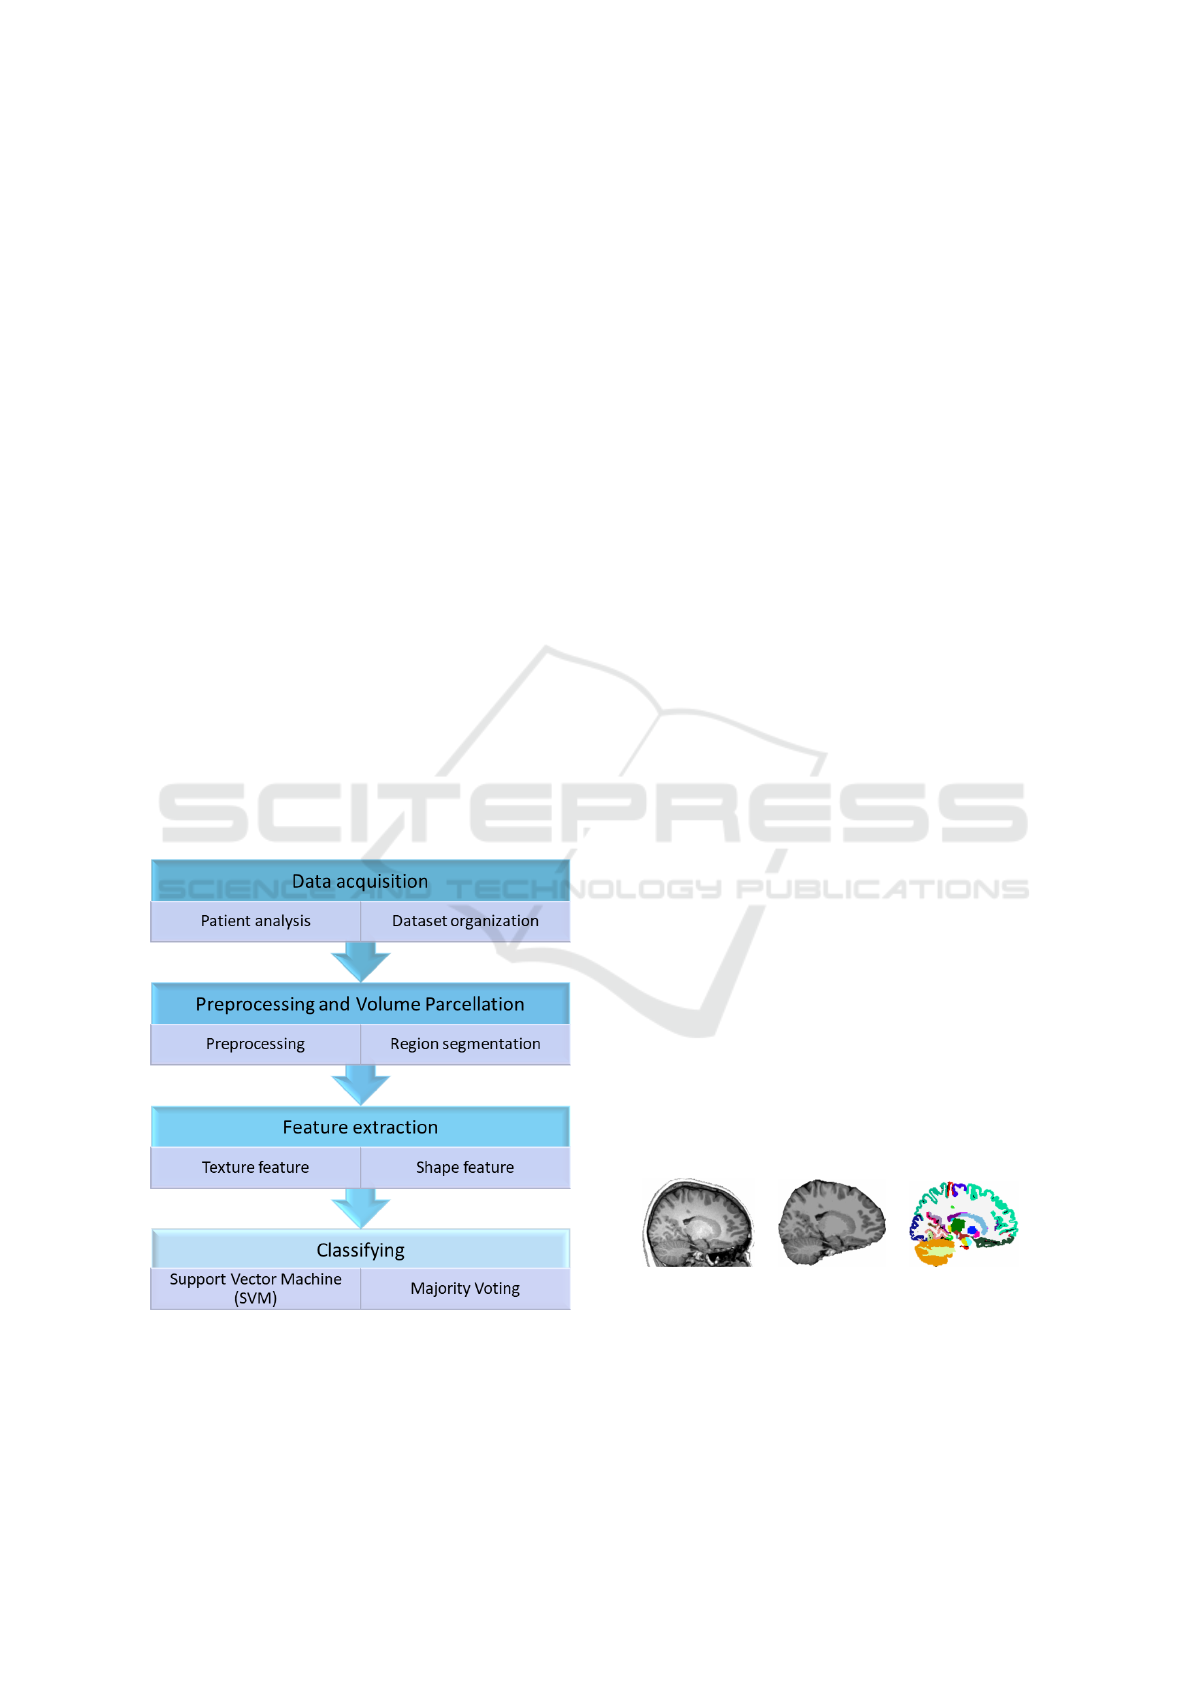
used for this work (Figure 2). In essence, our method
consists of four main steps: (1) Data acquisition,
describing the dataset used; (2) Preprocessing and
Volume Parcellation, consisting in the preprocessing
steps followed by the partitioning of the brain into
anatomical regions; (3) Feature extraction, consider-
ing texture and shape feature extraction and (4) Clas-
sification, involving a classifier to distinguish TS from
NH subjects.
Figure 2: Proposed method to classify TS patients.
3.1 Data Acquisition
For data collection, all patients followed a screening
process to select candidates based solely on ages be-
tween 6 to 14 years. The inclusion criteria of par-
ticipants are: 1) treatment naive participants with-
out other underying neurological disease (e.g., ADHD
and OCD); 2) images without excessive head motion
(artifacts) during scanning.
A total of 68 subjects were selected, organized
into two equal groups (i.e., 34 in each). The TS
group consisted of 23 males and 11 females, aged
between 6 and 13, whereas the Normal Health (H)
group comprised 24 males and 10 females, aged 6 to
14. For each patient, a structural Magnetic Resonance
(MR) images weighted in T1 (T1-w) were acquired
using the SIEMENS Triotrim model scanner. The fol-
lowing MR protocols were used for the acquisition:
time of echo = 2.98ms, repetition time = 2000ms,
inversion time = 900ms. Each volume consisted of
192 × 208 × 256, isotropic resolution of 1mm
3
, flip
angle = 9
◦
, and slice thickness = 1mm.
3.2 Preprocessing and Volume
Parcellation
parcellate automatic the brain volume. We adopted
Freesurfer version 6.0 to automatically segment brain
volume. In general aspects, Freesurfer can be decom-
posed into three major steps, as described by Fischl
(Fischl et al., 2002). (1) Image preprocessing, in-
volving normalization, contrast enhancement, noise
reduction, and registration. The preprocessed images
are skull-stripped to retain only brain tissue (Figure
3.b), (2) Brain surface inflation, building a surface
model to represent the cortical area, which is then
inflated to registered to a spherical atlas. (3) Brain
segmentation, assigning voxel-wise labels from dis-
tinct atlases. In this work, we adopted the DKT-atlas
(Figure 3.c), which decomposes the cortical area into
smaller groups. The regions of interest (ROI) used for
our work are presented in Table 1.
(a) (b) (c)
Figure 3: Preprocessing and volume segmentation for
freesurfer. (a) Original image normalization; (b) skull strip-
ping; (c) DKT-Atlas.
VISAPP 2024 - 19th International Conference on Computer Vision Theory and Applications
476

Table 1: Anatomical brain regions used in this work.
Deep Gray-matter Cortical area
Thalamus (L+R) Medial Orbitofrontal (L+R)
Caudate (L+R) Inferior Parietal (L+R)
Putamen (L+R) Superior Parietal (L+R)
Accumbens(L+R) Lateral Orbitofrontal (L)
Ventral DC (L+R)
L = left hemisphere, R = right hemisphere, DC = diencephalon.
3.3 Feature Extraction
Two styles of feature extraction techniques were con-
sider to this work: (1) texture, and (2) shape. Texture
and shape features are often used in controversial as-
pects, but we believe that important, yet complemen-
tary, information can be acquired from both of them.
Texture Features. The Gray Level Co-occurrence
Matrix (GLCM) was chosen to extract texture fea-
tures as it enables the analysis of the configuration
of pixel transitions in a volume. This technique has
been proven to provide reliable outcomes to distin-
guish pathological/disorder stages from normal sub-
jects (Syed et al., 2023; Gengec¸ Benli and Andac¸,
2023). In summary, GLCM involves the extraction
of dependable texture features through the occurrence
matrices (Haralick et al., 1973). The gray-scale values
within the image are represented in a co-occurrence
matrix as indices of a given row v
1
and column v
2
,
and the interaction function denoted as f (v
1
, v
2
) sig-
nifies the count of occurrences from v
1
to v
2
.
The computation of pixel transitions primarily re-
lies on two parameters: 1) the angle θ, set to four pos-
sible directions (0
◦
, 45
◦
, 90
◦
, 135
◦
), representing the
orientation between v
1
and v
2
and stored in distinct
GLCMs; 2) the distance d, set to 1 (adjacent corre-
spondences), corresponding to the pixel or voxel in-
terval between v
1
and v
2
. Two modifications have
been introduced to the GLCM methodology: Since
3D structures are being used (26-connectivity) as op-
posed to 2D structures (8-connectivity), additional di-
rections have been incorporated to calculate the dis-
placement vector (dx, dy, dz). The GLCM analy-
sis has been reformulated to focus on anatomical re-
gions rather than the entire brain, disregarding occur-
rences of voxels that do not belong to a specific re-
gion. In essence, each anatomical region is associ-
ated with its distinct GLCM. In conclusion, to con-
struct the final vector encapsulating information for
each region per subject, twenty-four GLCM-based
metrics have been computed: Autocorrelation; Joint
Average; Cluster Prominence; Cluster Shade; Cluster
Tendency; Contrast; Correlation; Difference Average;
Difference Entropy; Difference Variance; Joint En-
ergy; Joint Entropy; Informational Measure of Cor-
relation 1 and 2; Inverse Difference Moment; Maxi-
mal Correlation Coefficient; Inverse Difference Mo-
ment Normalized; Inverse Difference; Inverse Differ-
ence Normalized; Inverse Variance; Maximum Prob-
ability; Sum Average; Sum Entropy; Sum of Squares
(pyradiomics community, 2016).
Shape Features. In this work we apply Heat Kernel
Signature (HKS) according to (Bronstein and Kokki-
nos, 2010a) studies and evaluate the changes in a
more significant way between brain regions. HKS is
a local shape analysis that uses geometric properties
of forms(Bronstein and Kokkinos, 2010a). Through
a multiple mesh, the application of the heat diffusion
property can be represented by Equation 1.
∆ +
∂
∂t
µ(x,t) = 0 (1)
where the negative Laplace-Beltrami operator is rep-
resented by ∆, and the distribution and composition
of heat points at a location x over time t is denoted by
µ(x,t).
The main diagonal of the heat kernel is used as a
feature descriptor in surface analyses. For each point
x on the surface, an individual feature vector is com-
puted, representing its Heat Kernel Spectrum (Sun
et al., 2009). This calculation is represented by Equa-
tion 2, which describes the quantification of heat at a
specific point x after a particular time period t.
HKS(x) = c(x)(K
t1
(x, x), ..., K
tn
(x, x) (2)
where the variable c(x) satisfies the condition
||HKS(x)||
2
= 1. The calculation of HKS is based on
the analysis of the eigenvalues and the initial eigen-
functions of the Laplace-Beltrami operator.
Some limitations of HKS are related to scale sen-
sitivity. In this work, to address this potential obsta-
cle, we utilize the Scale-Invariant Heat Kernel Sig-
nature (SIHKS) (Bronstein and Kokkinos, 2010b), as
described below.
h
diff
(x) =
logK
α
τ2
(x, x) − log K
α
τ1
(x, x),
logK
α
τm
(x, x) − log K
α
τm−1
(x, x)
(3)
SIHKS(x) = ∥(F
h
diff
(x))(ω
1
, . . . , ω
6
)∥ (4)
where the representation of the Fourier transform is
given by F, and the frequency is ω.
Figure 4 illustrates the decomposition of SIHKS.
Comparing 3D Shape and Texture Descriptors Towards Tourette’s Syndrome Prediction Using Pediatric Magnetic Resonance Imaging
477

Figure 4: Distinct frequencies of SIHKS applied to the su-
perior parietal cortex.
3.4 Classification and Ensemble
Classification. The Support Vector Machine (SVM)
was chosen due to its ability to classify linearly sepa-
rable data with two classes (TS and control) through
the construction of hyperplanes (Feng et al., 2016).
We utilized a linear kernel and set the regulariza-
tion parameter C = 1, which essentially determines
the configuration of the hyperplane margin. The con-
struction of the hyperplanes can be defined as:
min
w,b
1
2
w
T
w +C
∑
i=1
max(0, 1 − y
i
(w
T
φ(x
i
) + b)) (4)
where, w, b are hyperplane parameters; C is the reg-
ularization parameter (strictly positive), and x repre-
sents the input variables.
After proper construction and adjustment of the
hyperplane, the SVM needs to distinguish between
the types of samples to be analyzed, as represented
by Equation 5.
I(x) = sgn(
n
∑
i=1
u
i
a
0
i
(x · x
i
) + b) (5)
To maintain the reliability of the results, we
adopted the application of k-fold cross validation.
The process was divided into n = 68, representing
the total number of samples in our dataset, with k =
10 indicating the partition of the data. This division
resulted in 8 sets with 7 samples each and 2 sets with
6 samples each, which were trained in 10 iterations.
Majority Voting. We adopted the ensemble via ma-
jority voting to combine the best anatomical regions
(identified by accuracy of the models). This step
is performed to aggregate predictions from multiple
models and enhance performance. Notably, we per-
formed the ensemble for two scenarios: texture fea-
tures followed by SVM and shape features followed
by SVM. The majority voting can be obtained by the
following formula:
Figure 5: Generation of a Election-based Majority voting
considering the top 3 regions in accuracy. This concept can
be extend to Top 5 regions. Predicting 1 means having TS,
and 0 is considered as normal control.
R
f
=
(
1 if
∑
N
i=1
R
i
N
> 0.5
0 otherwise
(6)
where R
f
denotes the final response, R
i
is the response
per region, and N is the number of regions specified
by Top N.
In other words, the majority voting process selects
the most frequently predicted class among the ensem-
ble of regions. For instance, if, for each patient, across
the top three regions, two indicate that the patient be-
longs to the TS class, and the other indicates the nor-
mal class, then the majority vote would assign the TS
class as the final prediction. Our results were ana-
lyzed by assessing the responses of the top three (Top
3) and top five (Top 5) best-performing regions in this
study. A more in-depth visualization of the Top 3 out-
comes is shown in Figure 5.
3.5 Computational Tools
The implementation of this work was carried out on a
macOS High Sierra version 10.13.6. with i5 process-
ing and 16Gb of RAM. Our codes was mostly devel-
oped in Python 3.8 using the Spyder platform. Our
approach was executed utilizing the subsequent tools
and methodologies:
1. Preprocessing and Volume Parcellation. Bash
scripts were created to automatically utilize the
Freesurfer tool with the recon-all command. We
separated the regions into independent volumes
(for texture analysis) and meshes (for shape anal-
ysis - using ITK).
2. Feature Extraction. We used pyRadiomics library
in Python to compute the GLCM for the volumes,
whereas we adopted an independent code to com-
pute the SIHKS in Matlab R2018a.
3. Classifying. The SVM was computed using the
scikit-learn package, while the Majority Voting
was coded from scratch.
The analyses and applications used in this study,
as well as the models and figures, can be verified and
VISAPP 2024 - 19th International Conference on Computer Vision Theory and Applications
478

downloaded from our freely-available GitHub reposi-
tory
1
.
4 RESULTS
In this study, five metrics were adopted, namely: (1)
Precision, denoted as P; (2) Recall, referred as R; (3)
F-score, denoted as F; (4) Accuracy, represented by
A;
These metrics are derived by incorporating values
such as true-positive (TP), true-negative (TN), false-
positive (FP), and false-negative (FN). The calcula-
tion of these evaluation metrics is expressed by the
following formulas:
P =
T P
T P + FP
, R =
T P
T P + FN
, F = 2 ×
P ∗ R
P + R
(7)
A =
T P + T N
T P + T N + FP + FN
(8)
Each metric was applied to evaluate both individ-
ual anatomical regions and their corresponding en-
sembles. We preferred ranking the regions by accu-
racy values, and including the top three (Top 3) and
five (Top 5) best regions as part of the ensembles us-
ing Majority Voting. The best regions, along with the
ensembles, are shown both for the shape- (Table 2)
and texture-based classification (Table 3). In Figure
6, we show the accuracy of each anatomical region,
followed by the ensembles (Top 3 and Top 5).
5 DISCUSSION
Tourette’s syndrome is an area that requires attention
since patients around the globe suffer from involun-
tary movements that can directly affect their social
integration. Patients who suffer from TS sometimes
try to mask their tics, possibly causing discomfort
and worsening the tic when released (Eapen et al.,
Table 2: Evaluation of the classification using Shape fea-
tures.
# Region Name A P R F
Individual brain regions
1 Accumbens (R) 92.6 91.4 94.1 92.7
2 Thalamus (R) 92.6 93,9 91.1 92.5
3 Lateral orbitofrontal (L) 91.1 93.7 88.2 90.9
4 Accumbens (L) 89.7 86.4 94.1 90.1
5 Medial orbitofrontal (R) 89.7 88.5 91.1 89.8
Ensembles
Top 3 90.0 83.0 100.0 91.0
Top 5 96.0 92.0 100.0 96.0
1
https://github.com/hidden-for-peer-review
2016). TS is often detected clinically, but patients can
mask the tic, thus generating possible false-negatives.
However, implementing techniques to identify brain
biomarkers for TS is a challenging task due to its sup-
posedly modest brain changes. Thus, our primary ef-
fort in this paper is classifying TS based on image fea-
tures to later enable a more in-depth understanding of
brain changes.
According to Figure 6 and Table 2, notably some
crucial regions achieved higher accuracy. The right
thalamus (92.6% accuracy in shape analysis) has the
role of integrating sensory (including emotional re-
sponses) and motor stimuli between the central and
peripheral nervous systems. This result aligns with
the current literature that highlights the thalamus as a
target structure to understand TS (Baldermann et al.,
2021). The right accumbens area (92.6% accuracy in
shape analysis) plays a vital role in regulating emo-
tional stimuli and is associated with the learning pro-
cess. This region is often used to study comorbidities
frequently observed in Tourette Syndrome, such as
ADHD (McCairn et al., 2016; Zhu et al., 2016). Al-
though the texture feature results have achieved lower
accuracy when compared to shape feature results, it is
crucial to highlight the pivotal role that understand-
ing texture changes helps to better discriminate TS
from normal control. The right putamen (73.5% ac-
curacy in texture analysis) plays a role in regulating
movement, initiating and modulating voluntary body
actions. This region, which is located in a subcortical
area forming part of the striatum, has been focused
on studying TS and its patterns (Rae et al., 2019).
The thalamus located in the left hemisphere (73.5%
accuracy in texture analysis) has a vital role in relay-
ing sensory information between the right part of the
body to the cerebral cortex. This region was studied
in order to characterize TS(M
¨
uller-Vahl et al., 2014).
Both classifiers (shape and texture) displayed sim-
ilar behavior in achieving high accuracy of thalamus
and the orbitofrontal and prefrontal cortex. Another
relevant pattern to mention is the location of the best
regions. In both techniques, the most influential re-
gions are subcortical, more precisely part of the lim-
Table 3: Evaluation of the classification using Texture fea-
tures.
# Region Name A P R F
Individual brain regions
1 Putamen (R) 73.5 72.2 76.4 74.2
2 Thalamus (L) 73.5 75 70.5 72.7
3 VentralDC (R) 70.5 68.4 76.4 72.2
4 Medial orbitofrontal (R) 66.1 65.7 67.4 66.6
5 Lateral orbitofrontal (L) 66.1 67.7 61.7 64.6
Ensembles
Top 3 77.9 77.1 79.4 78.2
Top 5 79.4 77.7 82.3 79.9
Comparing 3D Shape and Texture Descriptors Towards Tourette’s Syndrome Prediction Using Pediatric Magnetic Resonance Imaging
479
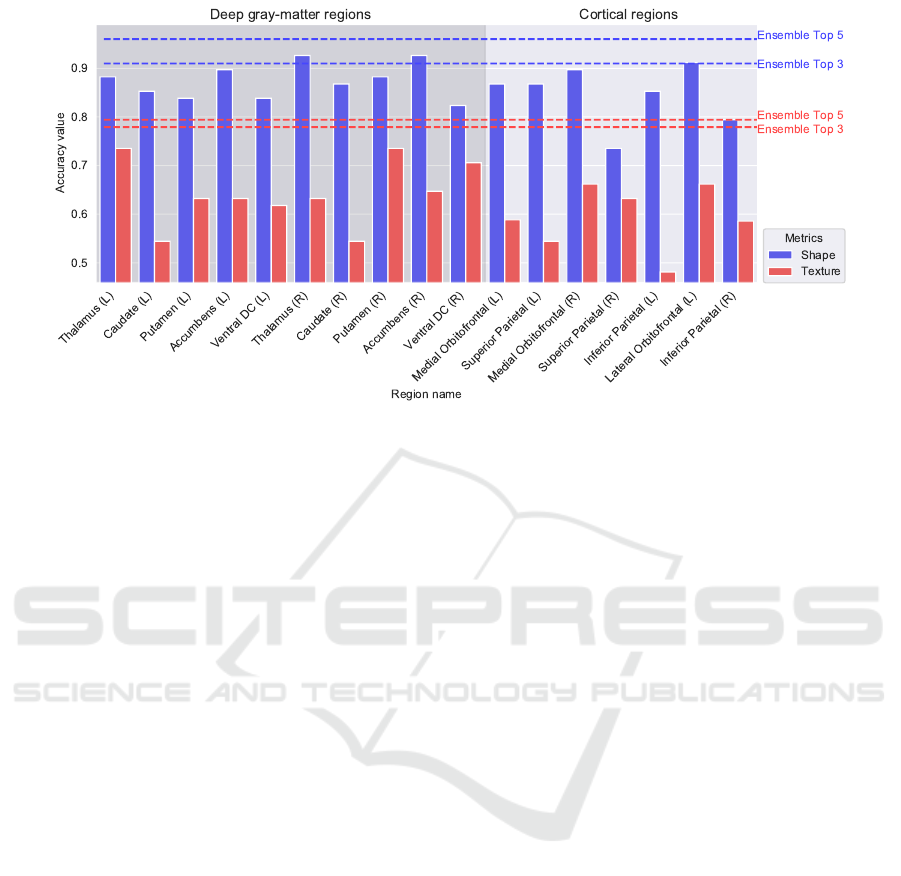
Figure 6: Accuracy values by regions, among shape features, texture, and combinations of the three and five best regions.
bic system of the brain, which are stimulated during
the occurrence of tics (Leisman and Sheldon, 2022).
In order to reinforce the robustness and achieve
higher accuracy of our method, we adopted ensem-
bles, which combined the best regions in each case.
When using shape features, we achieved the high-
est performance, reaching 96% accuracy in the Top
5, whereas we achieved 79% accuracy for the Top 5
in our texture analysis. This corroborates the effec-
tiveness of using ensemble methods when combining
distinct regions to achieve higher predictiveness. This
can possibly suggest that evaluating a combination
of regions instead of single regions can be a path to
thrive in the better understanding of TS.
6 SUMMARY & CONCLUSIONS
Exploring the application of texture and shape fea-
tures to evaluate anatomical brain regions in the
context of TS classification represents a novel area,
largely unexplored by the current state-of-the-art.
Thus, we proposed a comparative analysis between
two types of descriptors to discern which is more ef-
fective in predicting TS. We analyzed each individual
brain region separately, as well as their combination
into ensembles. We noticed that SVM demonstrated
higher accuracy when using shape features, while fur-
ther investigation is needed to grasp the potential of
texture features.
We observed that the regions of the limbic system,
more specifically the accumbens area and the thala-
mus, showed remarkable accuracy values in the anal-
ysis of shape features, while the putamen and the tha-
lamus presented higher accuracy in our texture anal-
ysis. The presence of the thalamus in both analyses
suggests that the region plays a fundamental role in
the occurrence of symptoms associated with TS. This
structure is responsible for integrating sensory infor-
mation and communicating with associative cortical
areas. On the other hand, the orbitofrontal medial cor-
tex has shown relevant accuracy in both descriptors,
aligning with the literature since it processes emo-
tional information, makes decisions, and regulates so-
cial behavior. The presence of these regions only re-
inforces the accuracy of the models presented in this
work and enables further questions about the impor-
tance of other regions.
The study sheds light to some future directions:
(1) the need for improved and more comprehensive
descriptors to distinguish TS from NH subjects; (2)
a study exploring deep learning as an automatic fea-
ture extraction method; (3) the adoption of alternative
classifiers and feature descriptors.
REFERENCES
Baldermann, J. C., Kuhn, J., Sch
¨
uller, T., Kohl, S., Andrade,
P., Schleyken, S., Prinz-Langenohl, R., Hellmich, M.,
Barbe, M., Timmermann, L., Visser-Vandewalle, V.,
and Huys, D. (2021). Thalamic deep brain stimulation
for tourette syndrome: A naturalistic trial with brief
randomized, double-blinded sham-controlled periods.
Brain Stimulation, 14.
Barros, M. C., Duarte, K. T., Lee, W.-T., Hsu, C.-J., and
de Carvalho, M. A. G. (2022). Analysis of the sta-
tistical significance of 3d texture features in mri im-
ages toward the detection of tourette’s syndrome. In
VISAPP 2024 - 19th International Conference on Computer Vision Theory and Applications
480

2022 35th SIBGRAPI Conference on Graphics, Pat-
terns and Images (SIBGRAPI), volume 1, pages 103–
108.
Betrouni, N., Moreau, C., Rolland, A.-S., Carriere, N.,
Chupin, M., Kuchcinski, G., Lopes, R., Viard, R.,
Defebvre, L., and Devos, D. (2021). Texture-based
markers from structural imaging correlate with motor
handicap in parkinson’s disease. Scientific Reports,
11:2724.
Bronstein, M. M. and Kokkinos, I. (2010a). Scale-invariant
heat kernel signatures for non-rigid shape recognition.
In 2010 IEEE Computer Society Conference on Com-
puter Vision and Pattern Recognition, pages 1704–
1711.
Bronstein, M. M. and Kokkinos, I. (2010b). Scale-invariant
heat kernel signatures for non-rigid shape recognition.
In 2010 IEEE Computer Society Conference on Com-
puter Vision and Pattern Recognition, pages 1704–
1711.
Cen, S.-s., Yu, J., Wang, Q., Deeb, W., Wang, K.-l., Shukla,
A. W., Malaty, I., Ramirez-Zamora, A., Zhang, J.-g.,
Hu, W., and Meng, F.-g. (2020). Multidisciplinary
telemedicine care for tourette syndrome: Minireview.
Frontiers in Neurology, 11.
Eapen, V., Cavanna, A. E., and Robertson, M. M. (2016).
Comorbidities, social impact, and quality of life in
tourette syndrome. Frontiers in psychiatry, 7:97.
Feng, W., Sun, J., Zhang, L., Cao, C., and Yang, Q. (2016).
A support vector machine based naive bayes algo-
rithm for spam filtering. In 2016 IEEE 35th Interna-
tional Performance Computing and Communications
Conference (IPCCC), pages 1–8. IEEE.
Fischl, B., Salat, D. H., Busa, E., Albert, M., Dieterich,
M., Haselgrove, C., van der Kouwe, A., Killiany, R.,
Kennedy, D., Klaveness, S., Montillo, A., Makris, N.,
Rosen, B., and Dale, A. M. (2002). Whole brain
segmentation: Automated labeling of neuroanatomi-
cal structures in the human brain. Neuron, 33(3):341–
355.
Gengec¸ Benli, S¸. and Andac¸, M. (2023). Construct-
ing the schizophrenia recognition method employing
glcm features from multiple brain regions and ma-
chine learning techniques. Diagnostics, 13(13):2140.
Haralick, R. M., Shanmugam, K., et al. (1973). Textural
features for image classification. IEEE Transactions
on systems, man, and cybernetics, 6:610–621.
Johnson, K. A., Worbe, Y., Foote, K. D., Butson, C. R.,
Gunduz, A., and Okun, M. S. (2023). Tourette syn-
drome: clinical features, pathophysiology, and treat-
ment. The Lancet Neurology, 22(2):147–158.
Jones, K. S., Saylam, E., and Ramphul, K. (2023). Tourette
syndrome and other tic disorders. StatPearls.
Kamarajugadda, K. K. and Pavani, M. (2022). Multi-
features assisted age invariant face recognition and
retrieval using cnn with scale invariant heat kernel
signature. In Fernandez, M. A. A. and Travieso-
Gonzalez, C. M., editors, Artificial Intelligence An-
nual Volume 2022, chapter 8. IntechOpen, Rijeka.
Leisman, G. and Sheldon, D. (2022). Tics and emotions.
Brain Sciences, 12(2).
McCairn, K., Nagai, Y., Hori, Y., Ninomiya, T., Kikuchi,
E., Lee, J.-Y., Suhara, T., Iriki, A., Minamimoto, T.,
Takada, M., Isoda, M., and Matsumoto, M. (2016). A
primary role for nucleus accumbens and related limbic
network in vocal tics. Neuron, 89(2):300–307.
M
¨
uller-Vahl, K. R., Grosskreutz, J., Prell, T., Kaufmann,
J., Bodammer, N., and Peschel, T. (2014). Tics are
caused by alterations in prefrontal areas, thalamus and
putamen, while changes in the cingulate gyrus reflect
secondary compensatory mechanisms. BMC Neuro-
science, 15(1).
Pringsheim, T., Ganos, C., Nilles, C., Cavanna, A. E.,
Gilbert, D. L., Greenberg, E., Hartmann, A., Hed-
derly, T., Heyman, I., Liang, H., Malaty, I., Malik,
O., Debes, N. M., Vahl, K. M., Munchau, A., Mur-
phy, T., Nagy, P., Owen, T., Rizzo, R., Skov, L., Stern,
J., Szejko, N., Worbe, Y., and Martino, D. (2023).
European society for the study of tourette syndrome
2022 criteria for clinical diagnosis of functional tic-
like behaviours: International consensus from experts
in tic disorders. European Journal of Neurology,
30(4):902–910.
pyradiomics community (2016). Radiomic features.
Rae, C. L., Critchley, H. D., and Seth, A. K. (2019). A
bayesian account of the sensory-motor interactions
underlying symptoms of tourette syndrome. Frontiers
in Psychiatry, 10.
Silva, J., Bispo, B., and Rodrigues, P. (2023). Structural
mri texture analysis for detecting alzheimer’s disease.
Journal of Medical and Biological Engineering.
Sun, J., Ovsjanikov, M., and Guibas, L. (2009). A con-
cise and provably informative multi-scale signature
based on heat diffusion. Computer Graphics Forum,
28(5):1383–1392.
Syed, A., Adam, R., Ren, T., Lu, J., Maldjian, T., and
Duong, T. Q. (2023). Machine learning with tex-
tural analysis of longitudinal multiparametric mri
and molecular subtypes accurately predicts pathologic
complete response in patients with invasive breast
cancer. PloS one, 18(1):e0280320.
Tourette.org, o. (2017). Iceberg illustration poster.
Yeh, F.-C. (2020). Shape analysis of the human association
pathways. NeuroImage, 223:117329.
Zhu, Y., Yang, D., Ji, W., Huang, T., Xue, L., Jiang,
X., Chen, L., and Wang, F. (2016). The relation-
ship between neurocircuitry dysfunctions and atten-
tion deficit hyperactivity disorder: A review. BioMed
Research International, 2016:1–7.
Comparing 3D Shape and Texture Descriptors Towards Tourette’s Syndrome Prediction Using Pediatric Magnetic Resonance Imaging
481
