
Real-Time Detection and Mapping of Crowd Panic Emergencies
Ilias Lazarou, Anastasios L. Kesidis and Andreas Tsatsaris
Department of Surveying and Geoinformatics Engineering, University of West Attica, Athens, Greece
Keywords: Panic Detection, Biometrics, Machine Learning, Classification, Real-Time Data.
Abstract: We present a real-time system that uses machine learning and georeferenced biometric data from wearables
and smartphones to detect and map crowd panic emergencies. Our system predicts stress levels, tracks stressed
individuals, and introduces the CLOT parameter for better noise filtering and response speed. We also
introduce the DEI metric to assess panic severity. The system creates dynamic areas showing the evolving
panic situation in real-time. By integrating CLOT and DEI, emergency responders gain insights into crowd
behaviour, enabling more effective responses to panic-induced crowd movements. This system enhances
public safety by swiftly detecting, mapping, and assessing crowd panic emergencies.
1 INTRODUCTION
Crowd panic emergencies are a significant public
safety concern, particularly in densely populated
areas like cities, sports events, concerts, and festivals.
These incidents can result in injuries, fatalities, and
property damage, often triggered by perceived
threats, rumors, or stampedes. Real-time detection
and mapping of such emergencies are vital for swift
response and evacuation.
Recent advancements in machine learning and
wearable technology offer new opportunities for real-
time detection and mapping. Our system utilizes
georeferenced bio-metric data from wearables and
smartphones, providing more accurate insights into
stress levels and movement patterns. It employs a
Gaussian SVM machine learning classifier to identify
stressed individuals. We introduce the Classifier
Level of Trust (CLOT) as a parameter to balance
detection speed and noise filtering.
Once a stressed individual is detected, the system
conducts real-time spatial analysis to track their
movement and identify nearby stressed individuals. It
creates dynamic areas based on trajectories and
adjacency. The system also introduces the Domino
Effect Index (DEI) to assess the severity of the
emergency by considering factors like panic
transmission rate, panicked crowd density, and
alignment with road networks.
Incorporating DEI enhances emergency detection
and response, ensuring public safety in densely
populated areas. Emergency responders can use this
information to de-ploy resources, evacuate affected
areas, and prevent escalation. The system's
components, including the machine learning
classifier and georeferencing, are detailed in
subsequent sections, along with an evaluation of its
effectiveness and potential applications. We also
outline future research directions in this field.
2 RELATED WORK
Panic, extensively studied in psychology and human
sciences, involves intense fear resulting from real or
perceived danger. It often occurs in groups or crowds,
leading to regressive behaviors like violence, jumps,
or collective suicide. Mass panic is an abnormal
response where a group moves faster than usual due
to alarming events like stampedes, fires, fights,
robberies, or riots.
In recent literature, several studies and systems
have concentrated on panic detection through the
utilization of Closed Circuit Television (CCTV)
technology. These surveillance methods scrutinize
human behavior by analyzing both still images and
video sequences of individuals or groups. For
instance, Hao et al. (Hao, 2016) have presented an
approach based on optical flow features to identify
crowd panic behavior, while Ammar et al. (Ammar,
2021) have outlined a continuous surveillance system
for a particular public location, employing a
stationary camera and a methodology for real-time
analysis of captured images.
Lazarou, I., Kesidis, A. and Tsatsaris, A.
Real-Time Detection and Mapping of Crowd Panic Emergencies.
DOI: 10.5220/0012372200003660
Paper published under CC license (CC BY-NC-ND 4.0)
In Proceedings of the 19th International Joint Conference on Computer Vision, Imaging and Computer Graphics Theory and Applications (VISIGRAPP 2024) - Volume 4: VISAPP, pages
485-491
ISBN: 978-989-758-679-8; ISSN: 2184-4321
Proceedings Copyright © 2024 by SCITEPRESS – Science and Technology Publications, Lda.
485

Another approach to panic detection systems
involves user intervention and community
engagement in reporting emergency events. While
disaster preparedness plans are crucial for community
safety, traditional methods of data acquisition and
distribution fall short, especially during time-
sensitive crises.
The Internet of Things (IoT) technology emerges
as a solution to acquire real-time da-ta and promptly
transmit it to experts for decision-making. Wearable
devices and IoT play a pivotal role in collecting
biometric data and conducting stress detection. The
wearables and IoT sector has seen exponential
growth, thanks to technological advancements in
sensors and chips. This growth allows real-time
sensor data to be combined with the capabilities of 5G
smartphones, providing essential information for
decision-making.
Recent research shows that the field of crowd
evacuation systems, quantitative analysis, and
visualization is still evolving. Notable contributions
include Tsai's work (Tsai, 2022), which uses
wearable data to predict panic attack disorders based
on time series data, incorporating physiological
factors and air quality into a prediction model.
Kutsarova and Matskin (Kutsarova, 2021)
employ mobile crowdsensing and wearables on the
CrowdS platform, utilizing smartwatch sensors to
detect abnormal events and trigger alarms. Alsalat's
research (Alsalat, 2018) focuses on using machine
learning with wearables to classify individuals as
stressed or calm during panic situations.
Sun et al. (Sun, 2021) address crowd behavior
during emergencies, particularly in earthquake
evacuations. They conducted an evacuation drill
experiment to analyze evacuation processes,
participation ratios, and behavior characteristics.
Their study includes a computer-aided quantitative
simulation, establishing a response rule equation for
crowds in emergencies, exploring panic behavior,
exit familiarity, and the relationship between training
time and exit familiarity. The study aims to optimize
the efficiency of evacuation processes and prevent
congestion and stampede accidents.
These studies collectively contribute to our
understanding of crowd panic and emergency
response, pushing the boundaries of current research
in this field.
In a related study, Zhang et al. (Zhang, 2023)
address the challenges of urban security and
management concerning crowd gatherings in large
public spaces like shopping malls, stations, and
entertainment venues. They propose a Crowd Density
Estimation Model (CDEM-M) that utilizes deep
learning and Geographic Information System (GIS)
technology. This model surpasses the limitations of
traditional crowd density estimation methods that rely
on human head features, which can be problematic in
high-altitude scenes or when head information is
obscured. The CDEM-M provides a comprehensive
solution by integrating GIS, offering a unified map
visualization interface for accurate crowd area ex-
traction through semantic segmentation. It considers
various aspects, including crowd information
extraction, geographic mapping, number estimation,
and map visualization.
Another study by Albarakt et al. (Albarakt, 2021)
explores the role of public spaces in cities, focusing
on their political, social, economic, and sustainability
aspects. The research investigates how streets,
commercial centers, squares, and cafes either support
or restrict public engagement. It also delves into the
evolving political use of public spaces, the
contestation over space, and the competition among
various stakeholders for dominance. Using examples
from the Middle East and ArcGIS mapping, the study
examines visual and verbal narratives of protest
events in contested public spaces. The findings have
potential implications for urban planning and
management strategies related to public spaces.
In conclusion, these studies illustrate the potential
of utilizing machine learning and sensor data for real-
time detection and mapping of crowd panic
emergencies. Each paper offers a distinct approach,
utilizing various data types and machine learning
algorithms.
Our proposed system builds upon this prior
research by leveraging georeferenced biometric data
from wearable devices and smartphones, employing
a Gaussian SVM machine learning classifier for the
real-time detection and mapping of crowd panic
emergencies.
This represents a significant advancement, as it
utilizes precise data, offering a more accurate
assessment of stress levels and panic behavior
compared to traditional data sources like GPS or
video. Additionally, our system conducts real-time
spatial analysis to monitor the movement of stressed
individuals and generate dynamic areas, providing
emergency responders with accurate, up-to-date
information about the situation.
In essence, our research takes a comprehensive
and precise approach to the real-time detection and
mapping of crowd panic emergencies, enabling
emergency responders to make faster, more informed
decisions that mitigate risks and ensure public safety.
VISAPP 2024 - 19th International Conference on Computer Vision Theory and Applications
486

3 METHODOLOGY
3.1 Workflow Process
Our crowd panic detection system aims to extract
insights from collected biometric and spatiotemporal
data to identify panic patterns in crowds, as shown in
Figure 1. The process begins with a wearable device
monitoring biometric data, while an Android
smartphone collects GPS coordinates, time, activity,
speed, and step data. This information is compiled
into encrypted UDP packets and sent to a server over
the GSM network. The server decrypts and processes
the data to identify panic patterns, handling a
significant volume of real-time data.
3.2 Stress Profile Index (SPI)
Classification
The proposed method characterizes an individual as
calm or in a panic state using a classifier that takes
various biometric and geospatial data from wearable
devices as input, as described in (Lazarou, 2022). To
select the most suitable machine learning classifier,
several classifiers were assessed with a dataset
comprising of 27 subjects. This dataset includes
biometric information such as heart rate, heart rate
variability, spatiotemporal data including location
coordinates, activity type, subject speed, step count,
and descriptive data like gender, age, weight, and a
unique identification code for each subject.
The biometric and spatiotemporal attributes in the
dataset are categorized into four groups, with values
informed by relevant studies: i) biometric data from
wearables, including heart rate and heart rate
variability; ii) spatiotemporal data from smartphones,
which includes location coordinates, activity type,
subject velocity, and step count; iii) descriptive data
from wearables, encompassing subject gender, age,
and weight; and iv) the unique ID assigned to each
subject from smartphones. Additionally, a feature
called "heart rate moving average deviation"
(HRMAD) is introduced to detect sudden panic
conditions based on heart rate values.
Machine learning models are trained on this
dataset to differentiate between panic states and
normal behavior. Various classifiers, including
decision trees, logistic regression, Gaussian and
kernel naïve Bayes, Gaussian SVM, SVM kernel, and
boosted trees, were examined. The Gaussian SVM
classifier yielded the highest accuracy, especially
when using the HRMAD60 feature. Consequently,
the Stress Profile Index (SPI) is introduced as a binary
index, indicating a Calm state (value 0) or a Stressed
state (value 1) based on the classifier's output
(Lazarou, 2022)
3.3 Real-Time Analysis of Spatial
Patterns
The purpose of real-time spatial analysis in
monitoring panic conditions is supported by a data
model as in (Lazarou, 2023), represented in Figure 3.
This model processes streaming data containing
spatiotemporal and biometric information collected
from wearable devices and smartphones. As stated in
the previous section, a Gaussian SVM machine
learning classifier is utilized to distinguish between
normal behavior and panic conditions, assigning the
SPI values of 0 and 1, respectively. The resulting
categorization labels the data as either Points of No
Interest or Panic Points.
Real-time spatial analysis for panic monitoring
relies on a data model, as illustrated in Figure 3 and
detailed in (Lazarou, 2023). This model processes
streaming data, combining spatiotemporal and
biometric information from wearables and
smartphones. A Gaussian SVM classifier discerns
normal behavior from panic, assigning SPI values of
0 and 1, respectively. The data is categorized as
"Points of No Interest" (SPI 0), marking the end of a
sequence of "Panic Points" (SPI 1) representing
highly stressed profiles. If isolated Panic Points are
followed by a Point of No Interest, no further action
is taken. However, consecutive Panic Points form a
"Panic Trajectory" with an associated "Panic
Trajectory Origin."
A Panic Trajectory is a continuous sequence of
Panic Points linked to a subject, ending with one or
more Points of No Interest. The initiation of a Panic
Trajectory can depend on a single or multiple panic
points, with the required initiation and termination
points determined by the "Classifier Level of Trust"
(CLOT).
In Section 4, we delve into various start and end-
point scenarios for Panic Trajectories, exploring
variations where two or more Points of No Interest
are needed to conclude a Panic Trajectory. We also
examine scenarios requiring two or more Panic Points
for initiation. Once a Panic Trajectory begins, the first
point becomes the "Panic Trajectory Origin." We use
the DBSCAN algorithm to identify spatiotemporal
correlations among these origins. This algorithm
works within a 100-meter radius and a 10-second
timeframe, aiding our understanding of panic
behavior patterns.
Meeting specific conditions triggers the creation
of "Crowd Panic Areas," comprising the "Origin
Real-Time Detection and Mapping of Crowd Panic Emergencies
487
Crowd Panic Area" and the "Current Location Crowd
Panic Area." The Origin CPA traces the origin of
correlated Panic Trajectory starting points, while the
Current Lo-cation CPA relies on the most recent
points of ongoing correlated Panic Trajectories.
Additionally, the "Domino Effect Index,"
introduced later, assesses the severity of panic-
induced crowd behavior during emergencies.
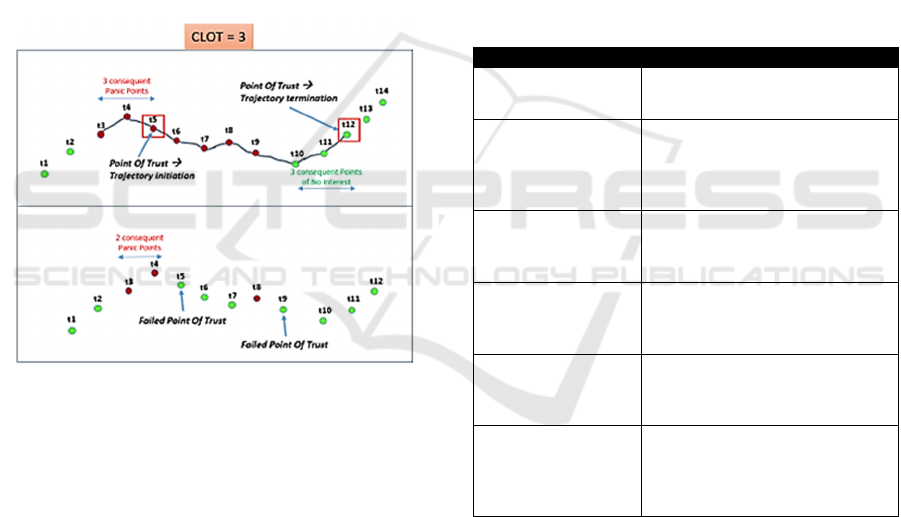
3.4 Classifier Level of Trust (CLOT)
CLOT, a numerical parameter from 0 to 10, indicates
the system's confidence in the classifier's output.
Lower CLOT values prioritize fast detection with less
noise reduction, while higher values filter out more
noise, reducing false positives but slowing detection.
In essence, adjusting CLOT balances detection
speed and noise filtering, enabling performance
testing under different settings and noise levels.
Figure 1: Example of CLOT = 3.
In Figure 1, two examples highlight the influence
of a CLOT value set at 3. On the top, a subject initially
exhibits calmness with two Points of No Interest.
Then, a sequence of Panic Points unfolds, triggering
the system to mark the third successive Panic Point as
the Point of Trust (POT), initiating a Panic
Trajectory. If the sequence continues uninterrupted,
the trajectory extends. Points of No Interest
eventually appear, and the system assesses if at least
three consecutive Points of No Interest are present to
end the Panic Trajectory. In the bottom example,
another subject remains composed, and the
subsequent Panic Points don't surpass the CLOT
threshold of 3. As a result, the system classifies them
as noise, leading to no trajectory formation.
3.5 Domino Effect Index (DEI)
The DEI assesses panic severity by considering
factors such as panic transmission rate, panicked
population density, new panic origins, convex hull
area change rates, and alignment with the road
network. It's rated from 0 to 5, with higher values
indicating more severe panic. This scale has five
levels, with DEI scale 1 being the lowest severity, and
DEI scale 5 indicating the highest severity. By
incorporating various factors contributing to the
domino effect, DEI offers a dependable evaluation of
crowd panic, aiding decision-makers in shaping
effective emergency response strategies.
Methodologically, DEI is determined by a
combination of weighted and normalized factors
influencing panic propagation, detailed in Table 2
below:
Table 1: DEI contributing factors.
Factor Description
Rate of panic
transmission (𝑓
)
The rate at which panic spreads
among the crowd
Number of new panic
origins within the
panic origin convex
hull (𝑓
)
The distribution of new panic
origins within the area where panic
first emerged
Density of panicked
people (𝑓
)
The concentration of panicked
individuals within the current
location convex hull
Area change rate of
the panic origin
convex hull (𝑓
)
The rate at which the area of the
panic origin convex hull changes
over time
Area change rate of
the current location
convex hull (𝑓
)
The rate at which the area of the
current location convex hull
changes over time
Number of aligned
clusters (𝑓
)
The count of panic clusters aligned
with the road network, which
might indicate the crowd's
tendency to use streets for escape
Each factor is normalized between 0 and 1, and
then multiplied by a weight that reflects its
importance in contributing to the domino effect. The
DEI is then calculated as the sum of these weighted
factors:
DEI =
∑
𝑤
𝑓
for i =1…6
where 𝑓
and 𝑤
denote the 𝑖 -th factor and the
corresponding weight, respectively.
To normalize the contributing factors for DEI,
each factor is scaled between 0 and 1, ensuring fair
comparisons and combining different numerical
values. This process involves three steps. First,
VISAPP 2024 - 19th International Conference on Computer Vision Theory and Applications
488
determining the factor's minimum and maximum
values to set its range. Second, scaling the current
factor value at a time step to a normalized value
within 0 to 1 by subtracting the minimum and
dividing by the range between the maximum and
minimum values.
normalized_value = (current_value - min_value) /
(max_value - min_value)
To compute DEI, normalization ensures that
various factors, regardless of their original scales, are
equitably assessed for their collective influence on the
domino effect's severity. Normalized values are then
weighted by user-defined weights and summed to
determine the final DEI value. This quantifies the
potential panic propagation extent in a crowd and aids
in intervention prioritization. The DEI value is
classified into five intervals (0-0.2, 0.2-0.4, 0.4-0.6,
0.6-0.8, 0.8-1), with each interval corresponding to
DEI scales from 1 to 5, as shown in Table 3.
Table 2: DEI scales.
DEI Scale DEI value
1 0-0.2
2 0.2-0.4
3 0.4-0.6
4 0.6-0.8
5 0.8-1
DBSCAN clustering is employed to identify
panicked individual clusters based on their alignment
with the road network. DBSCAN, a widely used
density-based clustering algorithm, identifies dense
regions in datasets. Each cluster is enclosed by a
minimum area bounding rectangle (MABR), and the
axis ratio is calculated. If the axis ratio is below a
certain threshold (e.g., 0.5), it is deemed an aligned
cluster. This information is valuable, suggesting that
panic transmission is more likely when a significant
portion of a panicked crowd flees through the streets.
The DEI metric and its scale are valuable for assessing
panic severity in real-world scenarios like evacuations,
natural disasters, or terrorist attacks. By quantifying the
domino effect and categorizing it into five severity
levels, emergency planners and responders can better
understand crowd behavior and develop more effective
response strategies to mitigate risks associated with
panic-induced crowd movements.
4 EXPERIMENTAL SETUP AND
RESULTS
We conducted a proof of concept in Syntagma
Square, Athens, testing three unique crowd panic
scenarios: ESCAPE, SHRINK, REPULSION. These
scenarios were designed to examine different crowd
panic behaviors and DEI dynamics.
In these scenarios, the crowd responds to aversive
events by dispersing (ESCAPE), contracting towards
the center (SHRINK), or reacting to repulsive forces
(REPULSION). Weight variations in each scenario
were applied to analyze the DEI factors' impact on
crowd behavior, contributing to a better
understanding of panic propagation.
Regarding the ESCAPE scenario that will be
presented in this paper, approximately 30 individuals
from diverse backgrounds gather in a controlled
environment, initially in a calm state, engaging in
various activities. At a predetermined moment, an
unpleasant event is deliberately introduced, causing a
sudden onset of stress and panic among some
participants. This event triggers physiological
symptoms like increased heart rate and rapid
breathing. As panic spreads, individuals' emotions
influence each other, resulting in a chain reaction of
stress and anxiety. This phenomenon is known as
emotional contagion, where emotions transfer
between people through nonverbal cues and social
interactions. Those initially calm also become
stressed as they observe the panic. As the situation
unfolds, panic continues to propagate, with
individuals instinctively seeking escape in various
directions. This amplifies the scale and magnitude of
the event.
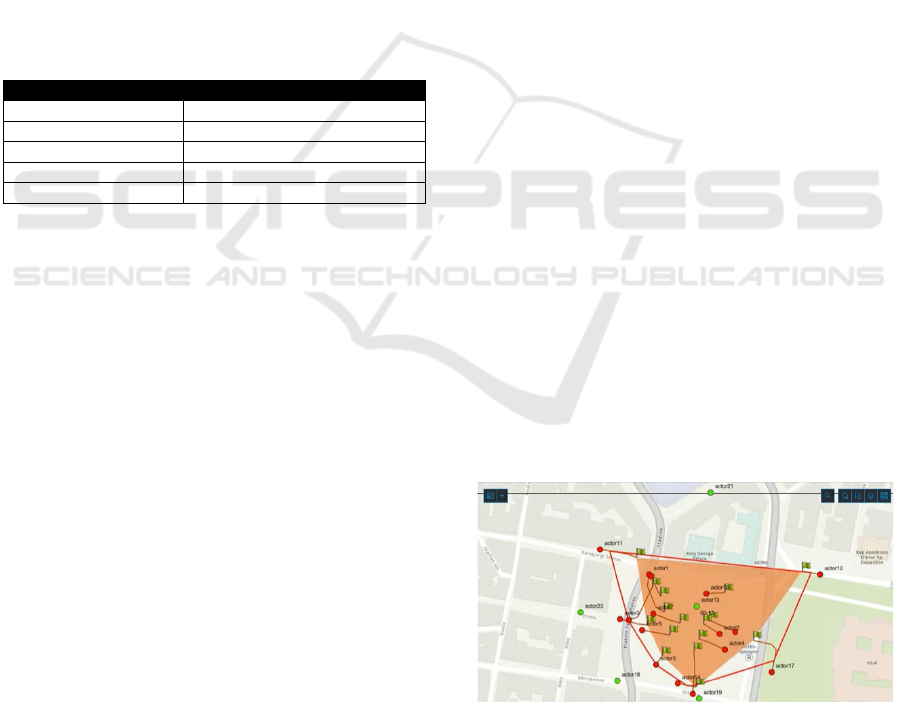
In Figures 2, 3, and 4, the maps illustrate the
progression of the phenomenon over time. Panic
points are depicted as red dots, calm points as green
dots, and recovered points as blue dots. Panic
trajectories are represented by red lines, while the
origins of these trajectories are marked by green flags.
The shaded orange region denotes the Origin CPA
(Common Panic Area), and the hollow red region
indicates the Current Location CPA.
Figure 2: Initial expansion.
Real-Time Detection and Mapping of Crowd Panic Emergencies
489
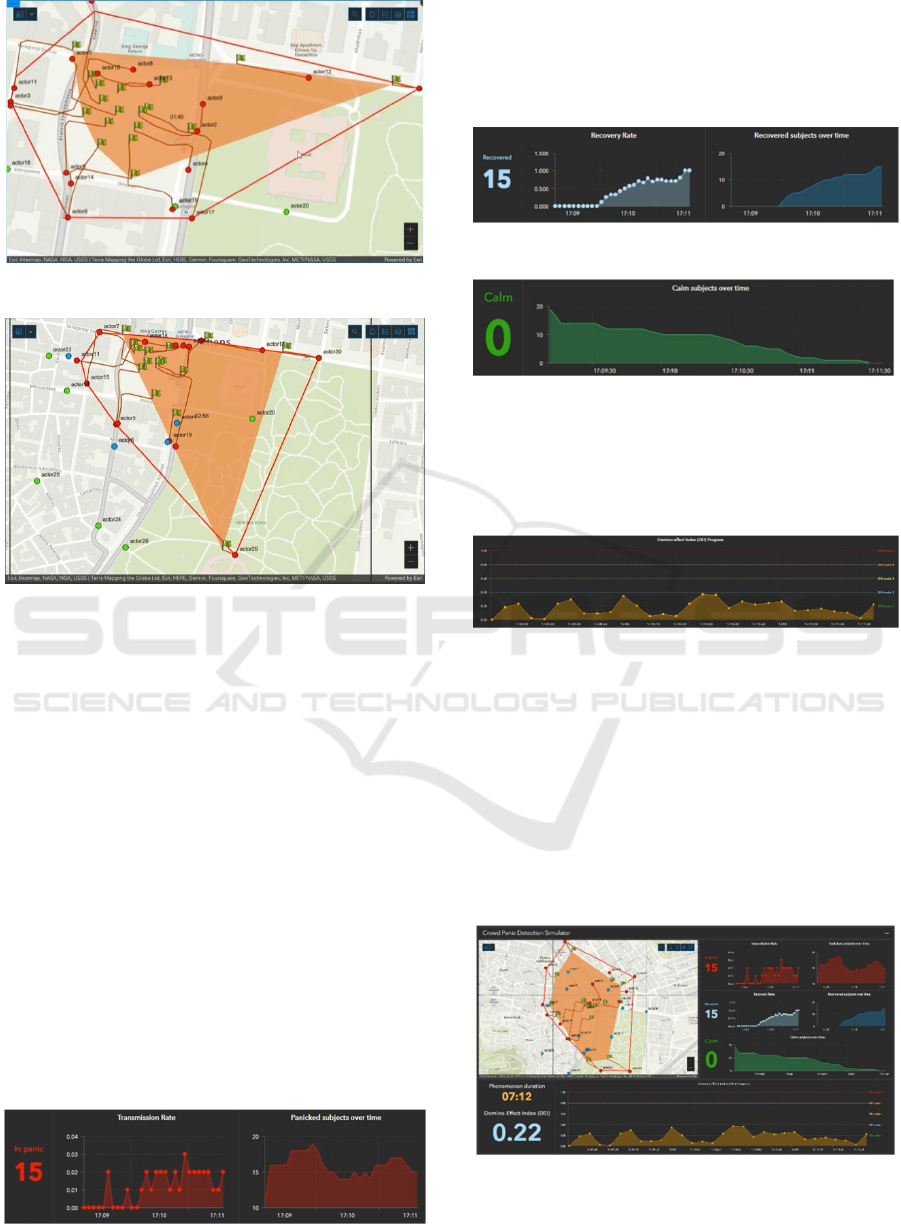
Figure 3: Panic starts to spread widely.
Figure 4: After some time it still expands but some subjects
tend to recover (blue dots).
Figures 5, 6, 7, and 8, depict real-time counts of
individuals categorized as stressed, calm, and
recovered. These visualizations facilitate the effective
monitoring of emotional distribution within the
group. Real-time charts graphically represent
emotional trends for each category, helping identify
influencing factors and individual transitions between
emotional states.
Furthermore, the Panic Transmission and
Recovery Rate Charts offer insights into the speed of
panic propagation and recovery rate, providing
valuable information about the effectiveness of
interventions and the overall resilience of the group.
Additionally, the DEI Current Value offers real-time
insights into the collective emotional state, reflecting
stress and anxiety levels. The DEI Progress Diagram
tracks the evolution of the emotional state over time,
providing valuable information about its progression
throughout the scenario.
Figure 5: Transmission rate and panicked population.
The count of recovered individuals demonstrates
a progressive increase after a certain period, as
evidenced by the recovery rate. Simultaneously, the
number of calm individuals exhibits a noticeable
decline, gradually approaching zero.
Figure 6: Recovery rate and recovered population.
Figure 7: Calm population.
Ultimately, the comprehensive evaluation of the
DEI reveals that, in this particular scenario, the
phenomenon only marginally surpasses the threshold
of 0.40, resulting in a DEI scale of 2.
Figure 8: Evolution of DEI.
In Figure 9, it is evident that the population of
panicked individuals exhibits considerable
fluctuations over time, indicating the arbitrary nature
of the phenomenon's expansion and its variable
impact on different individuals. During the initial
minutes, the transmission rate remains predominantly
low, as the panic has yet to propagate to a wider
population. However, in subsequent stages, the
transmission rate reaches higher values, signifying
the widespread dissemination of panic.
Figure 9: Final state where the event has spread
significantly, and multiple subjects are now in the recovery
phase.
VISAPP 2024 - 19th International Conference on Computer Vision Theory and Applications
490

5 CONCLUSIONS AND FUTURE
WORK
In our experiments, we closely monitored participants
to understand panic behavior in groups. We used a
digital map to visualize how panic evolves,
identifying clusters of stressed individuals and
support networks. The Domino Effect Index (DEI) is
a vital tool for assessing emergency severity. It
considers panic speed, density, and road alignment.
The Classifier Level of Trust (CLOT) balances noise
filtering and quick detection. Our research can shape
interventions for managing panic in real-life
situations, reducing negative consequences. In
conclusion, our real-time spatial analysis, using
wearables and smartphones, advances crowd panic
monitoring. serves as a valuable index for prioritizing
interventions in scenarios characterized by
concurrent multiple events. Empirical validation of
this approach has been substantiated through rigorous
experimental investigations. Future work will delve
into bio-algorithms and mathematical models to
better understand panic spread, refining our approach
in crowd safety and security.
REFERENCES
Hao, Y.; Xu, Z.; Wang, J.; Liu, Y.; Fan, J. An Approach to
Detect Crowd Panic Behavior using Flow-based
Feature. In Proceedings of the 22nd International
Conference on Automation and Computing, Colchester,
UK, 7–8 September 2016; ISBN 9781862181328.
https://doi.org/10.1109/iconac.2016.7604963.
Lazarou, I.; Kesidis, A. L.; Hloupis, G.; Tsatsaris, A. Panic
Detection Using Machine Learning and Real-Time
Biometric and Spatiotemporal Data. ISPRS Int. J. Geo-
Inf. 2022, 11(11), 552.
Lazarou, I.; Kesidis, A.; Tsatsaris, A. Real-Time
Monitoring of Crowd Panic Based on Biometric and
Spatiotemporal Data. In Proceedings of the 18th
International Joint Conference on Computer Vision,
Imaging and Computer Graphics Theory and
Applications - Volume 5: VISAPP, SciTePress, 2023;
pp. 1021-1027. DOI: 10.5220/0011789900003417
Ammar, H.; Cherif, A. DeepROD: A deep learning
approach for real-time and online detection of a panic
behavior in human crowds. Mach. Vis. Appl. 2021, 32,
57. https://doi.org/10.1007/s00138-021-01182-w.
Tsai, C. H.; Chen, P. C.; Liu, D. S.; Kuo, Y. Y.; Hsieh, T.
T.; Chiang, D. L.; ... & Wu, C. T. Panic Attack
Prediction Using Wearable Devices and Machine
Learning: Development and Cohort Study. JMIR Med.
Inform. 2022, 10(2), e33063.
Kutsarova, V.; Matskin, M. Combining Mobile
Crowdsensing and Wearable Devices for Managing
Alarming Situations. In 2021 IEEE 45th Annual
Computers, Software, and Applications Conference
(COMPSAC), pp. 538-543. IEEE, 2021.
Alsalat, G. Y.; El-Ramly, M.; Fahmy, A. A.; Karim, S.
Detection of Mass Panic using Internet of Things and
Machine Learning. Int. J. Adv. Comput. Sci. Appl.
2018, 9(5).
Sun, H.; Hu, L.; Shou, W.; Wang, J. Self-Organized Crowd
Dynamics: Research on Earthquake Emergency
Response Patterns of Drill-Trained Individuals Based
on GIS and Multi-Agent Systems Methodology.
Sensors 2021, 21, no. 4: 1353. https://doi.org/
10.3390/s21041353
Zhang, X.; Sun, Y.; Li, Q.; Li, X.; Shi, X. Crowd Density
Estimation and Mapping Method Based on
Surveillance Video and GIS. ISPRS Int. J. Geo-Inf.
2023, 12, no. 2: 56. https://doi.org/10.3390/
ijgi12020056
Albarakt, R.; Selim, G.; Iaaly, A. Reshaping Riyadh Alsolh
Square: Mapping the Narratives of Protesting Crowds
in Beirut. Urban Reg. Plan. 2021, 6, no. 4, 126-133. doi:
10.11648/j.urp.20210604.13.
Real-Time Detection and Mapping of Crowd Panic Emergencies
491
