
Multi-Dimensional Process Analysis of Software Development Projects
Thanh Nguyen
1
, Saimir Bala
1 a
and Jan Mendling
1, 2 b
1
Humboldt Universit
¨
at zu Berlin, Department of Computer Science, Unter den Linden 6, 10099 Berlin, Germany
2
Weizenbaum Institute, Research Group: Security and Transparency in Processes, Hardenbergstraße 32, 10623 Berlin,
Germany
{firstname.lastname}@hu-berlin.de
Keywords:
Software Development Analysis, Process Analysis, Software Engineering, Business Process Management.
Abstract:
Software processes are complex as they involve multiple actors and data which interplay with one another
over time. Process science is the discipline that studies processes. Works in this area are already using
multi-dimensional analyses approaches to provide new insights in business processes that go beyond the
discovery of control flow via process mining. In this paper, we investigate the applicability of multi-dimensional
process analysis. More specifically, we extract data from GitHub open-source repositories that was generated
during software development, and evaluate diverse software development metrics. Our results help to explain
performance issues by revealing multiple contributing factors, such a side-work, that hinder the progress
completing a development task. With this work, we pave the way for multi-dimensional process analysis on
software development data.
1 INTRODUCTION
Software development is a complex process that gener-
ates vast amounts of data. The increasing volume and
complexity of data produced during software develop-
ment has led to the need for innovative techniques to
extract meaningful insights. Multi-dimensional pro-
cess analysis (Fahland, 2022) is a new paradigm for
analyzing and extracting insights from business pro-
cesses. This approach shifts the focus away from the
notion of cases in a process. Instead, it takes into
account all the relations between all actors in the pro-
cess that are found in trace data. By looking into their
relations, it is possible to understand and explain vari-
ous issues that occur as a consequence of the actors’
interplay.
The many dimensions of software development can
be seen by developers in a software development pro-
cess as layers that provide information about the data
as a whole such as: entities, actors, events, time, social
networks, workload, etc. Analyzing and understand-
ing these dimensions of data is crucial for improving
the quality and efficiency of software development.
However, the vast amounts of data generated during
software development make it challenging to extract
meaningful insights manually. Hence, the need for
a
https://orcid.org/0000-0001-7179-1901
b
https://orcid.org/0000-0002-7260-524X
new automated techniques to analyze and extract in-
sights from software development datasets has arisen.
As software development needs analysis techniques
to help the managers understand how various issues
manifest, multi-dimensional process analysis presents
a unique opportunity for new ways of investigation.
In this work, we adapt multi-dimensional process
analysis techniques to software development. We
apply the method to construct an a so-called event-
knowledge graph. On top of that, we provide various
insights into patterns and compute Key Performance
Indicators (KPIs). We applied our approach to real-
world repositories and gained insights that are infor-
mative to managers. As such, we provide information
about issue resolution times, identifying bottlenecks,
developers focus shift, code complexity, recurring is-
sues, file/commit dependency analysis and issue es-
calation analysis. With these we underscore potential
areas that require increased management attention.
The remainder of the paper is structured as follows.
Section 2 describes the setting of software develop-
ment and formulates our research questions. Section 3
outlines our method to apply multi-dimensional pro-
cess analysis to software data. Section 4 presents vari-
ous metrics computed on top of a GitHub repository.
Section 5 discusses the results against our research
questions. Section 6 concludes the paper.
Nguyen, T., Bala, S. and Mendling, J.
Multi-Dimensional Process Analysis of Software Development Projects.
DOI: 10.5220/0012372100003645
Paper published under CC license (CC BY-NC-ND 4.0)
In Proceedings of the 12th International Conference on Model-Based Software and Systems Engineering (MODELSWARD 2024), pages 179-186
ISBN: 978-989-758-682-8; ISSN: 2184-4348
Proceedings Copyright © 2024 by SCITEPRESS – Science and Technology Publications, Lda.
179

2 BACKGROUND
2.1 Related Work
This paper focuses on the use of data for quantitative
analysis. In this realm, we distinguish two streams of
works: i) data mining works; and ii) process analysis.
In the data-mining related-works stream fall those
works which use data mining techniques to compute
quantitative analysis (e.g., KPIs) about the software.
In this context, the focus is to learn how users relate to
the artifacts in the repositories (Oliva et al., 2011), or at
analyzing the evolution of changes over time (Zimmer-
mann et al., 2005). To achieve that, these techniques
are based on identifying and process events (Zimmer-
mann and Weißgerber, 2004) from the software reposi-
tory data and abstracting them onto higher-level activi-
ties (Oliva et al., 2011). The goal is to measure aspects
of software such as the type of work (i.e., what kind of
files are being worked on) (Vasilescu et al., 2014), the
type of resources (Agrawal et al., 2016) or measure
KPIs (Rastogi et al., 2013). All these works provide
valuable insights into the software development efforts
done in the project, but focus on low-level indicators
or relations.
The second stream includes process analysis re-
lated works. Works in this area aim at understand-
ing how things in software development unfold over
time. For that they take into account various ele-
ments (Vavpotic et al., 2022) of the software devel-
opment. There are approaches to transform software
development data in process-mining compatible event-
logs (Kindler et al., 2006; Poncin et al., 2011). There
are also approaches that enable process analytics of
fine-grained events from evolving artifacts (Beheshti
et al., 2013). More complex approaches use repository
data to analyse well-known processes. The work from
(Marques et al., 2018) uses process mining (van der
Aalst, 2016) to analyze bug resolution processes, while
(Bala et al., 2015; Bala et al., 2017; Jooken et al.,
2019) use version data to analyse commits, and gather
insights respectively about the project timeline, hidden
dependencies and de-facto teams.
Most of the techniques in the process mining
stream require the input data to have well-defined at-
tributes (i.e., an event log with defined case, activity,
and timestamp). These works cannot be readily ap-
plied to data from software development (Tsoury et al.,
2018). As well, they only focus on discovering and
analyzing predefined relations, by fixing the notion of
case and following its traces in the data. However, the
notions of case and activity of a process, especially
in software data, are in practice loosely defined (Bala
et al., 2018).
2.2 Multi-Dimensional Process Analysis
In recent years, process mining approaches are mov-
ing toward multi-dimensional analysis. Indeed, con-
cepts like object-centric process mining (van der Aalst,
2019) and standards like OCEL (Ghahfarokhi et al.,
2021) are increasingly gaining interest. Thus, the ten-
dency is to use as much information as possible. One
way to holistically capture the information contained
in the event logs is through the use of so-called event
knowledge graphs (Khayatbashi et al., 2023) and store
them in graph databases (Esser and Fahland, 2021).
Multi-dimensional process analysis serves to
deepen our understanding of the software development
process by amalgamating data from various sources.
These sources may encompass software development
tools such as compilers and debuggers, version control
systems like Git, bug trackers like Jira, and code repos-
itories like GitHub. By synergistically analyzing the
data from these diverse sources, we can unravel pat-
terns, trends, and anomalies that might be unnoticeable
when each source is scrutinized in isolation.
Software development is characterized by the ex-
ecution of the software process (e.g., one or more
sprints) and the production of multiple entities. For
example, in one git commit there may be informa-
tion regarding different entities involved in a singular
execution context, such as a specific software devel-
opment task, commit, which developer is responsible
for what or bug fix issue, all contributing towards the
ultimate goal of multi-dimensional process analysis.
To analyze the inter-dependencies among the var-
ious elements involved in the software development
process, we rely on the notion of event graph. This pro-
vides the basis for visualizing and interpreting the con-
nections between entities, events, and their attributes.
Therefore, systems like graph-databases provide the
starting point for building multi-dimensional process
mining on data extracted from software repositories.
2.3 Research Question
In the light of the challenges faced by traditional
approaches and the opportunities arising by multi-
dimensional process analysis, we derive the following
research question. RQ: How can we exploit multi-
dimensional process analysis to analyze software de-
velopment traces in a repository?
In the following, we describe the development of
an artifact (i.e., an approach) – following a Design Sci-
ence Research (Wieringa, 2014) methodology – that
serves the purpose of applying a process mining solu-
tion to a new domain (i.e., software development).
MODELSWARD 2024 - 12th International Conference on Model-Based Software and Systems Engineering
180

3 APPROACH
We devise a four-steps approach. These steps con-
sist in pre-processing the repository data to extract
event, building a knowledge-graph from these events,
analysing them via multiple queries, and presenting
the results to the end user. Next, we present the goals
of our approach following the Goal-Question-Metric
(GQM) paradigm from (Basili et al., 1994). Then, we
describe each step of our approach.
3.1 Goals and Metrics
We define the following three main goals and related
questions.
•
GQ1. Goal 1: analyze the development of indi-
vidual modules, especially those showing signs
of delay, to identify potentially problematic areas.
For instance, if
developerA
discontinues work on
moduleA
, understanding the reasons behind such
disruptions is crucial to address underlying work-
flow or project management issues and provide
timely solutions. Question 1: What are the reasons
behind discontinued work?
•
GQ2. Goal 2: comprehend the impacts of shift-
ing developer attention or “side-tracking”, thus
addressing and mitigating impacts on overall pro-
ductivity. Question 2: How to trace task transitions
and discern whether such shifts arise from urgent
issues or mismanaged priorities?
•
GQ3. Goal 3: inform long-term planning and re-
source allocation, especially for specialized knowl-
edge areas. Question 3: How to investigate code
complexity and recurrent issues in files that neces-
sitate frequent developer attention?
The following five metrics are identified to gauge
progress towards our goals-questions. As metrics can
be used to address more than one question, we provide
a their description separately and map them to the rel-
ative goal-question (GQ). Module/Task Progress (Paa-
sivaara and Lassenius, 2003) measures the comple-
tion rate of tasks or modules, focusing on indicators
like “task completion time” (GQ1). Developer Activ-
ity (Shin et al., 2011) assesses a developer’s activity
on a project by evaluating the number and frequency
of commits (GQ1). Code Churn (Shin et al., 2011)
examines the amount of code rewritten or revised, in-
dicating issues with code complexity or quality (GQ1,
GQ3). Issue Tracking (Meneely et al., 2010) metrics
(e.g.,“Number of Open Issues”) signal potential prob-
lems within the software (GQ1, GQ3). Task Switch-
ing (Benbunan-Fich et al., 2011) records instances of
developers switching tasks, aiding in identifying its
frequency and impact (GQ1, GQ2, GQ3).
3.2 Data Preprocessing
We focused on feature selection from the GitHub API
to shape our event knowledge graph, choosing parame-
ters that reflect various dimensions of the development
process. Thus, we fetch the datasets from the software
repository (e.g., GitHub) and select the most relevant
dimensions for our purpose. We include commit data,
issue event data, pull requests and branch data.
When extracting commit data we include fields
like SHA, committer, author’s name, commit message,
verification status, commit parents, merge status, URL,
stats, files involved, author-login, repos, URL, organi-
zations URL, and branch name. These parameters are
chosen to visualize the essence, trajectory, and work-
flow of the software development process based on file
modifications over time after each commit.
When extracting issue event data, we include data
about both open and closed issues from the chosen
repository, and their correlated events. We fetch infor-
mation about the issue, event type, commit-id, event-
creator, state, and a timestamp indicating whether the
issue was closed and when.
When extracting the data of pull requests we in-
clude the pull-request number, title, state (closed, open
or all), user who made the PR, creation time of the
PR, merge time (if merged), and the merge commit’s
SHA code. With these parameters, we can get a better
understanding of what transpires when a developer
decides to merge a pull request from one branch into
another and how commits are being handled for both
the merging branches. We can also compare the data
of two states: what data are being generated when
users open a pull request versus what data are being
recorded after it gets closed.
Finally, when extracting the branch data, we in-
clude the branch name for the purpose of better navi-
gation the data from commits and subsequently from
pull requests. To fetch the data in a systematic manner,
we wrote a Python script and used it together with the
requests library. These data served as the foundation
for our event knowledge graph and were critical in re-
flecting the intertwined relationships among different
software development events and activities.
3.3
Building an Event Knowledge Graph
In the following, we describe the steps to convert the
acquired data from the repository into the event knowl-
edge graph. In order to do so, we rely on Neo4j
1
graph
1
https://neo4j.com
Multi-Dimensional Process Analysis of Software Development Projects
181

database and its Cypher query language.
3.3.1 Creating Nodes
The first phase consists of loading event data extracted
from the repository during the pre-processing step and
stored into CSV files. That is, for each of the four
datasets commit data, issue event data, pull requests
and branch data, we have a corresponding .csv file.
With these we create the primary nodes of the knowl-
edge graph. Each type of node represents a unique
entity in the software development process.
We used a Cypher query
2
to create entities from
the commits dataset (i.e.,
commit.csv
file). From this
dataset we can create the following nodes:
Commit
,
Author
, and
File
. Each
Commit
node is associated
with an
Author
node representing the individual who
made the commit and several
File
nodes represent-
ing the files that were altered in the commit. The
Commit
nodes include properties such as
commit id
,
message
,
URL
,
stats
,
date
, and
merge
, which pro-
vide detailed information about each commit while
Author
nodes contain information or each individual.
Nodes for
File
help to show the state of each file after
a modification has been done by a commit.
Queries for creating entities from the issue, events
and pull requests nodes are similar. For commits
we create
Author
nodes and for issue events we cre-
ate
Users
nodes to distinguish the different type of
GitHub’s users.
Author
are the GitHub users or de-
velopers that are actively involve in the process of the
development process.
Users
are the people from the
open community that contributed to the issue through
activities such as comment or reference.
3.3.2 Creating Relationships
Next we describe how we create the relationships.
Branches, Authors, Files and Commits. In this
step, relationships
:COMMITTED
(between an
Author
and a
Commit
) and
:BELONGS TO
(between a
Commit
and a
Branch
) are formed and each commit is linked
to the files (
File
) it modifies through the
:MODIFIES
relationship. These are established by connecting the
Author
node who
:COMMITTED
to the
Commit
node
and linking each
Commit
to the
Branch
node it belongs
to. This will relatively show which commit belongs to
which branch and eventually who worked on a specific
branch or file.
2
All the queries can be found in our GitHub reposi-
tory https://anonymous.4open.science/r/Multi-Dimensional-
Process-Analysis-on-Software-Data-F33F/
Directly Follows Relation for Commits. This re-
lationship, represented as
:DF
, connects two commit
nodes that directly follow one another in time, regard-
less of the branch they belong to. This is similar to the
commit history displayed on GitHub but not limited to
a specific branch. The
:DF
relationship makes it pos-
sible to trace the chronological sequence of commits
across all branches.
Directly Follows Relation of Commits-Modification.
This relationship, symbolized as
:DF M
, connects two
commit nodes that directly follow each other only if
they have modified the same file. Like
:DF
, this rela-
tionship also tracks the sequence of commits, but it
narrows down the scope to those modifying the same
file. This allows a detailed view of how individual files
evolve over time. It also helps at detecting patterns to
highlight developers who stop working on the file.
The relationships
:DF
and
:DF M
enrich the struc-
ture of the event knowledge graph by adding a
time dimension. Queries for creating
Issue
,
Event
and
PullRequest
relationships can be found in our
GitHub repository.
3.4 Performing the Analysis
We leverage graph databases to extract the following
Key Performance Indicators (KPIs).
3.4.1 Basic Key Performance Indicators
Code Churn Analysis. Code churn (Munson and
Elbaum, 1998) is the measure of lines of code added
and removed from a file over time. The code churn
can be calculated using the formula
Code Churn =
Lines Added+ Lines Deleted
. We compute this for all
the developers. This also allows to rank the developers
by contribution (e.g., by sorting the respective churn
value in decreasing order).
Ratio of Closed and Open Issues. This metric pro-
vides insight into the project’s issue management ef-
ficiency and effectiveness (Meneely et al., 2010). As-
sesses the project’s issue management efficiency and
effectiveness and indicates well-managed projects and
areas for improvement in the development process.
We compute this metric as
Ratio (State) =
Issues (State)
Total Issues
, where the input parameter
State
can take
the values
Open
or
Close
to indicate respectively
opened or closed issues.
Cycle Time. This is a performance-related software
development metric, representing the time taken to im-
plement, test, and correct a piece of work from the mo-
MODELSWARD 2024 - 12th International Conference on Model-Based Software and Systems Engineering
182

ment work begins until it’s ready for delivery (Agrawal
and Chari, 2007). It measures the time taken from be-
ginning work to delivery, providing a more granular
view of the development process.
The cycle time in software development can
be calculated using the formula
Cycle Time =
Completion Date − Start Date
. We do this for all the
issues. We are also able to compute the cycle time of
each user that has worked on a given issue. With this,
we allow for identifying patterns or anomalies in cycle
times associated with specific users, providing a more
granular view of the development process.
3.4.2 KPIs for Process Analysis
Next, we provide some metrics for process analysis.
We focus on, i) issue resolution time, ii) collaboration,
iii) file/commit dependency, and iv) issue escalation.
Issue Resolution Time Analysis. With this metric
we analyze how long it takes to resolve different types
of issues. Specifically, we look into two aspects: the
individual issues that take the longest to resolve, and
the users who, on average, take longer to complete
issues. Utilizing a Cypher query we can perform the
analysis by extracting information of issues or users
with the longest cycle time with simple queries. More
specifically, this is computed as the cycle time of each
user that is associated to an issue. That is, it computes
the amount of time elapsed between the first and last
events of that user on the issue.
Collaboration Analysis. Analyzing collaboration
(Biazzini and Baudry, 2014) between team members
reveals patterns in how team members interact on is-
sues and files. For example, we can identify which
team members often work on the same issues or files.
We compute this as two KPIs regarding respec-
tively the issues and the files that were collaboratively
worked on. We consider all the collaborative events
from two users
u1
,
u2
that were recorded within the
same issue. We apply the same logic for what concerns
the commonly modified files. We return the number of
shared issues as the collaboration value. Same holds
for the shared files.
File/Commit Dependency Analysis. This metric
helps to identify relationships between different parts
of the codebase (Bala et al., 2017). For instance, it
makes it possible to identify files that are frequently
modified together, revealing areas of the codebase that
are tightly coupled and may benefit from refactoring
to improve modularity. We compute this KPI by con-
sidering the set of shared commits among the various
files. Files that appear together in more commits have
a higher dependency with one another.
Issue Escalation Analysis. Analyzing issue escala-
tion (Keil, 1995) helps to identify patterns in issue
evolution over time. We identify issues that undergo a
larger number of events and consider them potentially
problematic as they may require more management
attention. To do so, we navigate the event knowledge
graph and collect all the issues along with their related
events, sorted in decreasing order.
3.4.3 Extracting a Process Model
To extract a process model we use the computed
:DF
(directly-follows) relationships from between event
nodes correlated to the same entity node. We re-
peat this for all the processes or dimension we want
to investigate. Then, we classify the event nodes
to event classes and retrieve a multi-entity directly-
follows graphs (DFGs) through aggregation. Ulti-
mately, through this approach we can obtain a process
model that represents multi-entity DFGs.
We applied the techniques from (Esser and Fahland,
2021; Fahland, 2022). Hence, we could aggregate
the graph nodes to class nodes. Then we constructed
filtered directly-follows relationships and retrieved a
proclet model (van der Aalst et al., 2001) that provides
one distinct behavioral model per entity. We aggregate
the event class nodes for branch and commits nodes,
after analyzing the resulting graph.
Next, we raise the level of abstraction. We adapt
the query for DFG discovery to aggregate
:DF
relation-
ships between classes. To obtain the proclet model, we
proceed by adding synchronized edges between event
classes of the same activity in different entity types.
Finally, we simplify the resulting proclet model
by raising again the level of abstraction. We create a
higher-level class node for branch (that could be con-
sidered as an ‘Activity’ in a process) corresponding to
how the event nodes and class nodes were constructed.
This concludes the steps required to perform the
analysis of the software development process. The
evaluation of the results can then be carried out by a
domain expert (e.g., a manager or a senior software
developer) who can then use the extracted KPIs and
models to gather insights into the status of the project.
4 RESULTS
We tested our approach on the GitHub repository of
Microsoft Visual Studio Code
3
(vscode).
3
https://github.com/microsoft/vscode
Multi-Dimensional Process Analysis of Software Development Projects
183

Table 1: Top 10 Users with the Longest Average Cycle
Times.
User Hours Minutes
aeschli 23 44
bhavyaus 23 11
Danielmelody 23 11
weinand 23 11
dtroberts 18 56
christian-bromann 18 44
JacksonKearl 18 34
jzyrobert 18 34
joelday 18 34
AmitPr 18 34
KPIs and Process Analysis Queries. Table 1 re-
ports the values of the issue resolution time analysis
KPI in the
vscode
repository. On top, it is we can
observe the user who spent more time on average on
resolving issues. All the Cypher queries and analyses
to achieve these results can be found in our GitHub
repository.
Process Model. We derived a process model after
filtering the entire database to focus on the progres-
sion of a specific file over time. For the purpose of
demonstration we picked the file
quickInput.ts
. Us-
ing a Cypher query, we connect, label by category and
display the events that happened on the file on the dif-
ferent dimensions. The resulting model can be seen in
Figure 1a.
In this model, we used branches to represent 6
process activities, focusing mainly on the progres-
sion of
File
nodes, the associated
Commits
and their
Authors
. Additionally,
Issue
nodes are also involved
in the process where they got raised to signify that a
file needed to be worked on and areas that need atten-
tion. Here we could also see the cycle time of each
resolved issue as well as the users that were involved
in helping to solve the issue.
In Figure 1a we can also observe that in Activity
T3 and T4, there are some commits that belong to dif-
ferent branches, a deeper investigation revealed these
as revert commits from T4, occurring post-merge of
the T3 working branch into the main branch, signaling
an issue necessitating further work on the file. The au-
thor that was responsible for this action is highlighted
in the Figure, and we can observe that he continued
to work on the process in the next Activity T5 as well
before pausing for a significant time period until there
was an issue that require the process to be merged
into the main branch. In Activity t6 we can also see
that there were another few direct changes by 2 other
authors before finishing the workflow for this file.
Further insights were sought on why the author
from T4 and T5 paused before merging their work into
Table 2: Total churn of developer TJL in a certain time
period. File path prefixes are left out.
File
Total Churn
(lines)
Most
Churning
Dev
.../mainThreadAuthentication.ts 105 TJL
.../authenticationService.ts 105 TJL
.../vscode.d.ts 105 TJL
.../extHostAuthentication.ts 105 TJL
.../authentication.ts 105 TJL
.../vscode.proposed.getSessions.d.ts 105 TJL
.../extHost.protocol.ts 105 TJL
.../githubServer.ts 44 TJL
.../github.ts 44 TJL
.../quickInput.ts 10 TJL
the main branch. By filtering the workflow for this
specific author during that timeframe, we can delve
into the cause of this “sidetracking” and visualize their
work progression during this period.
Figure 1b reveals the author worked on another
branch during the hiatus. The graph depicts the states
of the file in question (yellow nodes) and the other files
the author worked on during that period (brown nodes).
The multi-dimensional process analysis enabled us to
identify the sidetracking issue and explain it by the
help of another dimension with one simple query.
After utilizing the metric code churn, and filtering
the time and the name of the author in question, we
obtained a comprehensive list of what the author was
working on or “side-tracking” during that time period
in a relational form of data. This is shown is Table 2.
The relational database results can be exported
in formats like .csv or .json. This allows for subse-
quent data loading into tools such as Python Library or
NumPy, facilitating further analyses and visualizations
by creating charts or statistics.
5 DISCUSSION
The work presented in this paper is driven by
the research question: How can we exploit multi-
dimensional process analysis to analyze software de-
velopment traces in a repository?. To answer this
question we used multi-dimensional process mining.
We found that multidimensional process mining is
applicable and useful to analyze software repositories.
This is inline with previous work from (Poncin et al.,
2011) who applied traditional process mining. This
work overcomes issues of applying traditional process
mining such the project-orientation of development
processes (Bala et al., 2015) and the non existence of
clear case and activities (Bala et al., 2018).
Key findings of this paper are that i) multi-
MODELSWARD 2024 - 12th International Conference on Model-Based Software and Systems Engineering
184
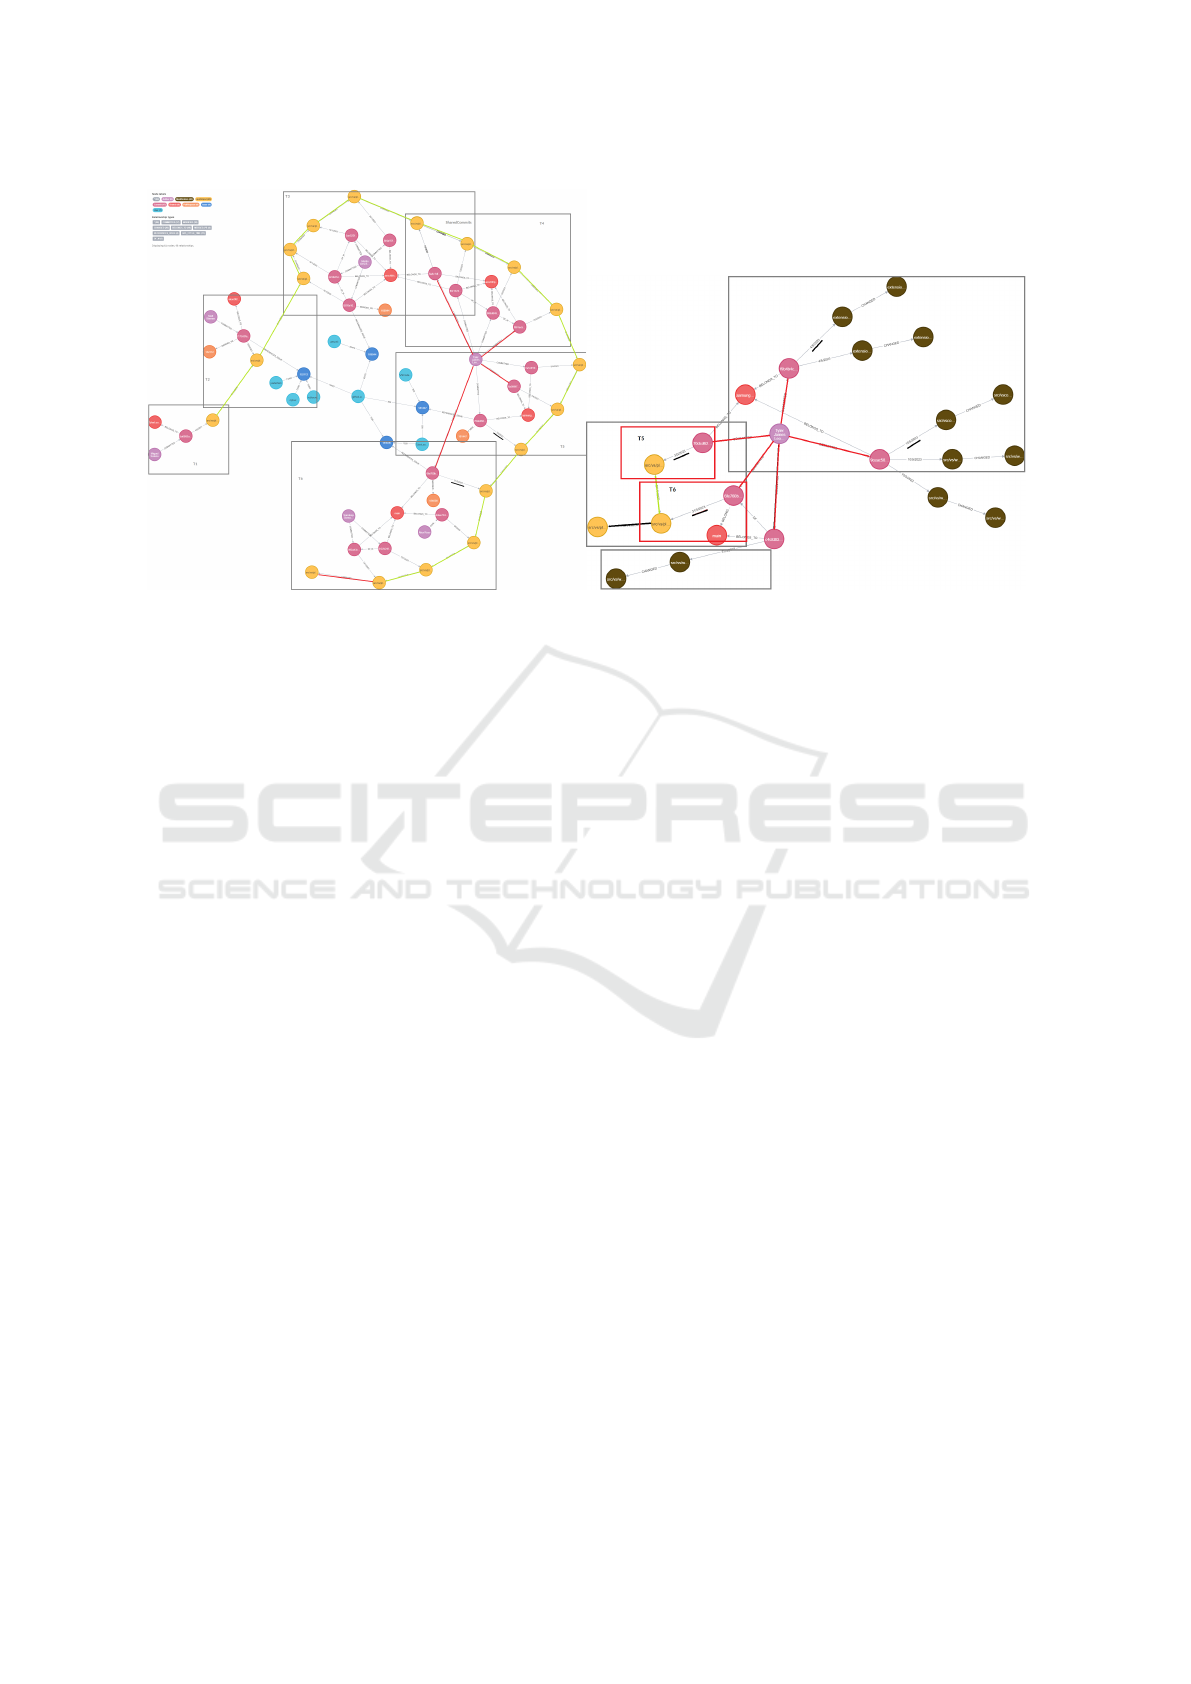
(a) The process of developing file quickInput.ts. (b) Author side-tracking problem.
Figure 1: The process of developing file quickInput.ts.
dimensional process mining is suitable for analysing
software repository data; and ii) it is possible to ob-
tain a comprehensive view of the overall process that
happens behind software development. The first point
(i) is shown by the queries presented in the first part
Section 3. Another evidence of the suitability of this
approach for software development analysis is the
fact that various KPIs can be reproduced by means
of Cypher queries. The second point is evident by the
analysis of Figure 1a. In this picture, it is possible
to observe not only the sequence of commit activi-
ties performed by one user to a file, but also other
activities that influenced the user behavior. This, for
instance, enables the explanation of why certain files
took longer to be developed. In this case, we see that
the reasons are that more developers were involved
(purple nodes) and that some developers also worked
on other files before continuing to contribute on the
file quickInput.ts.
Compared to previous studies that focus on extract-
ing a process workflow from their repositories, we
argue that this study is a first attempt on gathering a
multi-perspective view. Well-known approaches such
as (Kindler et al., 2006; Poncin et al., 2011) only tackle
one dimension (i.e., they force the notion of a process
case). Existing process mining approaches that out-
put DFGs tend to make this assumption. Instead, our
approach can show information beyond the discussed
KPIs. For example, we can to observe in Figure 1a
that certain users (like Tyler) contribute to more com-
mits than others – suggesting that these maybe senior
users – or that certain issues are more complex to solve
because they are related to busy users or they simply
require more work.
6 CONCLUSION
This paper explored the possibility of implementing
multi-dimensional process analysis on software de-
velopment data. In particular, we could i) show how
multi-dimensional process analysis can be applied to
software repository data, ii) compute basic KPIs to ana-
lyze the performance, and iii) perform process analysis
by means of event-knowledge graphs. We applied this
approach to real-world data from GitHub and could
observe its utility in uncovering reasons for under-
performance, such as author side-tracking.
In future work, we aim to extract further details
from process repositories in order to increase the
amount of relationships stored in the event knowledge
graph. We plan to investigate how the personal work-
flow of software developers affects the overall process.
ACKNOWLEDGEMENTS
This research was supported by the Einstein Founda-
tion Berlin under grant EPP-2019-524 and the Weizen-
baum Institute under grant 16DII133
REFERENCES
Agrawal, K., Aschauer, M., Thonhofer, T., Bala, S., Rogge-
Solti, A., and Tomsich, N. (2016). Resource classi-
Multi-Dimensional Process Analysis of Software Development Projects
185

fication from version control system logs. In EDOC
Workshops, pages 1–10. IEEE Computer Society.
Agrawal, M. and Chari, K. (2007). Software effort, quality,
and cycle time: A study of CMM level 5 projects. IEEE
Trans. Software Eng., 33(3):145–156.
Bala, S., Cabanillas, C., Mendling, J., Rogge-Solti, A., and
Polleres, A. (2015). Mining project-oriented business
processes. In BPM, volume 9253 of LNCS, pages 425–
440. Springer.
Bala, S., Mendling, J., Schimak, M., and Queteschiner, P.
(2018). Case and activity identification for mining pro-
cess models from middleware. In PoEM, volume 335
of Lecture Notes in Business Information Processing,
pages 86–102. Springer.
Bala, S., Revoredo, K., de A. R. Gon
c¸
alves, J. C., Bai
˜
ao,
F. A., Mendling, J., and Santoro, F. M. (2017). Uncov-
ering the hidden co-evolution in the work history of
software projects. In BPM, volume 10445 of LNCS,
pages 164–180. Springer.
Basili, V. R., Caldiera, G., and Rombach, H. D. (1994).
The goal question metric approach. Encyclopedia of
software engineering, pages 528–532.
Beheshti, S., Benatallah, B., and Motahari Nezhad, H. R.
(2013). Enabling the analysis of cross-cutting aspects
in ad-hoc processes. In CAiSE, volume 7908 of LNCS,
pages 51–67. Springer.
Benbunan-Fich, R., Adler, R. F., and Mavlanova, T.
(2011). Measuring multitasking behavior with activity-
based metrics. ACM Trans. Comput. Hum. Interact.,
18(2):7:1–7:22.
Biazzini, M. and Baudry, B. (2014). ”may the fork be with
you”: novel metrics to analyze collaboration on github.
In WETSoM, pages 37–43. ACM.
Esser, S. and Fahland, D. (2021). Multi-dimensional event
data in graph databases. J. Data Semant., 10(1-2):109–
141.
Fahland, D. (2022). Multi-dimensional process analysis. In
BPM, volume 13420 of Lecture Notes in Computer
Science, pages 27–33. Springer.
Ghahfarokhi, A. F., Park, G., Berti, A., and van der Aalst,
W. M. P. (2021). OCEL: A standard for object-centric
event logs. In ADBIS (Short Papers), volume 1450
of Communications in Computer and Information Sci-
ence, pages 169–175. Springer.
Jooken, L., Creemers, M., and Jans, M. (2019). Extracting a
collaboration model from VCS logs based on process
mining techniques. In Business Process Management
Workshops, volume 362 of Lecture Notes in Business
Information Processing, pages 212–223. Springer.
Keil, M. (1995). Pulling the plug: Software project manage-
ment and the problem of project escalation. MIS Q.,
19(4):421–447.
Khayatbashi, S., Hartig, O., and Jalali, A. (2023). Transform-
ing event knowledge graph to object-centric event logs:
A comparative study for multi-dimensional process
analysis. In ER.
Kindler, E., Rubin, V. A., and Sch
¨
afer, W. (2006). Activity
mining for discovering software process models. In
Software Engineering, volume P-79 of LNI, pages 175–
180. GI.
Marques, R., da Silva, M. M., and Ferreira, D. R. (2018).
Assessing agile software development processes with
process mining: A case study. In CBI (1), pages 109–
118. IEEE Computer Society.
Meneely, A., Corcoran, M., and Williams, L. A. (2010). Im-
proving developer activity metrics with issue tracking
annotations. In WETSoM, pages 75–80. ACM.
Munson, J. C. and Elbaum, S. G. (1998). Code churn: A
measure for estimating the impact of code change. In
ICSM, page 24. IEEE Computer Society.
Oliva, G. A., Santana, F. W., Gerosa, M. A., and de Souza,
C. R. B. (2011). Towards a classification of logical
dependencies origins: a case study. In EVOL/IWPSE,
pages 31–40. ACM.
Paasivaara, M. and Lassenius, C. (2003). Collaboration
practices in global inter-organizational software de-
velopment projects. Softw. Process. Improv. Pract.,
8(4):183–199.
Poncin, W., Serebrenik, A., and van den Brand, M. (2011).
Process mining software repositories. In CSMR, pages
5–14. IEEE Computer Society.
Rastogi, A., Gupta, A., and Sureka, A. (2013). Samiksha:
mining issue tracking system for contribution and per-
formance assessment. In ISEC, pages 13–22. ACM.
Shin, Y., Meneely, A., Williams, L. A., and Osborne, J. A.
(2011). Evaluating complexity, code churn, and devel-
oper activity metrics as indicators of software vulnera-
bilities. IEEE Trans. Software Eng., 37(6):772–787.
Tsoury, A., Soffer, P., and Reinhartz-Berger, I. (2018). A
conceptual framework for supporting deep exploration
of business process behavior. In ER, volume 11157 of
LNCS, pages 58–71. Springer.
van der Aalst, W. M. P. (2016). Process Mining - Data
Science in Action, Second Edition. Springer.
van der Aalst, W. M. P. (2019). Object-centric process min-
ing: Dealing with divergence and convergence in event
data. In SEFM, volume 11724 of Lecture Notes in
Computer Science, pages 3–25. Springer.
van der Aalst, W. M. P., Barthelmess, P., Ellis, C. A.,
and Wainer, J. (2001). Proclets: A framework for
lightweight interacting workflow processes. Int. J. Co-
operative Inf. Syst., 10(4):443–481.
Vasilescu, B., Serebrenik, A., Goeminne, M., and Mens, T.
(2014). On the variation and specialisation of workload
- A case study of the gnome ecosystem community.
Empir. Softw. Eng., 19(4):955–1008.
Vavpotic, D., Bala, S., Mendling, J., and Hovelja, T. (2022).
Software process evaluation from user perceptions and
log data. J. Softw. Evol. Process., 34(4).
Wieringa, R. J. (2014). Design Science Methodology
for Information Systems and Software Engineering.
Springer.
Zimmermann, T. and Weißgerber, P. (2004). Preprocessing
CVS data for fine-grained analysis. In MSR, pages 2–6.
Zimmermann, T., Weißgerber, P., Diehl, S., and Zeller, A.
(2005). Mining version histories to guide software
changes. IEEE Trans. Software Eng., 31(6):429–445.
MODELSWARD 2024 - 12th International Conference on Model-Based Software and Systems Engineering
186
