
The Role of Stop-Loss Orders in Market Efficiency and Stability: An
Agent-Based Study
Patrick Liston
1
, Charles Gretton
1
and Artem Lensky
2,3
1
The Australian National University, College of Engineering, Computing and Cybernetics, Canberra, Australia
2
School of Engineering and Technology, The University of New South Wales, Canberra, ACT, Australia
3
School of Biomedical Engineering, Faculty of Engineering, The University of Sydney, Sydney, NSW, Australia
Keywords:
Market Simulation, Agent-Based Simulation, Limit Order Book, Stop-Loss Cascade, Market Manipulation.
Abstract:
Stop-loss orders can have large and ranging effects on the behaviours and outcomes for participants within
financial markets. We develop and demonstrate an approach to studying the effect of stop-losses on price
dynamics within a financial market. Using our high-fidelity agent-based market simulator that draws on his-
torical limit order book data, we illustrate that the introduction of stop-loss orders leads to volatility, creating
the potential for stop-loss cascades that result in large price movements. We study a market containing an
agent that is able to trigger such events and profit from them. We indicate that the structure of the stop-loss
order book may be used by such an agent to inform trading decisions and to generate volatility within markets
for their benefit. Finally we demonstrate how the agents closing strategy effects both the profitability of the
agent, as well as the price trajectory of the market.
1 INTRODUCTION
Stop-loss orders are a common risk management
tool used by traders in financial markets to minimise
losses. They allow the automatic closing of a position
and use a similar mechanism as a margin call, to limit
investors’ losses. If the price of the traded good drops
below a given threshold, they will execute a sell in or-
der to cover their position, realising a loss. However,
stop-loss orders can also amplify market volatility and
lead to large price movements.
Stop-loss orders are widely used and their use
is common practice among professional traders
(Vytelingum, 2006). They impact market dynamics
and are of immense interest in the study of markets
and agent strategies. We approach the study of stop-
loss orders and consequent price volatility, including
cascades, using agent-based market simulation. Our
agent-based framework enables the study of market
effects. Our simulation approach also facilitates the
study of individual agent strategies. Here, in particu-
lar, we examine strategies that attempt to trigger and
profit from price volatility.
To the best of our knowledge, we are the first to
develop an agent-based simulation to investigate how
stop-loss orders can affect agent outcomes and price
volatility.
2 PRELIMINARIES
Continuous Double Auction (CDA)
The CDA is a common market mechanism used
to store and match orders, thus facilitating trading.
In a CDA, there is a fixed-duration trading period
during which buy orders (“bids”) and sell orders
(“asks”) may be submitted. When bids and asks are
compatible in terms of price and quantity, a trade is
executed. If new orders are not compatible, the order
is placed in the Limit Order Book (LOB) for future
execution (Vytelingum, 2006).
Limit Order Book
The LOB maintains a list of bids and asks (with
their associated price level and quantity) that have
been submitted to the exchange. When an order
is submitted it is initially checked against existing
orders within the LOB. Orders that may be filled are
executed, whilst those that cannot be matched will be
added to the LOB.
Order Types
Importantly we distinguish two main order types
that can be used in a CDA: limit orders and market
orders. Limit orders specify the price at which a trade
is made. They will only be executed if there is an
280
Liston, P., Gretton, C. and Lensky, A.
The Role of Stop-Loss Orders in Market Efficiency and Stability: An Agent-Based Study.
DOI: 10.5220/0012371400003636
Paper published under CC license (CC BY-NC-ND 4.0)
In Proceedings of the 16th International Conference on Agents and Artificial Intelligence (ICAART 2024) - Volume 1, pages 280-288
ISBN: 978-989-758-680-4; ISSN: 2184-433X
Proceedings Copyright © 2024 by SCITEPRESS – Science and Technology Publications, Lda.

opposing order that satisfies this price requirement.
Limit orders that are not executed remain in the LOB.
Market orders, in contrast, are executed immediately
and will pay the best available price for the given
quantity. Market orders do not enter the LOB if they
are partially or wholly unfulfilled.
Stop-Loss Orders
Stop-loss orders, a sub-type of market and limit or-
ders, allow a market participant to buy or sell a good
if its value reaches a certain trigger price. Often used
to close a position these orders are typically used in an
attempt to limit an investors’ losses. If the price of the
traded good reaches the given threshold, the trader’s
order is executed (usually as a market order), covering
their position.
Typically, exchanges maintain two separate order
books. A LOB, visible to all traders in a market, and
a stop-loss order book, visible only to the exchange.
This separation and opacity of the stop-loss order
book are justified and necessary to help prevent
snowball effects and stop-loss cascades, as have been
studied in (Osler, 2005).
Stop-Loss Cascade
A stop-loss cascade is a rapid, self-reinforcing price
movement or ”price cascade” catalyzed by the trig-
gering of stop-loss orders. In a stop-loss cascade,
an asset moves in a particular direction, triggering a
small number of stop-loss positions to be activated.
This execution subsequently moves the price further
in the given direction, triggering further stop-loss or-
ders, and so on.
3 SIMULATOR
Using a method similar to (Spooner et al., 2018; Lis-
ton et al., 2022; Liston et al., 2023) we developed a
market simulator for a single asset. Relying on recon-
struction from historical data, our approach has been
shown to be highly realistic, and makes minimal as-
sumptions about the market.
3.1 Data
Historical trade data was obtained from the cryptocur-
rency exchange Binance. We use the currency pair
Bitcoin/Tether (BTCUSDT). This choice was moti-
vated by the desire to simulate a well-known and
heavily traded market. Furthermore, it has been
shown in (Alexander et al., 2021) that due to mar-
ket arbitrage and a high correlation of Bitcoin price
with prices of altcoins, BTCUSDT traded on Binance
is the main source of volatility and price movement
that flows to all other related markets and exchanges.
Hence, this data should reliably allow us to make gen-
eral statements about the LOB structure and dynam-
ics, which should also be able to be generalized to
other markets and exchanges.
Tick-level data was used to guide the simulation,
with each entry representing a single trade.
A trade record consists of: trade ID,
time, price, quantity, quote quantity,
and direction.
LOB data, containing 20 levels on both Bid and
Ask sides (price levels and quantity), was also ob-
tained and updated when a new order was added or re-
moved from the LOB. All data used was from Novem-
ber 2021.
3.2 Simulator
We simulate a financial market using a hybrid of real
order book data and synthetic trades placed by agents.
Important within the system is the timing, size and
direction of trades placed.
The simulator utilises a real historical order
book to guide price levels within the market, while
Zero-Intelligence (ZI) agents place market orders
at previously observed tick intervals. These market
orders subsequently ”shift” the order book, such
that the agents’ orders drive the direction of the
market, while the limit order book determines the
size of the move and the structure of the market.
Agents determine their trade size by sampling from a
distribution constructed from historical trades.
Limit Order Book Extension
Given that the available LOB data contains only the
top 20 price levels, agents’ market orders can exceed
the depth of the real order book. This may occur
when an agent’s order size is very large, or in partic-
ular when we investigate the injection of a shock. To
address this problem, we developed a series of mul-
tilayer perceptron (MLP) models to approximate the
proceeding 480 levels. These are recursively called
when the limit order book depth is not sufficient to fill
the agents’ market orders, extending the book indefi-
nitely until the agent’s order may be completely filled.
Stop-Losses
We perform simulation experiments in markets both
with and without stop-loss orders. In simulations
where stop-loss orders are permitted, a separate stop-
loss order book is created and agents may place stop-
loss orders in addition (and in opposition) to their
market order.
The Role of Stop-Loss Orders in Market Efficiency and Stability: An Agent-Based Study
281

To determine the price of the stop-loss order a
log-normal distribution was used, sizing the stop-loss
difference/level inversely from the agents’ trade size
(Acar and Toffel, 2001).
Stop-loss orders remain in the stop-loss order
book until their trigger price is reached, exceeded, or
they are cancelled. Before the selection of an agent
and execution of a market order, the market price is
checked against all orders within the stop-loss book.
Any order within the stop-loss book that has a trigger
price that has been reached is then activated. The or-
der is triggered, executed and hence causes the LOB
to shift. After the execution of a single stop-loss or-
der, the LOB is shifted accordingly, and the stop-loss
book is checked again to determine if the trigger price
of any other orders has been reached. Once this pro-
cess ends, standard order placement is resumed.
1
It is important to note that market orders take
execution precedence over stop-loss orders. Hence,
while a market order is being executed no stop-loss
orders can be triggered. After the market order is
completely filled the stop-loss order book is reviewed,
and stop-loss orders that have reached their trigger
price are executed.
Limitations
This method of simulation makes limited assumptions
and has previously been shown to be highly accurate
(Spooner et al., 2018), however, it should be noted
that agents’ actions do not affect the structure of the
limit order book. Agents’ trades alter the price of the
market and shift the limit order book price levels, but
do not result in the addition or removal of orders from
the limit order book.
Additionally, despite the efforts that have been
made to extend the LOB for cases where agents’ or-
der size exceeds the depth of the book. This extension
by its nature may not always truly replicate reality.
However, as noted in (Torii et al., 2015) the aim
of this study is to arrive at a qualitative description
of the mechanisms and influences of stop-losses and
stop-loss agent strategies, not to reproduce the char-
acteristics of real markets.
3.3 Simulator Verification
To verify the ability of the simulator to create realis-
tic price dynamics we first visually inspect samples.
Figure 1 shows the price dynamics for 50 simulations
containing 100,000 trades on 11/20/2021. We ob-
serve similar price patterns emerge and that the simu-
lator produces plausible realisation and price paths.
1
When executing stop-loss orders, no additional stop-
loss orders may be placed.
00:00
Nov 20, 2021
00:05 00:10 00:15 00:20 00:25 00:30
57k
57.5k
58k
58.5k
_spikeDIRECTION_None_BuyBackStrat_1_spiked_0_
Time
Price (USDT)
Figure 1: Simulated price dynamics for 50 Simulations of
100,000 trades for BTCUSDT on 11/20/2021. Blue solid
lines represent the average simulated price, and red repre-
sents the observed (real) price from historical ticks. The
faded lines show the various trials.
Further, we utilise standard procedures stipulated
in (Cont, 2001) to examine the stylized facts of the
market and compare them to those observed in reality
for the same dates. Note that some stylized facts are
inherent features of the simulation approach we have
pursued. Because the limit order book used to guide
the price was taken from the observed data, it is not
necessary to validate the statistical properties of the
structure of the limit order book. Similarly, such in-
terrogation is not required for trade sizing as we sam-
ple from historical data. Additionally, given that all ZI
trades are aligned to execute at times when real trades
occurred within the historical data, no consideration
for trade arrival time is necessary.
Our validation work is focused on the statisti-
cal properties of simulated returns. We consider the
logarithmic-returns of the price, focusing on the skew,
kurtosis, volatility autocorrelation, and price autocor-
relation. Table 1 illustrates that the stylized facts
of the simulation fall within the range for all mea-
surements undertaken, indicating that simulations can
largely emulate realistic price dynamics. While we do
note that there is generally lower autocorrelation for
both volume and log-returns for simulated markets,
this is likely due to the use of ZI agents. Although
real markets may exhibit long-range dependency of
trade directions, the purely random trade directions
generated by the ZI agents deviate from this market
characteristic and is a familiar limitation of this sim-
ulation approach. This may have small impacts at the
granular level, however, it should not materially affect
the broader outcomes of this study.
4 EXPERIMENTAL EVALUATION
We have performed 3 major experiments. Initially,
we create a market that allows stop-loss orders. We
ICAART 2024 - 16th International Conference on Agents and Artificial Intelligence
282

Table 1: Aggregated stylised facts at tick level, computed over 50 trials of 100,000 ticks for each day between 11/01/2021
and 11/30/2021. Compared to the stylised facts observed for 100,000 ticks on each day between 11/01/2021 and
11/30/2021. We report the mean, maximum and minimum observed values.
Skew Kurtosis Return Autocorr. Volatility Autocorr.
Observed 3.09 (−1.04–5.43) 1,007 (523–1888) −2.64 (−3.20–−0.63) −6.50 (−0.61–7.0)
Simulated 0.22 (−2.30–1.50) 1,186 (302–1.144) −8.40 (−6.20–−0.29) −17.0 (−12.0–−0.54)
analyse the impact and compare volatility between
markets with and without stop-loss orders. We then
construct an agent that inputs large shock orders into
these markets and observe its effect. Finally, we in-
vestigate closing strategies that this agent may use and
how these affect both the agents’ profitability, as well
as the market as a whole.
4.1 Introduction of Stop-Loss Orders
In this experiment, our aim was to observe the ef-
fects of the market with stop-losses, noting their effect
on price path formation and volatility. This is done
by measuring the variance in logarithmic returns, as
given by: σ
2
=
1
N−1
∑
N
t=1
(R
t
−
¯
R
t
)
2
. Here, σ
2
is the
variance/volatility, R
t
is the log return at time t,
¯
R
t
is
the mean of all log returns for the given period, and N
denotes the number of observations considered (Poon
and Granger, 2003).
We enable the execution of stop-loss orders as
specified previously and consider two scenarios. One
where stop-losses are not permitted, and the other
where stop-losses are permitted. This experiment
is run 50 times for each date within 11/01/2021 -
11/30/2021. The resulting volatility measures are
shown in Table 2, and Figure 2 displays the market
output for the first 100,000 ticks on 11/20/2021.
00:00
Nov 20, 2021
00:05 00:10 00:15 00:20 00:25 00:30
56.5k
57k
57.5k
58k
58.5k
59k
59.5k
Stop-Loss Comparison
Time
Price (USDT)
Figure 2: Price dynamics for the without stop-loss orders
(yellow) and with stop-loss orders (blue) for 20/11/2021.
The volatility of the market is increased when
stop-loss orders are introduced (Table 2). In partic-
ular, an approximate 27% increase in mean volatility
and the minimum volatility was observed in the mar-
ket containing stop-losses exceeding the maximum
volatility observed when a market did not contain any
stop-loss orders. This indicates a clear distinction that
the addition of stop-loss orders has the potential to
have a large impact on volatility.
Further, we visualise the effects of the addition
of stop-loss orders in Figure 2. We observe both an
increase in volatility throughout the simulation and
the generation of moments of singular large volatil-
ity/price movements (shocks), most notably around
the 10 minute mark.
The presence of price shock moments indicates
the execution of sequential stop-loss orders. As such,
this suggests an agent with sufficient capital may be
able to submit a large order to create a market shock,
and thus trigger this sequential execution and hence a
stop-loss price cascade.
4.2 Triggering Stop-Loss Cascades
Having shown that markets with stop-loss orders may
experience movements of large price volatility, we
seek to introduce an agent that may induce such stop-
loss cascade events. We construct an agent that places
a large order that acts as an impulse or a shock to
the market. Drawing inspiration from (Balch et al.,
2019), the impulse is sized to correspond to 500% of
the total volume within the limit order book for the
given time. The agent then injects this impulse order
either in an upward (buy) or downward (sell) direc-
tion, consuming the entire volume within the order
book and triggering stop-loss orders in that direction.
We compare the market’s reaction when the agent
submits an impulse with/without stop-losses orders in
the simulated market. We also compare the outcomes
of this shock when placed as a buy or a sell. We
perform 50 trials under each computational set-up,
with each trial containing 100, 000 ticks, for the date
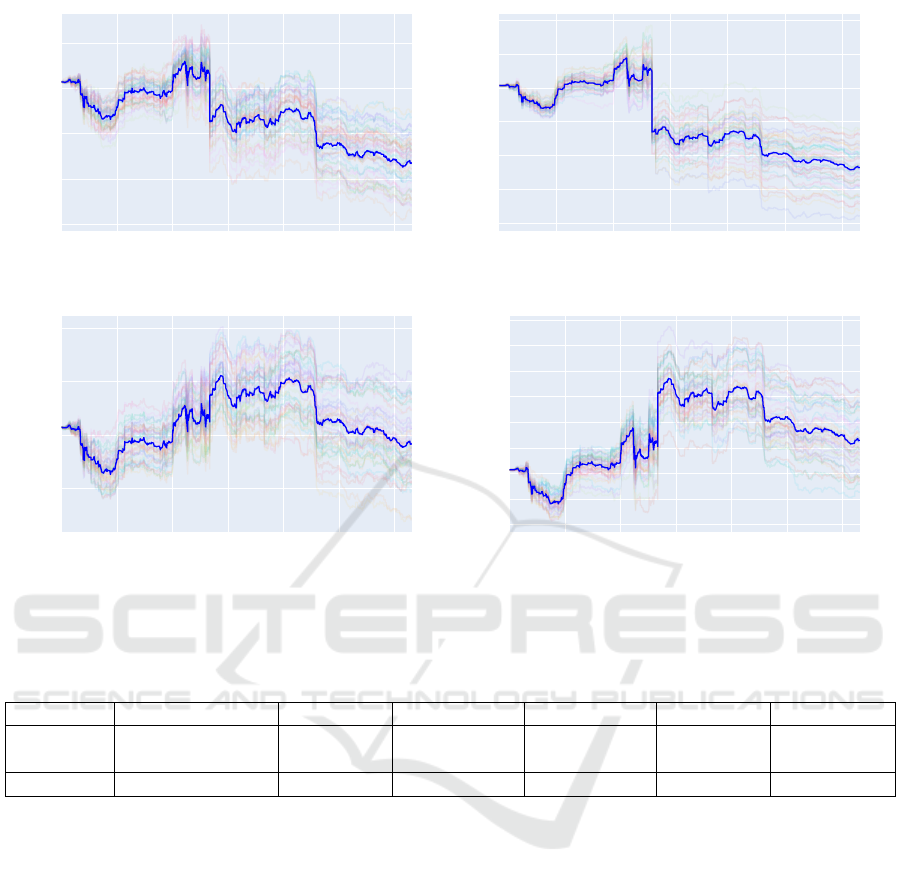
of 11/21/2021. Figure 3 displays the visual impact
these shocks had on the market, and Table 2 shows
the volatility observed for each experimental set-up.
Comparing Figure 3(c) with Figure 3(d). We note
that when a shock is injected into the market the reac-
tion within the market that does not contain stop-loss
orders is relatively muted compared to the market that
allows stop-loss orders. This is further supported by
The Role of Stop-Loss Orders in Market Efficiency and Stability: An Agent-Based Study
283
00:00
Nov 20, 2021
00:05 00:10 00:15 00:20 00:25 00:30
56.5k
57k
57.5k
58k
58.5k
_spikeDIRECTION_DOWN_BuyBackStrat_1_spiked_
Time
Price (USDT)
(a) Down shock injected, stop-loss orders are not permitted.
00:00
Nov 20, 2021
00:05 00:10 00:15 00:20 00:25 00:30
54k
55k
56k
57k
58k
59k
60k
_spikeDIRECTION_DOWN_BuyBackStrat_1_spiked_
Time
Price (USDT)
(b) Downward shock injected, stop-loss orders are permitted.
00:00
Nov 20, 2021
00:05 00:10 00:15 00:20 00:25 00:30
57.5k
58k
58.5k
59k
_spikeDIRECTION_UP_BuyBackStrat_1_spiked_1_S
Time
Price (USDT)
(c) Upward shock injected, stop-loss orders not permitted.
00:00
Nov 20, 2021
00:05 00:10 00:15 00:20 00:25 00:30
57k
57.5k
58k
58.5k
59k
59.5k
60k
60.5k
61k
_spikeDIRECTION_UP_BuyBackStrat_1_spiked_1_S
Time
Price (USDT)
(d) Upward shock injected, stop-loss orders are permitted.
Figure 3: Comparison of price dynamics when stop-loss orders are permitted (b, d) and not permitted (a, c). When a downward
(a, b) or upward (c, d) shock was injected.
Table 2: Volatility of returns for various market conditions. 50 Simulations of 100,000 trades for BTCUSDT on 11/20/2021.
No-SL,No Shock No-SL,Up No-SL,Down SL,No Shock SL,UP SL,Down
Volatility 1.68 2.14 3.03 2.76 6.20 9.79
(1.63-1.74) (2.06-2.21) (3.00-3.08) (2.53-3.07) (4.47-9.38) (5.57-12.18)
Difference 0 +0.46 +1.35 +1.08 +4.52 +8.11
examining Table 2, which shows a clear and large in-
crease in market volatility when a shock is present in a
market with stop-losses as opposed to a market with-
out stop-losses. With volatility increases of 6.76 and
4.06 in the downward and upward direction respec-
tively. This once again shows the effect stop-losses
have on price path generation, volatility and the mar-
ket as a whole. With increased volatility and largely
different price outcomes.
Considering the impact of shocks when placed in
a downward (sell) and upward (buy) direction, we
observe differences in the magnitude of reaction and
price path deviation between Figure 3(b) and Figure
3(d). Notably, despite both orders being the same
size, the shock submitted in the downward direction
caused significantly larger price deviation (∼ $3,000)
than the shock in the upward direction (∼ $1,000).
Additionally from Table 2 we see that when this shock
was submitted in the downward direction, the change
in market volatility when injected into the stop-loss
market had a much larger effect on market volatility
(+6.76) compared to when it was submitted in the
upward direction (+4.06). These results indicate that
the structure of both the limit and the stop-loss order
books are likely to play a large role in determining the
size of the impact that large orders may have.
While we note that both the limit and stop-loss or-
der books are likely to play a role in determining the
outcomes of shock events, we consider the difference
in volatility from the baseline that is generated. As
seen in Table 2, while the introduction of shock events
significantly increases volatility (+1.35 and +0.46)
for downward and upward shocks, respectively, the
increase in volatility due to a downward shock with
the presence of stop-losses far exceeds that of the up-
ward shock (+8.11 and +4.52). This indicates that
the stop-loss order book plays a larger role in the im-
pact of shocks. Hence, we suggest that the structure of
ICAART 2024 - 16th International Conference on Agents and Artificial Intelligence
284

the stop-loss order book provides vital information to
inform agents’ ability to trigger cascade events, par-
ticularly to maximise their return.
4.3 Position Closing
We have shown that the direction in which an agent at-
tempts to cause a price cascade affects the price move-
ment within the market and hence the profit an agent
may obtain. Given the size of the agent’s position it is
also vitally important, both for the agent and for the
market as a whole, to study how the agent closes their
position.
We experiment with 3 strategies that the agent
may use to close their position. We examine how this
affects the agent’s profit, as well as observe how this
alters the price path observed within the market.
1. Buy and hold: An agent holds and receives a
“marked to market” value of their shares at the
conclusion of the simulation period. (Assume the
agent closes their position without slippage.)
2. Single Trade Closure: An agent waits a set pe-
riod t then fully closes their position. This ensures
the agent’s closing share balance is equal to their
opening balance.
In our implementation the agent conducts a single
order, 1, 000 ticks after their initial large order.
3. Spread Trade Closure: An agent makes multiple
(n) trades, to close out their position and return to
their initial share balance over time t.
In our implementation, the agent conducts 10
trades of equal size over the proceeding 10,000
ticks after their initial large order.
Each of the strategies was tested with both an up-
ward (buy) and downward (sell) shock. Both con-
ditions were tested with 50 simulations for 100, 000
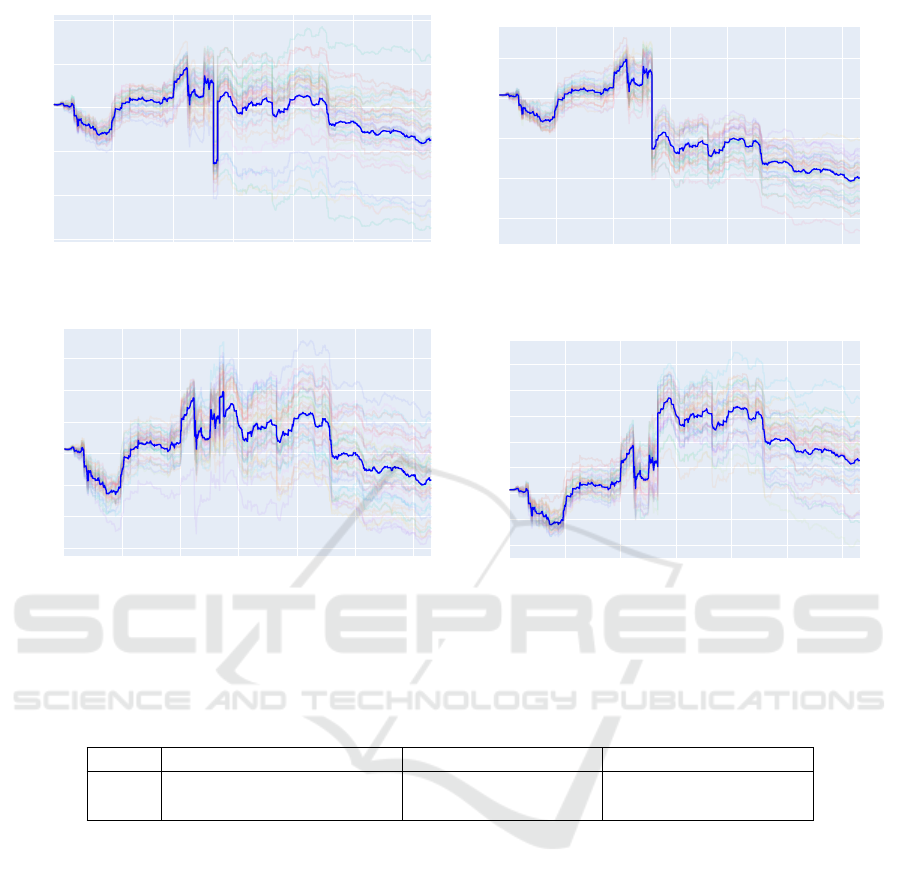
ticks on the date of 11/21/2021. Figure 4, and Figure
3 (b) and (d) display the visual impact these strate-
gies. While Table 3 shows the profit generated by
each strategy, and Table 4 displays the market volatil-
ity for each experimental set-up.
We once again observe a difference in shock
size between the buy/sell experiments. We therefore
highlight the importance of the shock direction on the
size of the cascade. This is shown both visually in
Figure 4 and numerically by the increase in volatility
noted in Table 4. Together this suggests that the
structure, and likely the skew of the stop-loss order
book largely contributes to the size of the cascade
and that the existence of support/resistance has the
potential to mute the effect of the shock. Therefore
we hypothesise that knowledge of stop-loss order
sizes and locations could be a key determinant in the
success of such shock agents.
When considering the profitability of the agent we
see that both the direction of the agent’s trade and the
closing strategy employed significantly alter its out-
come. If an agent may only utilise a buy and hold
strategy it is most advantageous to create a downward
shock ($2,210, 000 vs. −$2,530,000), and in fact the
agent loses money if it initiates an upward movement.
However, when undertaking either of the other strate-
gies (single trade closure or spread trade closure) it
is more profitable for the agent to cause an upward
price movement ($2, 060, 000 & $2, 140,000 for up-
ward shocks compared to, $98, 100 & $525,000 for
downward shocks). This dichotomy highlights both
that the closing strategy of the agent, and also that
structure of the stop-loss book are vitally important
in informing the agent’s decision if it seeks to gain a
profit. By examining Figure 3(b) it is possible to see
why this effect may occur. When the agent undertakes
the strategy of buy and hold it forces the price in a di-
rection, however, if the agent waits too long to close
it’s trade, it allows time for the price path to progress
and gives other agents within the simulation more of
chance to influence the price progression. However, if
the agent fully closes their trade within a smaller pe-
riod of time, it is able to take advantage of the power
it exerted over the market. This is illustrated by the
single trade closure and spread trade closure strate-
gies. In both cases, the agent closes its trade in a
timely fashion after exerting control over the market.
Although, in the case of the single trade closure the
agent causes a ”whiplash” effect within the market.
Spiking the price almost as far in the opposite direc-
tion from its original trade, and diminishing the profit
the agent generated. Whereas the spread trade clo-
sure strategy allows the agent sufficient time to min-
imise this whiplash effect, whilst also enabling it to
close its position within a reasonable time allowing it
to benefit from its previous price altering efforts.
Given this propensity to create whiplash effects
within the market, it is interesting to examine the ef-
fects of these strategies on the volatility of the market
as a whole. Table 4 describes the volatility of each
scenario. Interestingly we see that when we compare
the buy and hold closing strategy with spread trade
closure strategy the level of volatility is very simi-
lar (within ∼ 2%). Meanwhile, the single trade clo-
sure strategy results in overall volatility that is ∼ 25%
larger than buy and hold. This, once again emphasises
the impact of the closure strategy, while also indicat-
ing that the triggering of stop-loss orders has a part
to play in this. The single trade method is likely to
reactivate newly placed stop-loss orders.
The Role of Stop-Loss Orders in Market Efficiency and Stability: An Agent-Based Study
285
00:00
Nov 20, 2021
00:05 00:10 00:15 00:20 00:25 00:30
55k
56k
57k
58k
59k
60k
_spikeDIRECTION_DOWN_BuyBackStrat_2_spiked_
Time
Price (USDT)
(a) Downward shock injected, position closed in a single trade.
00:00
Nov 20, 2021
00:05 00:10 00:15 00:20 00:25 00:30
55k
56k
57k
58k
59k
_spikeDIRECTION_DOWN_BuyBackStrat_3_spiked_
Time
Price (USDT)
(b) Downward shock injected, position closed incrementally.
00:00
Nov 20, 2021
00:05 00:10 00:15 00:20 00:25 00:30
56.5k
57k
57.5k
58k
58.5k
59k
59.5k
_spikeDIRECTION_UP_BuyBackStrat_2_spiked_1_S
Time
Price (USDT)
(c) Upward shock injected, position closed in a single trade.
00:00
Nov 20, 2021
00:05 00:10 00:15 00:20 00:25 00:30
57k
57.5k
58k
58.5k
59k
59.5k
60k
60.5k
_spikeDIRECTION_UP_BuyBackStrat_3_spiked_1_S
Time
Price (USDT)
(d) Upward shock injected, position closed incrementally.
Figure 4: Comparing price path effects for agents closing positions (a, c) immediately, and (b, d) incrementally. Under
downward (a, b) and upward (c, d) shock conditions.
Table 3: Profits of Shock agent (in US Dollars) under varying shock direction and position closing strategy. 50 Simulations
of 100,000 trades for BTCUSDT on 11/20/2021.
Shock Buy & Hold Single Trade Closure Spread Trade Closure
Up −253 × 10
4
(−273–−210) 206 × 10
4
(196–250) 214 × 10
4
(196–234)
Down 221 × 10
4
(196–240) 9.81 × 10
4
(2.2–15.6) 52.5 × 10
4
(23.5–75.8)
In all, this simulation case study suggests that an
agent can utilise stop-loss knowledge to create a more
informed strategy to generate profit. While regular
exchanges are prohibited by the Securities Exchange
Commission (SEC) from utilising this insider infor-
mation to trade against their clients, this is not the
case for Cryptocurrency exchanges. This allows ex-
changes to obtain an informational advantage to trade
against their users. Hence, opening up the possibil-
ity of exchanges orchestrating events similar to those
shown in Figure 4 for their gain.
5 RELATED WORK
Agent-based simulations have risen in popularity over
recent years. Their ability to conduct A/B testing and
analyse events that may not have occurred historically
make them an almost ideal test-bed to understand the
effects of regulation or rule changes, the performance
of trading algorithms, and the disturbance of mar-
ket conditions that have not been previously observed
(Mizuta, 2016). As such Agent-based market sim-
ulations have contributed to analysis of price varia-
tion limits (Todd et al., 2016), whether short-selling
regulations could aid in the prevention of bubbles
and crashes (Yeh and Yang, 2010; in’t Veld, 2016;
Xiong et al., 2022), as well as the impact of tick sizes
(Yagi et al., 2010), circuit breakers (Kobayashi and
Hashimoto, 2011) and many other regulatory ques-
tions. Agent-based simulators have also been used to
discover and test new trading regimes, and to under-
stand the effects they may exhibit on markets. No-
tably, testing regime identification and trading poli-
cies (Amrouni et al., 2022); determining and mimick-
ing agents’ strategies (Mahfouz et al., 2021); and in-
ICAART 2024 - 16th International Conference on Agents and Artificial Intelligence
286

Table 4: Market volatility for varying shock direction and closure strategies. 50 Simulations of 100,000 trades for BTCUSDT
on 11/20/2021.
Shock Buy & Hold Single Trade Closure Spread Trade Closure
Up 6.20 (4.40–9.33) 7.85 (5.47–11.23) 6.14 (4.47–9.38)
Down 9.79 (5.57–12.18) 12.34 (6.91–14.91) 9.98 (5.88–11.08)
vestigating methods for evaluating trading strategies
(Balch et al., 2019).
A fundamental building block of agent-based sim-
ulation is of course the agents. Early market simula-
tion relied solely on the concept of Zero-Intelligence
(ZI) agents. First coined by Gode in 1993 (Gode and
Sunder, 1993), these baseline ZI agents are a family of
automated agents that submit random BID and ASK
orders. ZI agents and their variations have formed
the basis for many investigations into agent behaviour
and market properties. For example, ZI agents were
used by (Bollerslev and Domowitz, 2018) to ana-
lyze the structural impact of restricting the maximum
depth of an order book. In (Duffy and
¨
Unver, 2006)
they are used near-ZI agents to study asset price bub-
bles and crashes. Such agents also feature broadly
in markert simulations when studying more complex
agents adjacent to these in the exploration of market
phenomena (Wang and Wellman, 2017; Byrd et al.,
2020).
The concept of stop-loss cascades is not a
new idea and has been commonly observed within
FOREX markets. Osler (2005) provides evidence of
self-reinforcing price movements or “price cascades”
catalyzed by stop-loss orders. While (Noertjahyana
et al., 2020) proposes a trading strategy that takes ad-
vantage of such cascading events to generate profit.
Further, they have shown to be especially common in
cryptocurrency markets (Machowski, 2021).
6 CONCLUSION
In this paper, we have performed 3 major experi-
ments. Initially, we created a market that allowed
stop-loss orders. We compared and showed that the
introduction of stop-loss orders increases generalised
price volatility, as well as increasing the risk of large
price movements. Further, we constructed an agent
that submitted large (shock) orders and triggered stop-
loss cascades. We illustrated that the direction of
these orders plays an important role in the size of the
cascade and the market reaction. Finally, we demon-
strated the impact the agent’s closing strategy has
both on its profit, as well as the market’s price evolu-
tion. Illustrating that a slower re-accumulation strat-
egy leads to more reliable returns and less volatility
within the market.
Future Work
We focused on the impact of a single shock size on the
market. It would be interesting to study how the size
of the shock affects the market’s response, and per-
form experiments similar to (Balch et al., 2019). Par-
ticularly, to investigate if large shocks result in new
steady price levels being reached, and how the size
of the stop-loss cascade and thus the movement away
from previously placed stop-loss orders then affects
the continuing market, or if in fact, smaller shocks
simply see a return to previous price levels.
Further, our agent did not consider the structure
of the stop-loss order book when placing its orders.
A deeper analysis of the structure of the stop-loss or-
der book and its effect on the size and the resulting
price movements may greatly aid in understanding
stop-loss cascades as a phenomenon.
Additionally, this information could be used to
determine the optimal size and timing of the shock.
Either leading to improved hand-crafted agents, or
the application of reinforcement learning to create
more profitable agents that drive these market effects.
REFERENCES
Acar, E. and Toffel, R. (2001). Stop-loss and investment
returns. Financial Times/Prentice Hall, pages 51–68.
Alexander, C., Heck, D., and Kaeck, A. (2021). The role
of binance in bitcoin volatility transmission. arXiv
preprint arXiv:2107.00298.
Amrouni, S., Moulin, A., and Balch, T. (2022). Ctm-
stou driven markets: simulated environment for
regime-awareness in trading policies. arXiv preprint
arXiv:2202.00941.
Balch, T. H., Mahfouz, M., Lockhart, J., Hybinette, M., and
Byrd, D. (2019). How to evaluate trading strategies:
Single agent market replay or multiple agent interac-
tive simulation? arXiv preprint arXiv:1906.12010.
Bollerslev, T. and Domowitz, I. (2018). Some effects of
restricting the electronic order book in an automated
trade execution system. In The Double Auction Mar-
ket Institutions, Theories, and Evidence, pages 221–
252. Routledge.
Byrd, D., Hybinette, M., and Balch, T. H. (2020). Abides:
Towards high-fidelity multi-agent market simulation.
In Proc. 2020 ACM SIGSIM Conference on Princi-
ples of Advanced Discrete Simulation, page 11–22,
The Role of Stop-Loss Orders in Market Efficiency and Stability: An Agent-Based Study
287

New York, NY, USA. Association for Computing Ma-
chinery.
Cont, R. (2001). Empirical properties of asset returns: styl-
ized facts and statistical issues. Quantitative finance,
1(2):223.
Duffy, J. and
¨
Unver, M. U. (2006). Asset price bubbles and
crashes with near-zero-intelligence traders. Economic
theory, 27:537–563.
Gode, D. K. and Sunder, S. (1993). Allocative efficiency
of markets with zero-intelligence traders: Market as a
partial substitute for individual rationality. Journal of
political economy, 101(1):119–137.
in’t Veld, D. (2016). Adverse effects of leverage and short-
selling constraints in a financial market model with
heterogeneous agents. JOURNAL OF ECONOMIC
DYNAMICS & CONTROL, 69:45–67.
Kobayashi, S. and Hashimoto, T. (2011). Benefits and lim-
its of circuit breaker: Institutional design using arti-
ficial futures market. Evolutionary and Institutional
Economics Review, 7:355–372.
Liston, P., Gretton, C., and Lensky, A. (2022). Limit Order
Book and its Role in Price Development - A Hybrid
Approach to Simulating a Market. In 3rd ACM Inter-
national Conference on AI in Finance (ICAIF-22).
Liston, P., Gretton, C., and Lensky, A. (2023). Modeling
the Effect of Cascading Stop-Losses and Its Impact
on Price Dynamics. In AI for Financial Institutions.
AAAI Bridge 2023 FinST.
Machowski, K. (2021). Scamwicks and stop cascades.
Mahfouz, M., Balch, T., Veloso, M., and Mandic, D. (2021).
Learning to classify and imitate trading agents in con-
tinuous double auction markets. In Proceedings of the
Second ACM International Conference on AI in Fi-
nance, pages 1–8.
Mizuta, T. (2016). A brief review of recent artificial market
simulation (agent-based model) studies for financial
market regulations and/or rules. Available at SSRN
2710495.
Noertjahyana, A., Christopher, A., Abas, Z. A., Yusoh, Z.,
and Setiawan, A. (2020). Stop hunt detection using
indicators and expert advisors in the forex market. In
Journal of Physics: Conference Series, volume 1502,
page 012054. IOP Publishing.
Osler, C. L. (2005). Stop-loss orders and price cascades in
currency markets. Journal of international Money and
Finance, 24(2):219–241.
Poon, S.-H. and Granger, C. W. J. (2003). Forecasting
volatility in financial markets: A review. Journal of
economic literature, 41(2):478–539.
Spooner, T., Fearnley, J., Savani, R., and Koukorinis, A.
(2018). Market making via reinforcement learning. In
Proceedings of the 17th International Conference on
Autonomous Agents and MultiAgent Systems, pages
434–442.
Todd, A., Beling, P., Scherer, W., and Yang, S. Y. (2016).
Agent-based financial markets: A review of the
methodology and domain. In 2016 IEEE Symposium
Series on Computational Intelligence (SSCI), pages 1–
5.
Torii, T., Izumi, K., and Yamada, K. (2015). Shock transfer
by arbitrage trading: analysis using multi-asset artifi-
cial market. Evolutionary and Institutional Economics
Review, 12:395–412.
Vytelingum, P. (2006). The structure and behaviour of the
continuous double auction. PhD thesis, University of
Southampton.
Wang, X. and Wellman, M. (2017). Spoofing the limit order
book: An agent-based model.
Xiong, X., Liu, J., Yang, Z., Han, J., et al. (2022). An agent-
based model for the impact of price limit changes
on market quality. International Journal of Infor-
mation Technology & Decision Making (IJITDM),
21(06):1777–1795.
Yagi, I., Mizuta, T., and Izumi, K. (2010). A study on the ef-
fectiveness of short-selling regulation using artificial
markets. Evolutionary and Institutional Economics
Review, 7:113–132.
Yeh, C.-H. and Yang, C.-Y. (2010). Examining the ef-
fectiveness of price limits in an artificial stock mar-
ket. Journal of Economic Dynamics and Control,
34(10):2089–2108.
ICAART 2024 - 16th International Conference on Agents and Artificial Intelligence
288
