
Development of a Machine Learning Based in-Home Physical Activity
Monitoring System Using Wrist Actigraphy and Real-Time Location
System
Seyyed Mahdi Torabi, Mohammad Narimani and Edward J. Park
School of Mechatronic Systems Engineering, Simon Fraser University, Surrey, BC, Canada
Keywords: Wearable Technology, Human Activity Recognition, Machine Learning, Indoor Localization, Multi-Modal
Sensing, Physical Activity Monitoring.
Abstract: In this study, a multi-modal sensing approach was employed to enhance human activity recognition (HAR).
The approach integrated data from a wearable wristband and a Real-Time Location System (RTLS) to perform
physical posture classification (PPC) and indoor localization (IL). The performance of conventional machine
learning techniques such as Logistic Regression (LR) and Long Short-Term Memory (LSTM) models were
compared. The results demonstrated that LSTM models have superior performance in terms of accuracy and
robustness. The LSTM's efficacy stems from its ability to capture temporal dependencies inherent in human
activity data, making it suited for HAR tasks. Our findings underscored the benefits of employing a multi-
modal, LSTM-based approach for enhancing HAR. The proposed approach increased the comprehensiveness
of the HAR system. The proposed system holds potential for various in-home activity monitoring scenarios,
suggesting promising implications for improving the quality of remote patient monitoring.
1 INTRODUCTION
Recognizing the escalating significance of in-home
health monitoring systems is crucial in the
contemporary era, particularly in the aftermath of the
COVID-19 pandemic. In-home physical activity
monitoring systems, specifically, not only elevate
patient care quality but also provide an economical
solution for the healthcare industry (Schneider et al.,
2020). Potential advancements in these
telemonitoring systems could significantly transform
patient care and healthcare delivery, benefiting a
broad range of demographics (Teriö et al., 2022).
Over the past two decades, the landscape of
wearable technologies has undergone a dramatic
transformation. More recent developments have seen
a substantial increase in the quality and precision of
wearable devices while achieving reductions in size,
weight, battery consumption, and cost. Such
improvements have solidified the position of
wearable technology as the preferred choice for
telemonitoring applications (Huhn et al., 2022).
Wearable devices such as smartwatches, fitness
trackers, and actigraphy activity monitors, which
utilize MEMS accelerometers and gyroscopes, are
commonly used for in-home physical activity
monitoring. In addition, wireless ambient sensors,
such as those used for indoor localization (IL) (Cerón
& López, 2018) and passive infrared motion sensors
(Schütz et al., 2021), contribute to a comprehensive
understanding of activity patterns within the
household. The integration of these two modalities,
wearables, and wireless ambient sensors, enables a
detailed analysis of physical activity monitoring for
in-home human activity recognition (HAR) (Ann &
Theng, 2014). Uddin and Soylu developed a sensory-
based eldercare system specifically for HAR, aiming
to accurately classify twelve physical activities,
including standing still, sitting, lying down, climbing
stairs, bending, and more (Uddin & Soylu, 2021). On
the other hand, IL offers a means to track individuals'
locations, allowing for the monitoring of movement
patterns and gaining valuable insights into the
lifestyle and human behaviors (Shum et al., 2022).
There have been numerous studies on wearable or
IR-based HAR, but few have combined the two
modalities to create a more robust physical activity
recognition system. Hence, in this study, we present
a novel approach for HAR that combines data from
(i) a wearable wristband for physical posture
Torabi, S., Narimani, M. and Park, E.
Development of a Machine Learning Based in-Home Physical Activity Monitoring System Using Wrist Actigraphy and Real-Time Location System.
DOI: 10.5220/0012368000003657
Paper published under CC license (CC BY-NC-ND 4.0)
In Proceedings of the 17th International Joint Conference on Biomedical Engineering Systems and Technologies (BIOSTEC 2024) - Volume 1, pages 135-141
ISBN: 978-989-758-688-0; ISSN: 2184-4305
Proceedings Copyright © 2024 by SCITEPRESS – Science and Technology Publications, Lda.
135

classification (PPC) of standing, sitting, and lying;
and (ii) a Real-Time Location System (RTLS) for IL.
To enhance the performance of the proposed system,
a Long Short-Term Memory (LSTM) model
(Sherstinsky, 2020) was employed. This integration
of wearable sensors and RTLS data offers promising
results for advancing HAR methodologies. The
potential benefits of this approach include improving
in-home activity monitoring systems and exploring
tailored applications, such as facilitating aging-in-
place technologies for elderlies in the future.
2 MATERIALS AND METHODS
In this study, PPC and IL were employed to develop
our framework for improving the accuracy of HAR.
The selected activities for this study included routine
daily life tasks such as cooking, eating, sleeping, etc.
(see Table 1).
These activities provide a diverse dataset for our
analyses and were chosen due to their varying degrees
of movement patterns and complexity. Our approach
consists of several stages: initial preprocessing of the
data, feature selection, and the implementation of a
sequential model for classification. Each stage
contributes to the overall accuracy of our HAR
model.
2.1 Data Collection
The data used in this study were collected in a real
home setting in Vancouver, British Columbia,
Canada. All participants performed a set of
predefined tasks for approximately one hour. The ten
predefined activities listed in Table 1 were executed
by 10 healthy young adults (n = 10; 6 males and 4
females; mean body mass = 74.2 ± 18.4 kg; height
172.0 ± 10.3 cm, age = 24.0 ± 2.8 years) wearing an
actigraphy wristband for physical activity data
collection. Each participant completed all of the listed
activities once, ensuring that the dataset reflects a
complete set of single instances of each activity,
without repetitions. The activities were assigned in a
random order to each participant, ensuring
independence of each task and preventing any
sequence bias. This method mirrors the
unpredictability of daily activities, allowing for the
capture of a wide range of movements and postures.
In our dataset, we specifically focused on the
activities outlined in Table 1, and data from
transitional stages, such as transition between tasks
was excluded in the training of our LSTM model.
These transitional activities, such as moving from
cooking to eating a meal, were not considered as
distinct data points for training, ensuring a clear focus
on the primary activities of interest.
All participants signed an informed consent form,
and the experimental protocol was approved by the
Research Ethics Board of Simon Fraser University
(no. 30001370)
Table 1: Ten pre-defined physical activities performed by
participants during the experiment.
Human Activity
Description
Entering the house
(A1)
Opening the door and
entering the house
Cooking
(A2)
Standing in front of the stove
Eating at the dining table
(A3)
Sitting at the dining table
area
Washing hands
(A4)
Standing in front of the
bathroom sink to wash hands
Watching TV
(A5)
Sitting on the sofa to watch
TV
Using the toilet
(A6)
Sitting on the toilet
Using the washing machine
(A7)
Standing in front of the
washing machine
Using the dishwasher
(A8)
Standing in front of the
dishwasher
Working
(A9)
Sitting in working area
Sleeping
(A10)
Lying on the bed
2.2 Instrumentation
The data for this study were gathered from wearable
actigraphy using the ActiGraph GT9X Link
(ActiGraph LLC, Pensacola, FL) wristband, which
records high-resolution acceleration data from an
inertial measurement unit (IMU), and an ultra-
wideband (UWB) tag of an RTLS. The employed
RTLS was the Eliko indoor positioning system (Eliko
Tehnoloogia, Estonia), utilizing UWB technology to
track participants' locations within the home setting.
A total of six anchors were installed throughout the
house to cover its entire floor map (see Fig. 2). As
shown in Fig. 1, the RTLS’s tag was mounted on the
GT9X Link wristband, which was worn on the non-
dominant wrist, to make it easier for the participants
to perform the tasks.
BIODEVICES 2024 - 17th International Conference on Biomedical Electronics and Devices
136
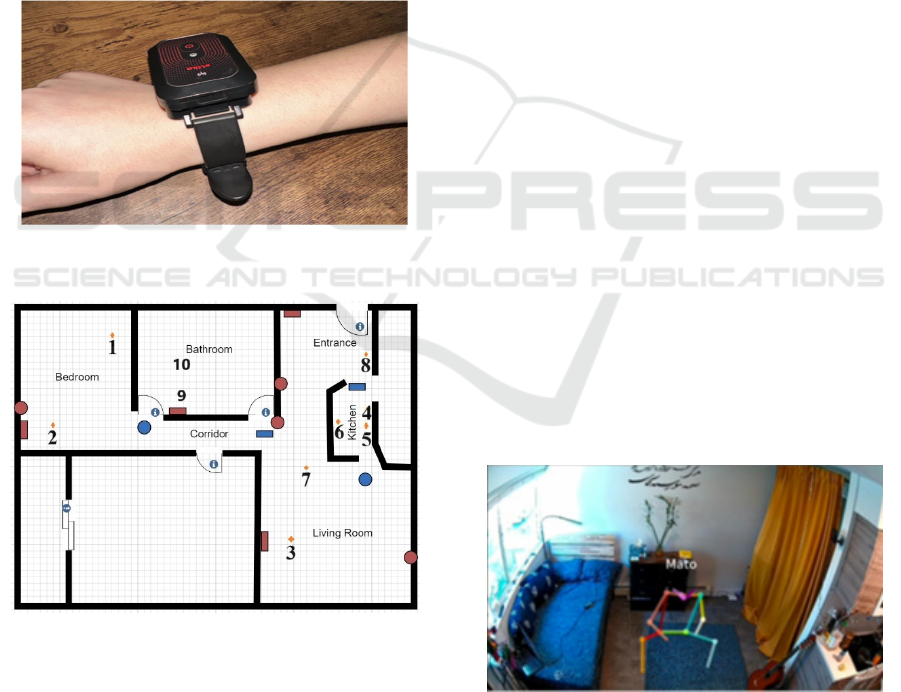
In addition, the AltumView Sentinare 2 camera
system (AltumView Ltd., Vancouver, BC) was
implemented for validation purposes. Instead of
capturing actual videos, it records stick figures of
participants for preserving their privacy (see Fig. 3).
This system was utilized for ground-truth data
labeling and validation.
In our data analysis process, we merged data from
the RTLS and ActiGraph Link, each having different
sampling rates (10 Hz for RTLS, 1 Hz for the Link,
and 100 Hz for the Link’s IMU). To synchronize
these datasets, we employed the Previous Value
Imputation method (Nakai & Ke, 2011), a technique
chosen to maintain the integrity of the original data
without introducing artificial patterns that
upsampling might cause. This approach was not to
address missing data but rather to align the datasets
with varying sampling rates.
Figure 1: The RTLS tag mounted on the GT9X Link
wristband worn by a participant.
Figure 2: Floor plan of the house where the dataset was
collected, showing RTLS’ anchors as rectangles and
Sentinare 2 cameras as circles. The red anchors and cameras
are wall-mounted, and the blue ones are ceiling-mounted.
The numbers represent the specific position: 1) bed, 2)
working desk, 3) sofa, 4) kitchen sink, 5) stove, 6)
dishwasher, 7) dining table, 8) washing machine, 9)
bathroom sink, 10) toilet.
2.3 Data Preparation and Feature
Selection
The collected dataset from the ten participants
consisted of 117,593 samples with 18 features,
including the tri-axial location and acceleration of the
tag; tri-axial acceleration, tri-axial angular velocity,
and tri-axial magnetic field strength of the Link’s
IMU as well as their Euclidean norms, represent the
magnitude of the vectors, calculated as the square root
of the sum of the squares of their components, from
the Gt9X Link.
In the development of a HAR model, we initially
standardized the features using the StandardScaler
from the preprocessing module of the Scikit-Learn
library (Pedregosa et al., 2011), ensuring all features
were on the same scale for precise predictions. We
then leveraged the Recursive Feature Elimination
with Cross-Validation (RFECV) from the Scikit-
Learn library’s feature selection module (Pedregosa
et al., 2011) for feature selection. This method,
utilizing a Random Forest Classifier (Geron, 2019),
ranks and methodically eliminates the least important
features until the optimal subset is found, thereby
maximizing the cross-validation score. With 5-fold
cross-validation and accuracy as the scoring metric,
RFECV was applied to the standardized training data,
identifying the eight most significant features for our
HAR model: tri-axial location data, X- and Z-axis
acceleration data, Y-axis angular velocity data, IMU
tri-axial acceleration magnitude data, and IMU tri-
axial magnetic field strength magnitude. This
approach mitigates the risk of overfitting by focusing
on the most informative features. During this feature
selection, each sample was treated as independent,
with the method focusing on the intrinsic
characteristics of the data without considering the
temporal relationships between samples.
Figure 3: A sample picture showing the output of the
Sentinare 2 camera system.
Furthermore, we favoured RFECV over
commonly used embedded methods like LASSO or
Development of a Machine Learning Based in-Home Physical Activity Monitoring System Using Wrist Actigraphy and Real-Time Location
System
137
SelectFromModel module from the Scikit-Learn
library (Pedregosa et al., 2011) due to its superior
consideration of feature correlations. RFECV’s
combination of feature ranking, recursive
elimination, and cross-validation yields a robust
model.
2.4 Implementing LSTM Model
Our study involved a sequence of sensor readings,
chronologically capturing human activity. This
sequential data requires a machine learning (ML)
model skilled in handling time-series inputs, leading
us to use the LSTM model. The LSTM's strength lies
in its memory function, which can reference not just
immediate past data but also distant information,
offering a potent advantage in predicting human
activities (Weng et al., 2021). Unlike conventional
algorithms, LSTM's capacity for managing time
dependencies makes it especially suited to human
daily activities.
The LSTM architecture was selected through a
rigorous grid search optimization process that
considered its performance across multiple
classification tasks, including general position,
specific position, PPC, and HAR, as detailed in Table
2. This uniform architecture was not an a priori
decision but the result of empirical testing, which
indicated that the two-layer, 64-unit configuration
consistently yielded superior results for all categories
of activity classification. It was observed that this
architecture effectively captured the essential
temporal features relevant to each classification
problem without overfitting, thereby providing a
standardized approach for the various ML methods
that were employed in our study. These LSTM layers
were followed by two dense layers for further
processing and decision-making. The first dense layer
consisted of 32 units using the ReLU activation
function, and the second dense layer used a softmax
activation function to yield probability distributions
across the different activity classes.
The choice of activation functions was also a
result of empirical evaluation. The ReLU function
was selected for the intermediate dense layer due to
its ability to speed up training convergence and
overcome issues related to the vanishing gradient
problem, which is particularly crucial in deep
sequential models like LSTMs. For the output layer,
the softmax function was chosen because it is well-
suited for multi-class classification tasks. It translates
the model's outputs into a probability distribution
over the predicted classes, making the results more
interpretable.
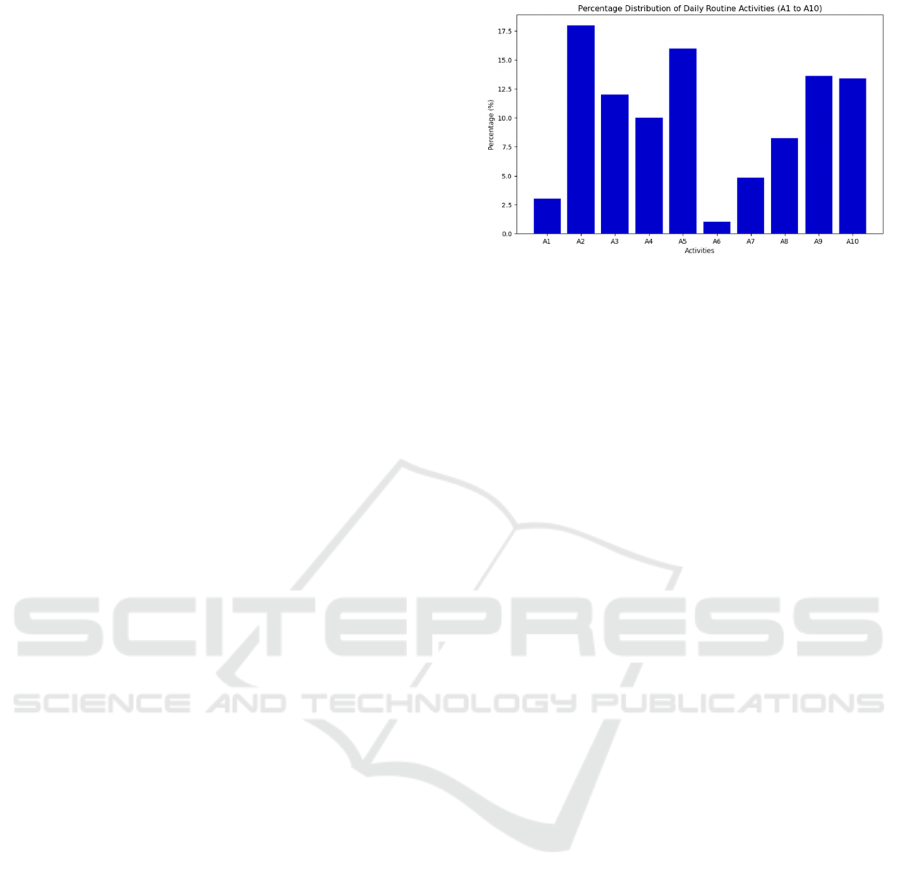
Figure 4: The distribution of activities on the combined
dataset.
The model compilation utilized the Adam
optimizer (Wang et al., 2019) and sparse categorical
cross-entropy as the loss function. The performance
metric used during the training was 'accuracy'. The
final LSTM model was trained over 100 epochs with
a batch size of 32, ensuring an optimal balance
between computational efficiency and the quality of
learning.
2.5 Creating True Labels
A manual annotation process was employed to label
the stick figure video footage captured by the camera
system to accurately identify the participant's general
location, specific position, and physical posture state.
General locations were determined by the room the
participant was in, such as the kitchen or bedroom.
Specific positions referred to areas within these
rooms, such as the bed in the bedroom or the stove
area in the kitchen. The procedure was executed by
inspecting the video recordings and manually noting
the pertinent activities at the corresponding
timestamps. The annotated data was synchronized
with dataset according to the time of recording,
ensuring a comprehensive and accurately labelled
dataset for the subsequent stages of our study.
3 RESULTS AND DISCUSSION
This section presents detailed analysis, highlighting
how LSTM surpasses traditional methods in
accurately classifying human activities. It reveals the
efficacy of our multi-modal LSTM-based model to
illuminate the complex relationships between
different components of HAR, such as general
location, specific position, and PPC.
Although the primary objective of our study is the
classification of HAR, as outlined in our
BIODEVICES 2024 - 17th International Conference on Biomedical Electronics and Devices
138

methodology, the accurate detection of the general
location, specific position, and PPC serves as
foundational elements in our framework.
Understanding the system's precision in determining
the location and basic postures is instrumental in
gauging the overall efficacy of our HAR framework.
These components are integral building blocks that
contribute significantly to the nuanced recognition of
human activities. Therefore, while our focus remains
on HAR, the analysis of general location and PPC
offers valuable insights into the comprehensiveness
and accuracy of our HAR framework.
An in-depth analysis was performed to evaluate the
performance of the proposed machine learning
framework for HAR. The evaluation utilized a leave-
one-subject-out cross-validation procedure (Kohavi,
1995), chosen for its ability to realistically assess the
model's generalization to unseen individuals, which is
crucial in real-world HAR applications. The
developed model's performance was assessed for IL,
PPC, and HAR tasks. To evaluate the performance of
the proposed model, accuracy was used as the
evaluation metric. However, given its limitations,
particularly in cases of class imbalance where it may
not reflect the model's performance accurately across
all classes, the F1 score was also utilized for a more
comprehensive assessment. This metric, balancing
precision and recall, is often used with unbalanced
datasets (Powers, 2020), as in this study (see Fig. 4).
The performance of the proposed LSTM model,
designed for handling sequential data with memory
cells, was compared with a variety of conventional
machine learning algorithms, including Random
Forest, Logistic Regression (LR), Gradient Boosting
(GB), Extreme Gradient Boosting (XGB), AdaBoost,
Support Vector Machine (SVM), K-Nearest
Neighbours (KNN), Gaussian Naive Bayes (GNB),
and Decision Tree (DT) (Chen & Guestrin, 2016 and
Geron, 2019). Each of these models was fine-tuned
using a grid search for hyperparameter optimization
to minimize cross-validation loss (Bergstra &
Bengio, 2012). Among the conventional machine
learning models, the LR model demonstrated the best
performance (see Fig. 5). For the LR model, a grid
search was performed to fine-tune hyperparameters
such as the regularization strength C (ranging from
0.01 to 100) and the penalty type (‘l1’ or ‘l2’), with
the optimal values identified as C=0.1 and 'l2' penalty
based on the minimization of cross-validation loss.
When comparing the results of the LR model with the
LSTM model, the LSTM model consistently
outperformed across all categories, as shown in
Table 2.
Table 2: Performance comparison between LSTM-based
and ML-based models for 10 Folds.
LSTM Model LR Based Model
Category Accuracy F1 Score Accuracy F1 Score
General
Location
97.25±0.01 97.75±0.03 96.72±0.06 96.93±0.05
Specific
Position
92.89±0.03 91.92±0.04 91.05±0.06 90.48±0.06
PPC 86.24±0.09 87.69±0.09 78.49±0.11 85.07±0.10
HAR 86.91±0.11 87.33±0.09 68.51±0.19 69.32±0.21
Table 3: Performance of the LSTM-based model with Non-
Integrated Data from Individual Sensors.
LSTM Model with Non-Integrated Data
Categories Accuracy F1 Score
PPC (IMU) 48.24±0.21 49.69±0.24
HAR (IL) 31.32±0.32 33.69±0.29
HAR (IMU) 37.21±0.30 38.22±0.28
The LSTM-based model displayed robust
performance across all categories. For the general
location, the LSTM model achieved an accuracy of
97.25% and an F1 score of 97.75%, which indicates a
high level of precision and recall. In detecting specific
positions, the model yielded an accuracy of 92.89%
and an F1 score of 91.92%. Regarding PPC, an
accuracy of 86.24% and an F1 score of 87.69% were
achieved. Finally, in the context of HAR, the model
achieved an accuracy of 86.91% and an F1 score of
87.33%.
Several factors may contribute to the superior
performance of the LSTM model. Firstly, LSTM
networks are adept at capturing temporal
dependencies, which are integral to the understanding
and classification of sequential data in HAR.
Consequently, these features lead to more accurate
and reliable HAR predictions.
Furthermore, the findings emphasize that
integrating IL with posture classification leads to a
significant improvement in the performance of HAR
and PPC, as indicated in Table 3. When considering
either IMU sensor data or RTLS features alone for
HAR or PPC, lower accuracy and F1 scores were
observed compared to the combined use of these
modalities. For instance, as shown in Table 3, when
utilizing only the IMU sensor's features, PPC
achieved an accuracy of 48.24% and an F1 score of
49.69%. Similarly, HAR exhibited an accuracy of
31.32% and an F1 score of 33.69% when solely using
IL features. On the other hand, employing solely IMU
sensor data for HAR resulted in an accuracy of
37.21% and an F1 score of 38.22%. These findings
Development of a Machine Learning Based in-Home Physical Activity Monitoring System Using Wrist Actigraphy and Real-Time Location
System
139
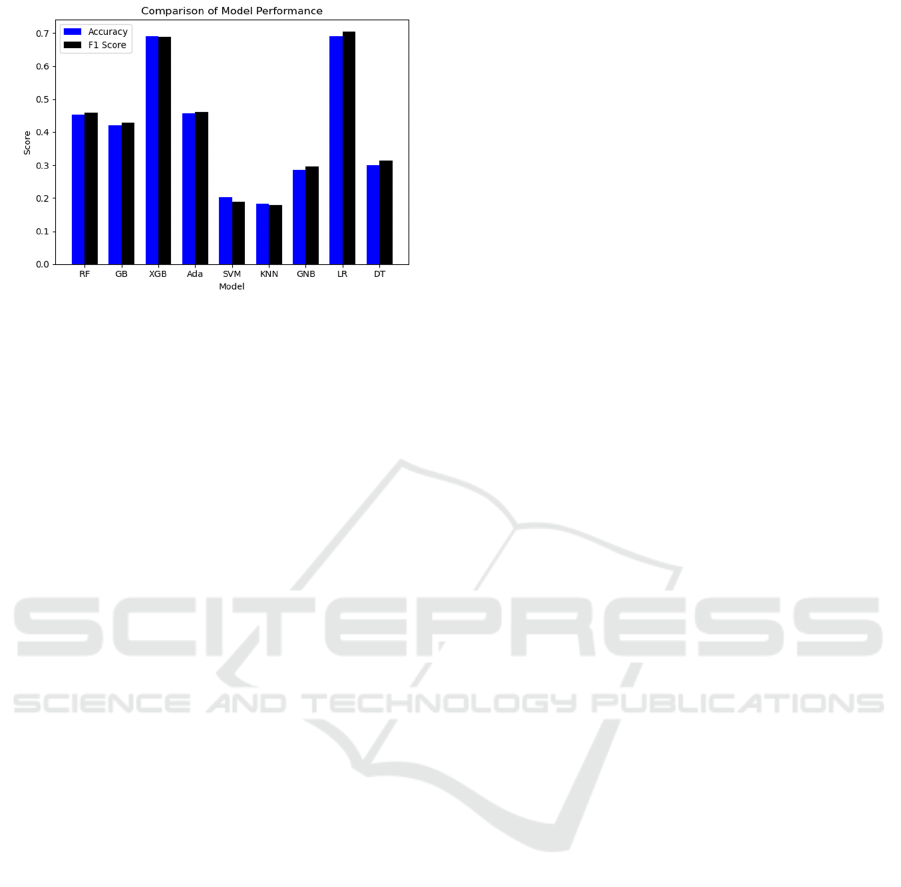
Figure 5: Accuracy and F1 score of each ML algorithm for
HAR.
showed the advantage of a multi-modal sensing
approach in improving HAR and PPC performances.
For the analysis with non-integrated data, we
ensured that the entire pipeline of analysis, including
standardization and feature selection, was
meticulously applied separately to the data from each
sensor before training the LSTM model. By applying
these steps independently to each sensor's data, we
aimed to assess the LSTM model's performance in
scenarios where data from only one sensor type was
available, thereby highlighting the benefits of our
multi-modal approach when all sensor data types are
integrated.
The superior performance of the multi-modal
sensing approach, as evidenced by our findings,
underscores a pivotal aspect of HAR – the necessity
of capturing a comprehensive dataset that accounts
for both spatial and temporal dynamics of human
movements. The contrast in performance metrics
between single-mode and integrated data analysis
highlights the limitation of relying on isolated sensor
inputs. It demonstrates that individual sensor
modalities, while informative in their own right, may
not fully capture the complexity of human activities.
The integration of IL and IMU sensor data
complements the limitations of each modality. This
integrative approach mirrors the multifaceted nature
of human movements and provides a more accurate
representation of real-world scenarios.
4 CONCLUSIONS
In this paper, the feasibility of accurate HAR through
the integration of data taken from a wearable
actigraphy wristband and an RTLS was investigated.
The results affirm the efficacy of integrating location
features with posture features, resulting in enhanced
performance for both PPC and HAR. It was shown
that the proposed LSTM-based model outperformed
conventional machine learning methods, with higher
accuracies across all categories. Its superiority stems
from its ability to capture temporal dependencies in
HAR data. To improve the performance of the
proposed system, future work will aim to refine the
LSTM model and explore the effectiveness of our
approach for specific demographics, such as in senior
care, where accurate HAR can be particularly
beneficial.
REFERENCES
Schneider, J. E., Cooper, J., Scheibling, C., & Parikh, A.
(2020). Economic evaluation of passive monitoring
technology for seniors. Aging Clinical and
Experimental Research, 32(7), 1375–1382.
Teriö, M., Pérez-Rodríguez, R., Guevara Guevara, T.,
Valdes-Aragonés, M., Kornevs, M., Bjälevik-Chronan,
S., Taloyan, M., Meijer, S., & Guidetti, S. (2022).
Preventing frailty with the support of a home-
monitoring and communication platform among older
adults-a study protocol for a randomised-controlled
pilot study in Sweden. Pilot and Feasibility Studies,
8(1), 190.
Huhn, S., Axt, M., Gunga, H.-C., Maggioni, M. A., Munga,
S., Obor, D., Sié, A., Boudo, V., Bunker, A., Sauerborn,
R., Bärnighausen, T., & Barteit, S. (2022). The Impact
of Wearable Technologies in Health Research: Scoping
Review. JMIR mHealth and uHealth, 10(1), e34384.
Cerón, J., & López, D. M. (2018). Human Activity
Recognition Supported on Indoor Localization: A
Systematic Review. Studies in Health Technology and
Informatics, 249, 93–101.
Schütz, N., Saner, H., Botros, A., Buluschek, P., Urwyler,
P., Müri, R. M., & Nef, T. (2021). Wearable Based
Calibration of Contactless In-home Motion Sensors for
Physical Activity Monitoring in Community-Dwelling
Older Adults. Frontiers in Digital Health, 2, 566595.
Ann, O. C., & Theng, L. B. (2014). Human activity
recognition: A review. 2014 IEEE International
Conference on Control System, Computing and
Engineering (ICCSCE 2014), 389–393.
Uddin, M. Z., & Soylu, A. (2021). Human activity
recognition using wearable sensors, discriminant
analysis, and long short-term memory-based neural
structured learning. Scientific Reports, 11(1), 16455.
Shum, L. C., Faieghi, R., Borsook, T., Faruk, T., Kassam,
S., Nabavi, H., Spasojevic, S., Tung, J., Khan, S. S., &
Iaboni, A. (2022). Indoor Location Data for Tracking
Human Behaviours: A Scoping Review. Sensors
(Basel, Switzerland), 22(3), 1220.
Sherstinsky, A. (2020). Fundamentals of Recurrent Neural
Network (RNN) and Long Short-Term Memory
(LSTM) Network. Physica D: Nonlinear Phenomena,
404, 132306.
BIODEVICES 2024 - 17th International Conference on Biomedical Electronics and Devices
140

Nakai, M., & Ke, W. (2011). Review of the Methods for
Handling Missing Data in Longitudinal Data Analysis.
Journal of Math. Analysis, 5, 1–13.
Pedregosa, F., Varoquaux, G., Gramfort, A., Michel, V.,
Thirion, B., Grisel, O., Blondel, M., Prettenhofer, P.,
Weiss, R., Dubourg, V., Vanderplas, J., Passos, A.,
Cournapeau, D., Brucher, M., Perrot, M., & Duchesnay,
É. (2011). Scikit-learn: Machine Learning in Python.
Journal of Machine Learning Research, 12(85), 2825–
2830.
Geron, A. (2019). Hands-on machine learning with Scikit-
Learn, Keras, and TensorFlow: Concepts, tools, and
techniques to build intelligent systems (Second
edition.). O’Reilly.
Weng, Z., Li, W., & Jin, Z. (2021). Human activity
prediction using saliency-aware motion enhancement
and weighted LSTM network. EURASIP Journal on
Image and Video Processing, 2021(1), 3.
Wang, Y., Liu, J., Mišić, J., Mišić, V. B., Lv, S., & Chang,
X. (2019). Assessing Optimizer Impact on DNN Model
Sensitivity to Adversarial Examples. IEEE Access, 7,
152766–152776.
Kohavi, R. (1995). A study of cross-validation and
bootstrap for accuracy estimation and model selection.
Proceedings of the 14th International Joint Conference
on Artificial Intelligence - Volume 2, 1137–1143.
Powers, D. M. W. (2020). Evaluation: From precision,
recall and F-measure to ROC, informedness,
markedness and correlation (arXiv:2010.16061).
arXiv.
Chen, T., & Guestrin, C. (2016). XGBoost: A Scalable Tree
Boosting System. Proceedings of the 22nd ACM
SIGKDD International Conference on Knowledge
Discovery and Data Mining, 785–794.
Bergstra, J., & Bengio, Y. (2012). Random search for
hyper-parameter optimization. The Journal of Machine
Learning Research, 13(null), 281–305.
Development of a Machine Learning Based in-Home Physical Activity Monitoring System Using Wrist Actigraphy and Real-Time Location
System
141
