
Identification of Patient Ventilator Asynchrony in Physiological Data
Through Integrating Machine-Learning
Anthony J. Stell
1a
, Ernesto C. Caparo
1b
, Zhe Wang
1c
, Chenyang Wang
1d
,
David J. Berlowitz
2e
, Mark E. Howard
3f
, Richard O. Sinnott
1g
and Uwe Aickelin
1h
1
School of Computing and Information Systems, University of Melbourne, 700 Swanston Street, Melbourne, Australia
2
Institute of Breathing and Sleep, Austin Hospital, 145 Studley Road, Heidelberg, Australia
3
Austin Health, 145 Studley Road, Heidelberg, Australia
chenyangwang3@student.unimelb.edu.au, {david.berlowitz, mark.howard}@austin.org.au
Keywords: Patient Ventilator Asynchrony, Machine-Learning, European Data Format (EDF).
Abstract: Patient Ventilator Asynchrony (PVA) occurs where a mechanical ventilator aiding a patient's breathing falls
out of synchronisation with their breathing pattern. This de-synchronisation may cause patient distress and
can lead to long-term negative clinical outcomes. Research into the causes and possible mitigations of PVA
is currently conducted by clinical domain experts using manual methods, such as parsing entire sleep
hypnograms visually, and identifying and tagging instances of PVA that they find. This process is very labour-
intensive and can be error prone. This project aims to make this analysis more efficient, by using machine-
learning approaches to automatically parse, classify, and suggest instances of PVA for ultimate confirmation
by domain experts. The solution has been developed based on a retrospective dataset of intervention and
control patients that were recruited to a non-invasive ventilation study. This achieves a specificity metric of
over 90%. This paper describes the process of integrating the output of the machine learning into the bedside
clinical monitoring system for production use in anticipation of a future clinical trial.
1 INTRODUCTION
Patient Ventilator Asynchrony (PVA) occurs where a
mechanical ventilator assisting a patient's breathing
falls out of synchronisation with their intrinsic
breathing pattern. This de-synchronisation may result
in patient discomfort and can lead to long-term
negative clinical outcomes. Three types of PVA that
have been demonstrated to impact on a patients
during non-invasive ventilation (NIV): 1) ineffective
effort - where the patient tries to take a breath, but this
effort fails to register with the ventilator, and it does
not provide the necessary support; 2) autocycle – a
small period of volatility where the patient takes
a
https://orcid.org/0000-0003-4819-9883
b
https://orcid.org/0009-0003-7499-0369
c
https://orcid.org/0000-0001-6054-6468
d
https://orcid.org/0000-0003-3217-1122
e
https://orcid.org/0000-0003-2543-8722
f
https://orcid.org/0000-0001-7772-1496
g
https://orcid.org/0000-0001-5998-222X
h
https://orcid.org/0000-0002-2679-2275
several breaths in quick succession and the ventilator
fails to respond to the rapid behaviour; 3) double
trigger - where the patient has taken two breaths, one
of which the ventilator fails to register (Hannan et al,
2019).
It has been shown that frequent PVA events
during both invasive- and non-invasive ventilation
can lead to many adverse consequences for a patient,
ranging from reduced sleep quality to more serious
outcomes such as lung injury, and an increased ICU
and hospital mortality rate (Brochard et al, 2014). It
is a significant burden on a variety of different patient
cohorts, such as those with specific conditions like
motor neuron disease (MND) or obesity
436
Stell, A., Caparo, E., Wang, Z., Wang, C., Berlowitz, D., Howard, M., Sinnott, R. and Aickelin, U.
Identification of Patient Ventilator Asynchrony in Physiological Data Through Integrating Machine-Learning.
DOI: 10.5220/0012366700003657
Paper published under CC license (CC BY-NC-ND 4.0)
In Proceedings of the 17th International Joint Conference on Biomedical Engineering Systems and Technologies (BIOSTEC 2024) - Volume 2, pages 436-443
ISBN: 978-989-758-688-0; ISSN: 2184-4305
Proceedings Copyright © 2024 by SCITEPRESS – Science and Technology Publications, Lda.

hypoventilation syndrome (OHS), but also severely
affecting those with more general chronic respiratory
failure. This group forms a significant percentage of
the global population.
Current practice to research and understand PVA
events includes clinical domain experts manually
assessing entire sleep hypnograms, along with
electroencephalogram (EEG) and physiological
output channels. For a single patient stay, this is often
of the order of several hours of data, with a resolution
of nanoseconds in some instances. The identification
of PVA events such as ineffective efforts, requires a
combination analysis of (for instance) the mask
pressure output (“pmask”) channel along with signs
of volatility in the EEG.
Technology used to tackle such problems at
present includes integrated tools, which present all
the information in one visual space that is convenient
and optimised for clinical use. An example of this is
the use of the CompuMedics sleep monitoring
software (Compumedics ProFusion, Abbotsford
Australia) that directly connects to the output from
the ventilator. However, despite the presence of this
integrated solution, given the relative frequency of
events against the time resolution described, this
process is highly labour-intensive and prone to error.
With recent advances in artificial intelligence and
machine-learning, it is clearly a process that would
benefit from automated optimisation. Therefore, this
project aims to integrate a machine-learning
algorithm that can automate the process of PVA
detection and provide clinical decision-support in the
form of suggestions of PVA event labels. These can
then be confirmed or rejected by the clinical domain
experts.
Several challenges in this work exist, which form
the basis of this paper. They include:
• integration of all data channels in an open
format supporting proprietary software such
as CompuMedics;
• reliance on hardware-accelerated processors
to fully exploit machine-learning algorithms;
• the need for specialist software libraries;
• the need to maximise memory efficiency when
choosing the software environment and
deciding on the system architecture;
• time-sampling factors such as down-sampling
of the machine learning output and the unit
choices of the EDF file specification, and
finally,
• the choice of presentation combined with the
operation of the algorithm to maximise the
utility for the clinical end-users.
2 BACKGROUND LITERATURE
Two interdisciplinary work threads have combined to
lead to the development of this work: one clinical and
the other from information and data science. The
clinical arm of this interdisciplinary group provided
the basis for this work through a randomised-
controlled trial that they had conducted previously,
where NIV was titrated with nocturnal
polysomnography (one of the first ever controlled
trials of this intervention) (Hannan, et al, 2019). One
of the primary findings of this study was that
polysomnography assisted optimization NIV titration
resulted in increased NIV usage (hours per night), and
an association was observed between fewer PVA
events and increased usage. In certain patient cohorts,
such as those living with motor neurone disease,
cohort evidence suggests that increased usage
(adherence to therapy) leads to a significant increase
in long-term survival (Berlowitz, et al, 2021).
2.1 PVA and NIV
Some independent software solutions to the issue of
detecting and mitigating PVA have been proposed
(Dres et al, 2021), but there is a general lack of
validation for these approaches and they still require
intensive effort to fully implement. Other studies
have focused on the storage of raw data on a long-
term basis (Janssens et al., 2015; Rabec et al., 2009)
but without estimations of signals and interpretation,
the utility of these tools have also yet to be
determined. This leads to an opportunity to explore
algorithmically-centered solutions integrated with
targeted software modules (as presented here).
Non-invasive ventilation (NIV) is a therapeutic
method used to provide respiratory support to
individuals with breathing difficulties without the
need for invasive procedures such as endotracheal
intubation. It delivers positive airway pressure to help
keep the airways open and assist with breathing. It
typically involves continuous monitoring to assess the
effectiveness and the patient’s response to treatment.
There are different techniques used for NIV
monitoring including capnography, which monitors
patient's exhaled carbon dioxide (CO2) levels.
A unique way of monitoring that captures the
interaction of patient and ventilator during nocturnal
use is polygraphy or polysomnography (PSG). It is
used in the context of sleep-related disorders, where
NIV can be titrated and monitored using
polysomnography. While ventilators normally only
provide readings such as mask pressure, PSG can
record various physiological parameters including
Identification of Patient Ventilator Asynchrony in Physiological Data Through Integrating Machine-Learning
437

airflow, chest and abdominal movement (Gao, et al,
2021). Such data can help identify and classify PVA
events including Ineffective Effort (IE), Double
Trigger (DT) and Autocycle (AC).
A randomised controlled trial conducted by
(Hannan et al, 2019) suggested that using PSG to
titrate NIV therapy can lead to better alignment
between the patient's breathing patterns and the
ventilator's settings, but it may not reduce sleep
disruption. The data collected in this trial comprised
information from a cohort of 58 participants,
primarily individuals diagnosed with neuromuscular
disorders, all of whom were receiving NIV support
including the use of PSG titration.
2.2 Machine-Learning Approaches
A key unique aspect of the clinical work outlined in
this paper is that it has been performed during non-
invasive ventilation. This is a novel and ground-
breaking approach. Previous attempts at PVA
detection by other groups have always been
performed during invasive ventilation, usually in an
intensive care-unit. Therefore, when comparing
against other ML approaches to PVA detection, in the
invasive ventilation situation the available signals are
easier to detect as the system is closed, not open, and
thus inherently less noisy. It is in this context that
other ML approaches should be considered.
Zhang et al. (2020) proposed a novel method
using a two-layer neural network to detect the most
frequent types of PVA, resulting in the detection of
double triggering (DT) and ineffective inspiratory
effort (IIE). According to the study, it was shown that
ML-based approaches based on a robust database
(159 patients were included) could assist in PVA
recognition for clinicians.
Adams et al. (2017) explored the ventMAP
platform with focus on types of double-trigger and
breath stacking PVA. The algorithm proposed was
rule-based, using pressure and airflow signals,
including both a derivation and a validation cohort.
They obtained a performance of 92.2-97.7% on the
validation cohort. The algorithm helped in detecting
harmful forms of off-target ventilation in critical
patients.
The method developed by (Bakkes et al., 2020)
provided new insights for PVA. The study conducted
showed that the algorithm could detect and classify
types of PVA obtaining a precision average of 97.7%.
However, the study also emphasised the need for
inclusion of different network architectures to address
the necessary robustness of detection methods. It
should be noted that both algorithms (Adams et al.,
2017; Bakkes et al., 2020) faced different challenges
related to the data collection. Data labelling in the
(Bakkes et al, 2020) study was made by one expert
only, which led to an increase in the error margin of
the results. The platform ventMAP was capable of
obtaining a robust amount of data, however when
conducting the development and translation of the
output data into clinical applications, there were a
wide range of implementation issues (Adams et al.,
2017).
Another approach in the PVA field has been the
use of ensemble machine learning classifiers, e.g.,
(Rehm et al., 2018). The results suggest that high-
performing ML-based models are capable of
producing well-specified outputs despite the presence
of clinical artefacts. Therefore, the methodology used
serves as a helpful framework to guide classification
of such events.
3 METHODOLOGY
Considering the range of methods in the area, the use
of a data-driven approach has been embraced. (Wang
et al., 2022) proposed the use of several similarity and
randomness measures. This approach underpins this
paper, and specifically using variants of the matrix
profile (MP) algorithm. They achieved encouraging
results for detecting suspected PVA with a high
percentage test recall (90%+) among the reported
outputs. As a potential improvement on this
technique, the extension of similarity-based methods
to supervised nearest-neighbour search and including
techniques for ineffective effort detection has also
been considered here.
3.1 ML Algorithm
We extend Wang’s work (Wang et al, 2022) using an
algorithm that detects contiguous repeating patterns
in signals even with rhythm changes. This allows for
detection of abnormal changes, as well as
segmentation and feature analysis of the signals.
Follow-up models based on this algorithm have been
trained on an annotated non-invasive ventilation
waveform dataset, which gives a specificity and
sensitivity of over 90% in the context of detecting
auto-triggering events from noisy waveform data.
In the first instance, the practical measure of the
ML metric is simply the scalar number value
representing how volatile the different input channels
are (therefore, it is likely that a PVA event occurs near
a spike in the ML metric). However, a further future
refinement to this is to analyse the shape of the ML
HEALTHINF 2024 - 17th International Conference on Health Informatics
438

output and classify the type of anomaly based on that
shape.
The automated method to flag the anomalous
output is also based on several channels rather than
manually aligning and determining a PVA presence
based on the disjoint evaluation of each, which is
necessary when conducting the inspection manually.
The four primary channels used in the work are the
pressure mask (pmask), abdominal (abdo) and
thoracic (thor) respiratory inductance bands, and flow
as output form the NIV device (flow-tx). This multiple
channel feature is particularly useful in cases such as
ineffective efforts, which would not necessarily show
up on a single channel but could still be present.
3.2 Software Implementation
To integrate the output for the machine-learning
algorithm, an open-source format – the European
Data Format (EDF) specification (www.edfplus.info)
– has been chosen for data representation and
manipulation, not only because of the standardised
structure and well-supported open-source
community, but also to allow the portability of the
output across different platforms. This open format
supports the extraction in a standardised structure –
of both scored labels and free-text comments, which
have been added manually into the integrated bedside
system. It enforces a degree of structure on data
offering critical contextual data during a monitored
patient sleep. Such data is usually openly structured
and difficult to report in a standard way. Both scored
labels and free text annotations also present a
heterogeneity challenge in that there is no
standardized input approach. This effect is amplified
when there is more than one clinician involved in data
entry.
Therefore, the first step in producing the EDF file
with additional ML-output channel, is to extract the
original EDF file from the integrated bedside clinical
monitoring system, in this case CompuMedics, with
one EDF file per patient per stay. The meta-data
outlining the annotations accompanying that patient
stay are captured in the associated XML descriptor
file.
Once the original EDF has been extracted, the full
data integrity of that file is checked and written to
another newly created EDF file. This new file is
composed of the original physiological channels
chosen by the user with the addition of new channels
containing the ML-generated output.
This is achieved using the python library pyedflib,
which is a fork from the library EDFlib
(www.teuniz.net). These libraries are used to read the
EDF file’s properties and values including: number of
signals, channel indexes, sample frequency, and
number of data records. The physiological channels
are then read into this library for pre-processing, in
anticipation of processing by the ML algorithm. For
ease of persistent data storage, and to ease the burden
of volatile memory requirements, intermediate files
are written as part of these pre-processing steps.
These are stored in the Apache Parquet file format
(parquet.apache.org) - an open source, column-
oriented data file format, which uses in-built
compression for efficient data storage and retrieval.
The output of the parquet files is then fed into the
ML algorithm. The operation of the algorithm
involves many dependencies in both software and
hardware including:
• A memory-efficient version of the Anaconda
Python environment, known as MambaForge
(mamba.readthedocs.io), which provides a
setting that maximises the available underlying
memory to run the memory-intensive ML
algorithm.
• A library called Signatory that allows the
calculation of a “signature transform”, an
operation roughly analogous to a Fourier
transform that extracts information on the order
and area of a given data stream.
• Underlying GPU acceleration at a hardware
level, requiring the activation of an NVIDIA
processor (if available). In this project the Azure
cloud resource provides a VM within the “NC
series” that provides an NVIDIA GeForce RTX
3090 chip with 24 GiB
Using this software stack, once the algorithm is
fully computed, it is stored in a multi-dimensional
numpy array type, which the EDF file format and
libraries use heavily for functional operation. An
anomaly list is successively generated from the
numpy array, and this list is iterated over to produce a
sub-set of values where the ML metric has gone over
a user-supplied threshold number. This new subset
array is written to the same output EDF file but in the
form of point annotations.
In terms of timing, for each down-sampled
window, a corresponding value is produced
(measured in the arbitrary units of “ML-P”), along
with a corresponding timing value. This timing value
can be configured to be situated in the window at the
beginning (value 0), the end (value 1), the middle
(value 0.5), or any point in between. Due to the down-
sampling of the output by a factor of 16, the ML
output is rendered at a sample frequency of 2 Hz,
when combined with the pmask output in the final
Identification of Patient Ventilator Asynchrony in Physiological Data Through Integrating Machine-Learning
439

EDF. This is due to the pmask output having a
frequency of 32 Hz (so when divided by 16, the final
frequency is 2 Hz). This output is written to the final
EDF using a pre-prepared buffer array of double
values, written to the file at repeat intervals governed
by that sample frequency. The sample frequency
itself varies according to channel and this is set at the
original point of first extraction of that channel from
the bedside system.
The EDF file itself is then rendered using open-
source tools that are freely available, again mainly
supported by the work of Teuniz van Beelen
(www.teuniz.net). The most popular option is
EDFBrowser, which provides standard tools to
operate and manipulate EDF files, such as varying
timescale, amplitude, window, and video
playback/recording. EDFBrowser is not entirely
portable across the main consumer operating
systems – for instance, installation on MacOS
requires detailed configuration that is a non-trivial
task for an average computer user. Therefore, an
alternative is the Polyman application
(sites.google.com/view/diegoalvarezestevez/projects
/polyman), which has similar tools but less visual
depth when rendering.
4 RESULTS
The presentation of the ML output was rendered
using EDFBrowser (figures 1 and 2).
Figure 1 shows the overall output when compared
between the machine-learning output (the green line)
and the entire output of a pmask channel for a 9.5 hour
patient stay (the yellow line, solid due to the high
resolution viewed from overall timepoint).
As can be seen, the highest points in the ML
output correspond to the largest variations in the
overall output of the pmask channel. In physical
terms, this most likely relates to the initial period
where the mask was not yet fitted to the patient, and
a period of adjustment that occurred midway through
the sleep.
From a clinical perspective, it is often the case that
the smaller, more subtle, variations in the ML output
are more useful. These are the “needle in a haystack”
points that the application is being used to identify,
rather than the large-scale volatility that can be most
easily seen on first viewing (though this helps to
validate that the ML output is in fact correctly
reflecting a valid physiological output). Therefore,
Figure 2 shows how the ML output looks when
compared against individual events in the
physiological channel, in this case one of the primary
PVA events: an ineffective effort.
Figure 2 also shows the annotations that are also
included in the output EDF file. These include a
combination of the threshold crossing notes (a
threshold of 4 was chosen for this exploration), as
well as the scored labels and free-text comments
extracted from the original EDF file. The high
number of these mean that the filtering tools available
through EDFBrowser needs to be used to
meaningfully navigate the EDF file and identify
points of interest in the readout (in EDFBrowser, the
list on the right of the window interactively
corresponds to the dashed line markers that span both
outputs).
5 DISCUSSION
There were a variety of issues that were encountered
when attempting to bring this implementation to a
production level. Many of those issues were due to
the interactions between uniquely-specified software
and hardware requirements that often led to
unpredictable interactions.
The Signatory library could only be run reliably
when executed on the Linux Ubuntu 22.04 operating
system. Portability across other operating systems
could not be guaranteed due, for instance, due to the
incompatibility with the Clang C-compiler, which
ships as standard on most MacOS versions.
Similarly, the Conda (Anaconda) Python
environment was required to set up and run the
dependency list to support the requirements for the
machine learning solution. However, due to the
extensive memory requirements, the larger scale
MambaForge environment was required. There are a
variety of flavours of this environment, which again
constrained the stack upon which the execution could
be performed.
The Pytorch library version – required to support
the complex functions of the Signatory library -
varied depending on whether the GPU or CPU
environment was available for execution. This
variation in itself created conflicting dependency and
version issues, which would need to be tightly
controlled before run-time, due to the need to
understand the particular hardware environment.
Overall, these issues could be grouped as the
requirement of pinned software versions along with
libraries without consolidated community support,
which is often a necessary feature of leading-edge
research.
HEALTHINF 2024 - 17th International Conference on Health Informatics
440
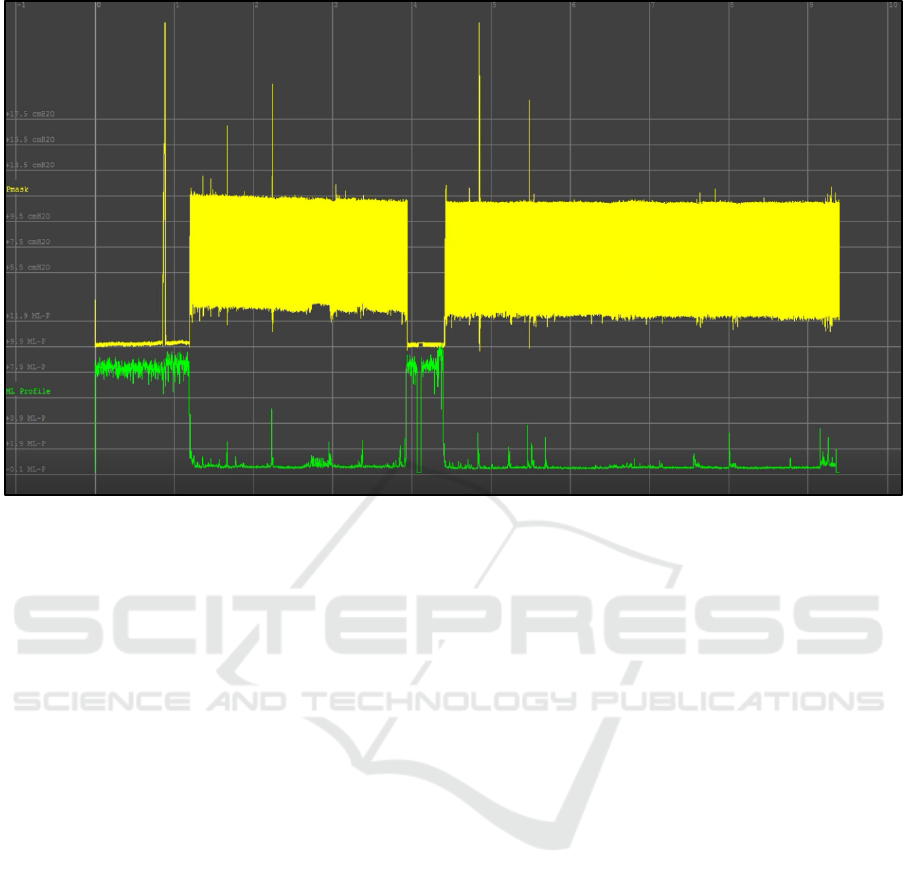
Figure 1: Overall monitored patient sleep, covering 9.5 hours. The large periods of volatility in the ML output (green)
correspond to aspects of the physiological output (yellow) which are highly differentiated from the majority of that output.
GPU requirements were also extensive, with a
minimum benchmark of 24 GiB in the “NC series” of
Azure VMs, required to execute the application on an
NVIDIA GeForce RTX 3090 processor. This was
required so that the calculation could be run over a
feasible timescale. There was a batch_size variable,
specifying the size of batches of data for processing,
which acted as an in-code handle and supported the
calculation accuracy and controlled the execution
time. But when this went over 10^6 (the minimum
requirement for sufficient accuracy), the calculation
time began to run to hours on a regular CPU platform.
However, again these are considerations that are
not uncommon in advanced ML approaches and will
inevitably become less problematic as processor
powers increase and execution speeds decrease. This
also has an impact on the cost-effectiveness of the
solution, e.g., does the cost of using such high-end
resources outweigh the cost of employing skilled
workers to manually detect PVA, and at what is the
trade off in accuracy? Such a cost-benefit exercise
would be a next logical step in evaluation of this
technology, repeated at various time intervals as the
underlying hardware improves.
Output timings were also a factor that require
further consideration. Due to the down-sampling of
output windows, some manipulation of the annotation
and ML output points was required, with a “stretching
factor” of 1.97 eventually settled upon. This was also
reflected in clinician feedback, where the annotation
indicating threshold crossing did not directly line up
with the corresponding point in the physiological
output, but rather it occupied a window, pre-
determined by the down-sampling rate. Though a
concern, it was noted that time was only one of
several factors that may have had an impact on the
system stability. Other factors such as the topography
of the ML output may influence the readout and allow
a classification of the type and presence of a given
instability. This could also help in identifying low-
resolution events, not immediately drawn out when
considering timing alone.
Finally, the idea of optimal presentation should be
considered. To express the output in the open-source
EDF format was a deliberate choice to promote
portability and accessibility. When taken to further
validation and downstream studies, the user-interface
considerations should be evaluated, and would
ultimately likely compete in terms of integration with
the in-situ bedside monitoring systems. If this
requires direct integration with the software vendor
solution this could become a block to further
development unless intellectual property and
collaborative agreements are negotiated.
Identification of Patient Ventilator Asynchrony in Physiological Data Through Integrating Machine-Learning
441
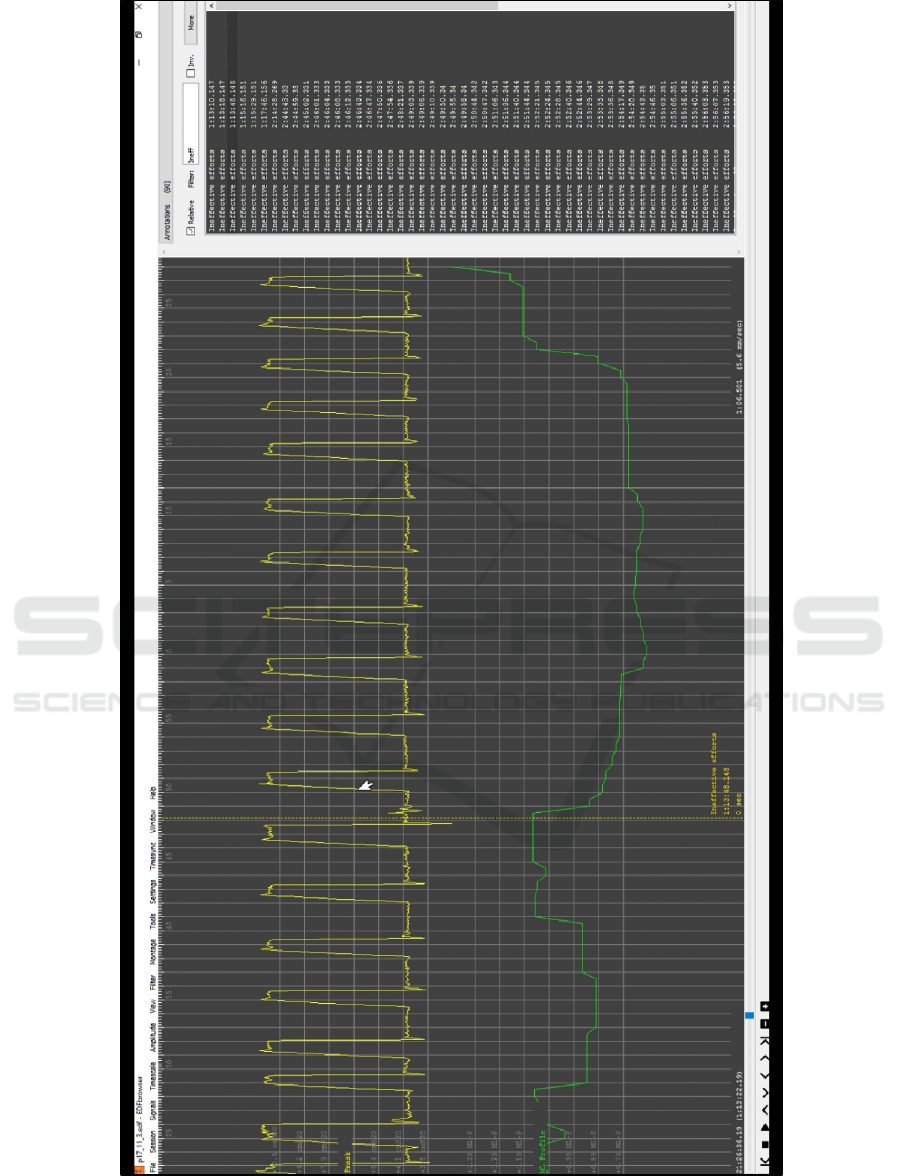
Figure 2: This shows an example event of interest (an ineffective effort). The ML output corresponds to a higher-than-normal
spike in volatility, and the broken vertical line indicates that the annotation lining up in time with an effort that failed to
register and receive the necessary support.
HEALTHINF 2024 - 17th International Conference on Health Informatics
442

6 CONCLUSIONS
In this paper, the implementation details of the
integration of a machine-learning algorithm to detect
PVA events, into a production version of a bedside
clinical environment has been presented. The
functional operation has been shown demonstrating
how the automated detection of ineffective efforts,
autocycles and double triggers can be achieved. We
also discuss the challenges encountered during the
work.
ACKNOWLEDGEMENTS
The authors would like to acknowledge the work of
Liam Hannan et al in providing the comprehensive
dataset upon which this work builds.
REFERENCES
Brochard L. et al, Measurement of esophageal pressure at
bedside: pros and cons. Curr Opin Crit Care 2014;
20:39–46
Martin Dres, Nuttapol Rittayamai b, Laurent Brochard
(2016). Monitoring patient–ventilator asynchrony
Candelaria de Haro, et al. (2018) Patient-ventilator
asynchronies during mechanical ventilation: current
knowledge and research priorities
Jean-Paul Janssens, Jean-Christian Bore, Jean-Louis
Pe´pin. (2015). Nocturnal monitoring of home non-
invasive ventilation: the contribution of simple tools
such as pulse oximetry, capnography, built-in ventilator
software and autonomic markers of sleep fragmentation
Rabec C, Georges M, Kabeya NK, et al. Evaluating
noninvasive ventilation using a monitoring system
coupled to a ventilator: a bench-to-bedside study. Eur
Respir J 2009;34:902e13
Lingwei Zhang et al. (2020) Detection of patient-ventilator
asynchrony from mechanical ventilation waveforms
using a two-layer long short-term memory neural
network.
Adams JY, Lieng MK, Kuhn BT, Rehm GB, Guo EC,
Taylor SL, Delplanque JP, Anderson NR (2017)
Development and validation of a multi-algorithm
analytic platform to detect off-target mechanical
ventilation. Sci Rep 7:14980
Bakkes, T. H., Montree, R. J., Mischi, M., Mojoli, F., &
Turco, S. (2020, July). A machine learning method for
automatic detection and classification of patient-
ventilator asynchrony. In 2020 42nd Annual
International Conference of the IEEE Engineering in
Medicine & Biology Society (EMBC) (pp. 150-153).
IEEE.
Wang, C., Aickelin, U., Luo, L., Ristanoski, G., Howard,
M. E., & Berlowitz, D. (2022). Patient-ventilator
asynchrony detection via similarity search methods.
Journal of Advances in Information Technology Vol,
13(1).
Rehm, G. B., Han, J., Kuhn, B. T., Delplanque, J. P.,
Anderson, N. R., Adams, J. Y., & Chuah, C. N. (2018).
Creation of a robust and generalizable machine learning
classifier for patient ventilator asynchrony. Methods of
information in medicine, 57(04), 208-219.
Berlowitz DJ, Sheers N. Not Only about the Drugs:
Improved Survival with Noninvasive Ventilation in
Amyotrophic Lateral Sclerosis. Ann Am Thorac Soc.
2021 Mar;18(3):419-420
Hannan LM, Rautela L, Berlowitz DJ, et al. Randomised
controlled trial of polysomnographic titration of
noninvasive ventilation. Eur Respir J. 2019 May
23;53(5):1802118
Xiang Gao, Yanru Li, Wen Xu, Demin Han, Diagnostic
accuracy of level IV portable sleep monitors versus
polysomnography for pediatric obstructive sleep apnea:
a systematic review and meta-analysis, Sleep Medicine,
Volume 87, 2021, Pages 127-137
Identification of Patient Ventilator Asynchrony in Physiological Data Through Integrating Machine-Learning
443
