
Comprehensive Evaluation of End-to-End Driving Model Explanations
for Autonomous Vehicles
Chenkai Zhang
a
, Daisuke Deguchi, Jialei Chen and Hiroshi Murase
Graduate School of Informatics, Nagoya University, Furo-cho, Chikusa-ku, Nagoya, 464–8601, Japan
Keywords:
Autonomous Driving, Convolutional Neural Network, End-to-End Model, Explainability.
Abstract:
Deep learning technology has rapidly advanced, leading to the development of End-to-End driving models
(E2EDMs) for autonomous vehicles with high prediction accuracy. To comprehend the prediction results of
these E2EDMs, one of the most representative explanation methods is attribution-based. There are two kinds
of attribution-based explanation methods: pixel-level and object-level. Usually, the heatmaps illustrate the
importance of pixels and objects in the prediction results, serving as explanations for E2EDMs. Since there are
many attribution-based explanation methods, evaluation methods are proposed to determine which one is better
at improving the explainability of E2EDMs. Fidelity measures the explanation’s faithfulness to the model’s
prediction method, which is a bottommost property. However, no evaluation method could measure the fidelity
difference between object-level and pixel-level explanations, making the current evaluation incomplete. In
addition, without considering fidelity, previous evaluation methods may advertise manipulative explanations
that solely seek human satisfaction (persuasibility). Therefore, we propose an evaluation method that further
considers fidelity, our method enables a comprehensive evaluation that proves the object-level explanations
genuinely outperform pixel-level explanations in fidelity and persuasibility, thus could better improve the
explainability of the E2EDMs.
1 INTRODUCTION
Autonomous driving systems can be broadly cate-
gorized into two approaches: perception-planning-
action pipeline (Levinson et al., 2011; Yurtsever et al.,
2020) and End-to-End driving models (E2EDMs)
(Bojarski et al., 2016b; Pomerleau, 1998; Xu et al.,
2017; Tampuu et al., 2020). The former approach
breaks down the driving task into smaller sub-tasks
such as environment perception, planning, high-level
decision-making, and vehicle control. On the other
hand, the latter approach directly learns highly com-
plex transformations from input sensor data to gener-
ate driving commands.
If the model’s driving action differs from what
humans deem reasonable, humans are entitled to de-
mand an explanation of the model’s decision. For ex-
ample, if an autonomous vehicle suddenly changes
lanes at high speed, this unexpected behavior could
cause passengers to panic. Therefore, the explainabil-
ity of autonomous driving technology is also needed
to describe the trustworthiness of the driving mod-
a
https://orcid.org/0000-0002-7258-272X
els (Zablocki et al., 2021; Ras et al., 2022; Zhang
et al., 2023b). In addition, previous studies have
shown that human-machine trust could be divided into
performance-based trust and process-based trust (Lee
and Moray, 1992). The performance-based trust de-
pends on prediction accuracy. The process-based trust
depends on how well people can understand the pre-
diction results of models, i.e., and the explainability
of the models.
With regard to these two trusts, perception-
planning-action pipeline driving models could show
the internal prediction method through specialized
sub-tasks, however, they fall short of achieving high
prediction accuracy (McAllister et al., 2017). In con-
trast, E2EDMs have higher prediction accuracy, how-
ever, they are not interpretable to show the internal
prediction method as they address intertwined sub-
tasks by black-box end-to-end models.
There is more and more research (Zablocki et al.,
2021; Ras et al., 2022; Zhang et al., 2023b), (Guidotti
et al., 2018; Bojarski et al., 2016a; Arrieta et al.,
2020) proposing explanation methods to mitigate the
shortcoming of E2EDMs, i.e., the lack of explainabil-
ity. Among various explanation methods, attribution-
Zhang, C., Deguchi, D., Chen, J. and Murase, H.
Comprehensive Evaluation of End-to-End Driving Model Explanations for Autonomous Vehicles.
DOI: 10.5220/0012365900003660
Paper published under CC license (CC BY-NC-ND 4.0)
In Proceedings of the 19th International Joint Conference on Computer Vision, Imaging and Computer Graphics Theory and Applications (VISIGRAPP 2024) - Volume 2: VISAPP, pages
509-518
ISBN: 978-989-758-679-8; ISSN: 2184-4321
Proceedings Copyright © 2024 by SCITEPRESS – Science and Technology Publications, Lda.
509
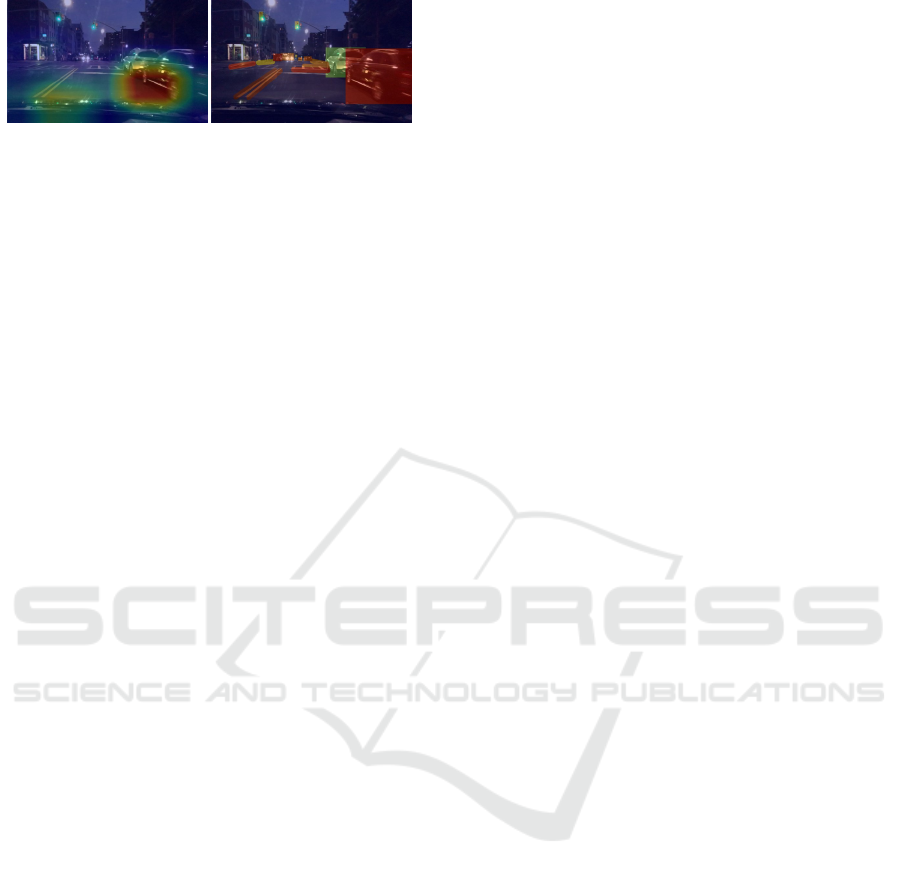
Pixel-level explanation
Object-level explanation
Figure 1: Pixel-level and object-level explanations.
based methods are the most prevalent (Ras et al.,
2022). As shown in Fig. 1, they usually generate
heatmaps that quantify the importance of elements in
the input images to the final predictions of the model.
The process of understanding the prediction re-
sults of E2EDMs could be divided into two steps.
Step (1): E2EDMs are required to generate expla-
nations for their prediction results. Step (2): Peo-
ple understand the generated explanations. We could
see that the explanations are intermediaries that con-
nected people and the prediction results of E2EDMs.
Therefore, to assess how well people could under-
stand the prediction results of E2EDMs, correspond-
ing to these two previous steps, two properties of the
explanations must be evaluated:
(1) Fidelity (Mohseni et al., 2021; Cui et al., 2019;
Kulesza et al., 2013): how well the explanations could
correctly reflect the prediction method of models.
(2) Persuasibility (Gilpin et al., 2018a; Lipton,
2018; Lage et al., 2019): how well people under-
stand and agree with the explanations generated by
the model.
However, the previous studies (Zhang et al.,
2023b; Lage et al., 2019; Zhang et al., 2023a) solely
focused on evaluating the persuasibility of the ex-
planations. The problem is that a more persua-
sive explanation method may not be faithful to the
E2EDMs’ prediction method. For example, (Zhang
et al., 2023b) evaluated the persuasibility of the pixel-
level and object-level explanations, and they proved
that the object-level explanations are more persuasive
than traditional pixel-level explanations. Their prob-
lem is that since the prediction of E2EDMs is based
on pixels, the object-level explanation method may
not be faithful to the E2EDMs’ prediction method.
Solely seeking human satisfaction could lead to ma-
nipulating explanations to better cater to humans, in-
stead of faithfully explaining E2EDMs (Gilpin et al.,
2018b; Zhou et al., 2021; Yang et al., 2019). There-
fore, in order to find the most appropriate explanation
method, we must also evaluate the fidelity of explana-
tions.
The previous research (Yang et al., 2019) intro-
duced the fidelity evaluation method for pixel-level
explanations, which uses gray patches to cover the
important area indicated by the explanations, and
measures how much the prediction results of the
model would change from the original images to the
masked images. However, since the object-level ex-
planations have different forms from the pixel-level
explanations, the previous fidelity evaluation method
could not compare the pixel-level and object-level ex-
planations under the same condition. To solve this
problem, in this paper, we propose a method includ-
ing discrete sampling, Gaussian Process Regression
(GPR), and Area Under Curve (AUC) to evaluate the
fidelity of object-level explanations. Based on the fi-
delity results of pixel-level and object-level explana-
tions, we could fairly compare the fidelity for both
explanations.
In addition, the previous comparison (Zhang et al.,
2023b) regarding explanation persuasibility is also
limited, the authors only compared the object-level
explanation methods with one pixel-level explanation
method (Selvaraju et al., 2017). To make a more
credible comparison, in this study, we evaluate the fi-
delity and persuasibility of explanations generated by
an object-level (Zhang et al., 2023b) and three pixel-
level explanation methods (Selvaraju et al., 2017; Si-
monyan et al., 2013; Sundararajan et al., 2017).
The contributions of this paper are as follows:
• Since the object-level and pixel-level explanations
have different express forms, we design a fair fi-
delity evaluation method for both forms.
• Based on the fidelity and persuasibility evaluation
results for the pixel-level and object-level expla-
nations, we prove that the object-level explanation
method could better improve the explainability of
E2EDMs.
2 RELATED WORK
In this section, we will briefly review the research on
3 topics: attribution-based explanation methods, per-
suasibility evaluation methods for explanations, and
fidelity evaluation methods for explanations.
2.1 Attribution-Based Explanation
Methods
The attribution-based explanation method assigns
credit or blame to input elements depending on their
influence on the prediction (Zhang et al., 2021; Xie
et al., 2019; Mascharka et al., 2018). There are three
types of attribution methods: gradient-related meth-
ods, occlusion-based methods, and model-agnostic
methods.
VISAPP 2024 - 19th International Conference on Computer Vision Theory and Applications
510

Gradient-Related Method. Selvaraju et al. (Sel-
varaju et al., 2017) proposed the Grad-CAM, which
leverages gradients of the model output with respect
to the final convolutional layer, enabling its applica-
tion to any CNN model for explanations.
Simonyan et al (Simonyan et al., 2013) proposed
saliency, which visualizes the partial derivatives of the
network output with respect to each input element,
thus quantifying the output’s sensitivity to these input
elements.
Sundararajan et al. (Sundararajan et al., 2017)
introduced the integrated gradients, an explanation
method that satisfies two axioms (sensitivity, imple-
mentation invariance) for scoring input element im-
portance in a model f .
Occlusion-Based Methods. Zeiler et al. (Zeiler
and Fergus, 2014) proposed an explanation method
in which a gray patch is applied to various positions
of an image to determine the effect on prediction per-
formance.
Similar to the above method, ZHANG et al.
(Zhang et al., 2023b) generated object-level explana-
tions using occlusion-based methods. They masked
out the bounding box of an object (vehicle, lane,
pedestrian, traffic light, etc.) to calculate the impor-
tance of the object. Since the position of objects
in consecutive images is much more accessible than
the position of pixels, unlike the above method, this
object-level explanation method can be applied to ex-
plain the E2EDMs that take consecutive images as in-
put.
Model Agnostic Method. LIME (Ribeiro et al.,
2016) approximates complex, black-box models with
interpretable models, such as logistic regression mod-
els, to explain an individual prediction. This method
can be widely adopted to explain the predictions of
any model. However, like the pixel-level occlusion-
based explanation methods, it cannot be applied to
explain the E2EDMs due to its reliance on occluding
patches of pixels in the input images.
2.2 Persuasibility Evaluation Methods
for Explanation
Yang et al. (Yang et al., 2019) define persuasibil-
ity as the extent to which humans comprehend ex-
planations. Since the ground truth remains consis-
tent across different user groups in straightforward
tasks such as object detection, the assessment of per-
suasibility can be conducted using human-annotated
ground truth. Common ground truths used for per-
suasibility evaluation in computer vision tasks in-
clude bounding boxes and semantic segmentation, as
demonstrated by Selvaraju et al. (Selvaraju et al.,
2017) who used bounding boxes and the Intersection
over Union (IOU) metric to measure persuasibility
performance.
However, in complex tasks where ground truths
for persuasibility may vary among user groups, it is
not feasible to rely on human annotations to evaluate
persuasibility. In such cases, conducting human stud-
ies is a widely adopted method for evaluating the per-
suasibility of explanations. Lage et al. (Lage et al.,
2019) focused on user satisfaction, using response
time and decision accuracy as evaluation indicators.
2.3 Fidelity Evaluation Methods for
Explanation
Mohseni et al. (Mohseni et al., 2018) introduced the
concept of “fidelity” or “correctness” in explanations,
which states that the explanations should accurately
reflect the internal prediction process of the model.
However, due to the post-hoc nature of attribution-
based explanation methods, none of these explana-
tions are fully faithful to the target E2E models.
To measure the fidelity of these attribution-based
explanations, ablation analysis is commonly used
(Yang et al., 2019; Petsiuk et al., 2018). This
method involves analyzing how the model’s predic-
tions change after making masks to the input accord-
ing to the explanations. The idea is, if the explana-
tions have high fidelity, i.e., the important input ele-
ments indicated by explanations are, in fact, important
for the functioning of the model, then these masks to
these important input elements will lead to significant
changes in the model’s predictions.
3 PROPOSED METHOD
In this section, we first introduce some background
knowledge in Section 3.1. Then, we introduce the
evaluation method for the fidelity and persuasibility
of the explanations.
3.1 Preliminary
Pixel-Level and Object-Level Explanations The
attribution-based explanations method assigns impor-
tance scores to the input elements as their credit or
blame to the prediction results. With respect to the in-
put elements, there are two kinds of attribution-based
explanation methods: pixel-level and object-level. As
shown in Fig. 1, these two explanations have differ-
ent forms. In the object-level explanation, each ob-
ject (vehicle, lane, pedestrian, traffic light, etc.) is
Comprehensive Evaluation of End-to-End Driving Model Explanations for Autonomous Vehicles
511
01aeb4e2-7d6000f2
Modifications based on pixel-
level explanations (23% pixels
in the images are masked)
Modifications based on object-
level explanations (23% pixels
in the images are masked)
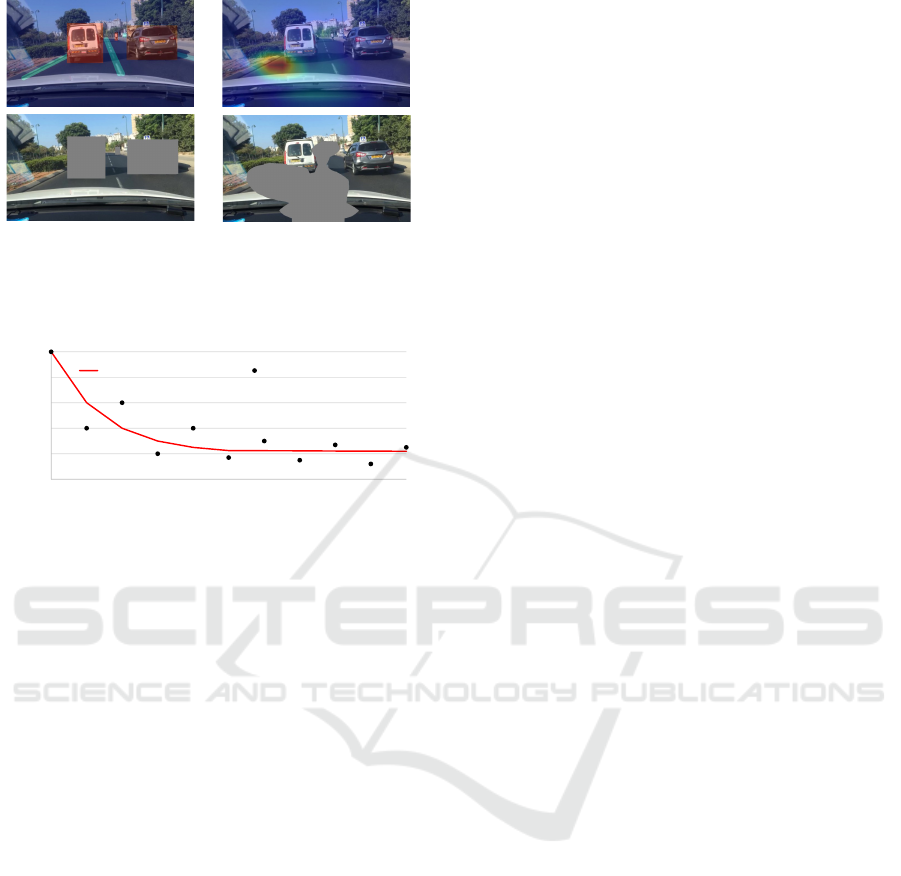
Figure 2: The masks are based on object-level explanations
and pixel-level explanations for fidelity evaluation.
0
0.2
0.4
0.6
0.8
1
0 20 40 60 80 100
Similarity (F1 score)
Masked area (%)
Pixel-level explanation Object-level explanation
Figure 3: Conceptual diagram of fair fidelity evaluation
method over all instances in the dataset.
assigned an importance score. The importance score
determines the color of the object’s bounding box in
the heatmap, where a warmer color indicates greater
importance and vice versa. On the other hand, in the
pixel-level explanation, each pixel is assigned an im-
portance score, which also determines its color in the
heatmap.
Fidelity Evaluation Previous studies (Yang et al.,
2019; Petsiuk et al., 2018) designed fidelity evalua-
tion methods only for pixel-level explanations, where
they mask the top important pixels indicated by the
pixel-level explanations. As shown in the right two
images of Fig. 2, based on the pixel importance shown
in the upside heatmap, 23% top important pixels in
the images are masked. Then, they calculate the pre-
diction similarity between the masked image and the
original image,
S(y, ˆy), (1)
where S is the similarity function, y and ˆy are the
prediction results of the original image and masked
image. Since the masked pixels are supposed to
be vital for the regular function of the E2EDMs, if
the E2EDMs are unable to access these masked pix-
els, the prediction results should greatly change, i.e.,
lower similarity indicates higher fidelity of the expla-
nations. As shown in Fig. 3, by gradually increasing
the number of masked pixels, they could draw a red
line, where more masked area leads to lower similar-
ity.
Since the pixel-level explanation and object-level
explanation have different forms, when it comes to
masking the important input elements based on the
explanations, the masked area must align with the ex-
planations’ form. Whereas the previous fidelity eval-
uation methods (Yang et al., 2019; Petsiuk et al.,
2018) are all designed for pixel-level explanations,
they could not be used to fairly compare the fidelity
of the pixel-level and object-level explanations.
3.2 The Fair Fidelity Evaluation
Method
To address this problem, we compare the fidelity of
both explanations only when their masked area is the
same. For example, in Fig. 2, based on the corre-
sponding topside heatmaps, we make masked images
downside. The object-level mask occludes the top 3
important objects in the image, and the masked area
of 3 objects also equal the 23% pixels of the images,
which enables a fair fidelity comparison between the
object-level and pixel-level explanations.
However, a single instance could not reflect the fi-
delity comparison of the explanation methods. There-
fore, we compare the object-level and pixel-level ex-
planations over all instances in the dataset. As shown
in Fig. 3, for each masked area in object-level and
pixel-level explanations, we calculate the fidelity over
the dataset with the following equation,
g(a) = E
x∈D
[F
1
( f (m
a
(x)), f (x))], (2)
where g represents the fidelity function in Fig. 3, the
D is the dataset, the a is the percentage of the masked
area to the whole image, the m
a
(x) masks out the top
a of the important pixels in the image x to generate
a masked image, the f (x) is the E2EDM’s prediction
results for the input image x, F
1
( f (m
a
(x)), f (x)) is
the similarity of the prediction results of the masked
images and their respective original images, a smaller
similarity indicates better fidelity. In this paper, since
we consider the driving task as a multi-label predic-
tion task, we use the F1-score as the similarity func-
tion for prediction results. Since the object-level mask
is discrete, we sample the dataset’s object-level mask
which has the a masked area to calculate the fidelity
of the object-level explanations. Due to the discrete
sampling (Fig. 3), we apply Gaussian Process Regres-
sion (GPR) to the gathered data for deriving function
g(a) in relation to object-level explanations.
To compare the pixel-level and object-level expla-
nations under all masked areas, we calculate the AUC
(Area Under Curve) for the fidelity function of both
explanations, a smaller AUC indicates better fidelity.
VISAPP 2024 - 19th International Conference on Computer Vision Theory and Applications
512

Figure 4: Gradually display the important parts of an image
based on the explanation (as shown in the left of Fig. 1).
AUC =
Z
l
0
g(a)da, (3)
where l is the max object-level masked area over all
instances in the dataset, thus the object-level expla-
nations fidelity could be fairly compared with pixel-
level explanations fidelity.
3.3 The Persuasibility Evaluation
Method
As introduced before, the process of understand-
ing the prediction results of E2EDMs could be di-
vided into two steps. (1) E2EDMs generate expla-
nations. (2) People understand the generated expla-
nations. Fidelity evaluates the relationship between
the model and the generated explanations, i.e., how
well the explanations could correctly reflect the pre-
diction method of models. After evaluating the fi-
delity, we also have to evaluate the relationship be-
tween the people and the generated explanations, i.e.,
how well people understand and agree with the gen-
erated explanations. If we do not consider the per-
suasibility of explanations, models may end up gener-
ating faithful while over-complicated internal predic-
tion methods that could not be understood by people,
thus not qualified as explanations.
Since the attribution-based explanations are the
E2EDM’s judgments on the importance of input fea-
tures, we evaluate the persuasibility of explanations
by assessing the similarity between human judgment
and E2EDM’s judgments on the importance of in-
put elements (Zhang et al., 2023b). This is achieved
through objective and subjective persuasibility evalu-
ation methods.
The objective persuasibility evaluation is based
on whether explanations can correctly show driving-
related features. As shown in Fig. 4, we gradually
show the important part of an image to participants
according to the explanations, if the participants can
make the same prediction results based on a partially
shown image as they would with a complete image, it
means the explanations are persuasive. We also utilize
the macro F1 score to measure the similarity between
prediction results. A higher similarity indicates more
persuasive explanations.
In the subjective persuasibility evaluation, we
present participants with explanations in the form of
heatmaps. As shown in Fig. 1, heatmaps show the
importance of the input elements considered by the
E2EDMs. For pixel-level explanations, the heatmap
shows the importance of each pixel, and for object-
level explanations, the heatmap shows the importance
of each object. participants rate the heatmap on a
scale of 1 to 5, with 5 indicating high persuasibility.
Five participants, all with driver’s licenses, were
recruited. Each instance was evaluated by at least
three participants. They were given a tutorial on the
tasks and interface.
4 EXPERIMENT SETTINGS
4.1 The BDD-3AA Dataset
Previous driving datasets (Xu et al., 2017; Bojarski
et al., 2016b) focus on labeling the driver’s chosen
action as the ground truth for a driving scenario, im-
plying that only that specific action is correct. In re-
ality, drivers may randomly choose driving actions
from several available options. Therefore, these driv-
ing datasets have the risk of training E2EDMs that
have an incomplete understanding of the driving sce-
nario, thus are not suitable for conducting evaluations
for the explanations.
To tackle this issue, in this paper, we train
E2EDMs using the BDD-3AA (3 available actions)
dataset
1
. For each driving scenario, the BDD-3AA
dataset was labeled with the availability of three driv-
ing actions: acceleration, left steering, and right steer-
ing. Therefore, we consider the driving task as
a multi-label classification problem. Among many
driving tasks, classification tasks could easily evalu-
ate the fidelity and persuasibility of the explanations
generated by E2EDMs. Therefore, such driving tasks
are optimal for evaluating the explanation methods.
The dataset consists of 500 two-frame video clips.
Given two continuous images of the driving environ-
ment, the goal of E2EDMs is to calculate the avail-
abilities of three driving actions: acceleration, steer-
ing left, and steering right. As shown in Fig. 5, there
are solid yellow lines on the left and vehicles on the
right, thus the steering left and right actions are not
1
https://github.com/chatterbox/More-Persuasive-
Explanation-Method-For-End-to-End-Driving-Models
Comprehensive Evaluation of End-to-End Driving Model Explanations for Autonomous Vehicles
513
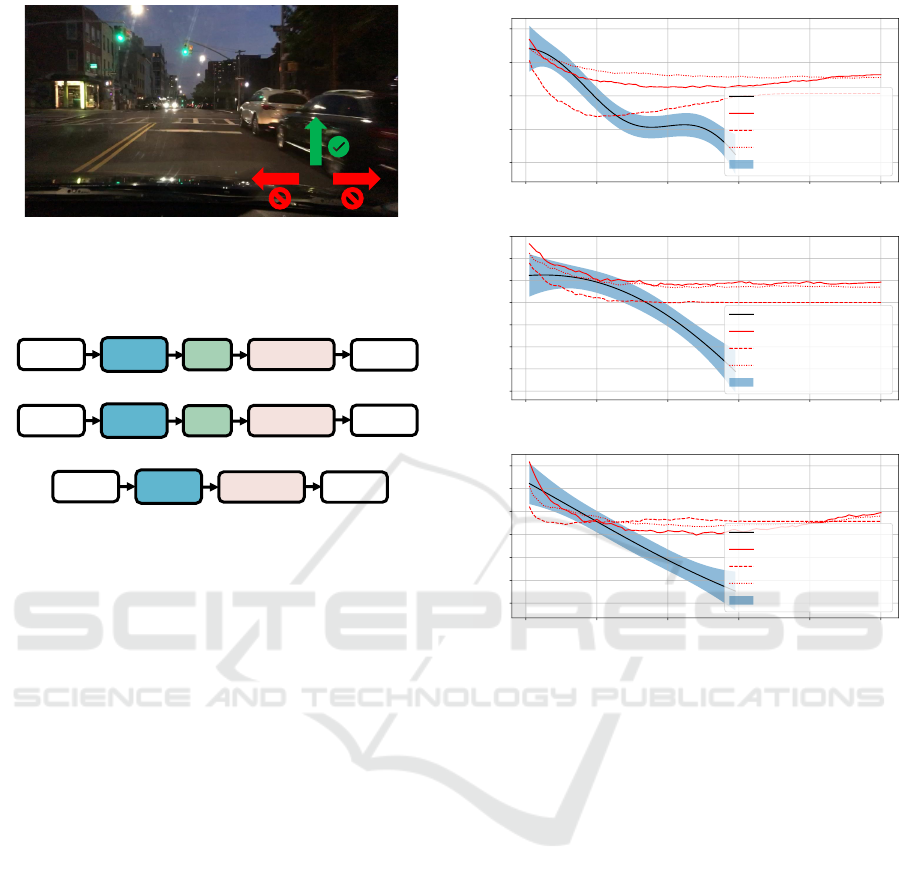
Figure 5: There is a typical scene in the BDD-3AA dataset.
The green arrow with a check mark indicates availability,
while the red arrow with a forbidden character indicates that
it is not.
LRCN-18
LSTM
512
FC(128, 64, 3)
2D
ResNet-18
Input
images
LRCN-50
LSTM
2048
FC(128, 64, 3)
2D
ResNet-50
Input
images
3D-CNN
FC(128, 64, 3)
3D
ResNet-18
Input
images
Driving
Actions
Driving
Actions
Driving
Actions
Figure 6: The architectures of E2EDMs.
available, leading to labels of [1, 0, 0]
T
(acceleration,
steering left, steering right), 1 indicates the corre-
sponding driving action is available and 0 indicates
unavailable.
4.2 The End-to-End Driving Models
(E2EDMs)
We employ Long-term Recurrent Convolutional Net-
works (LRCN) (Donahue et al., 2015) and 3D Con-
volutional Neural Networks (3D-CNN) (Tran et al.,
2018) to construct E2EDMs. The LRCN integrates a
Long Short-Term Memory (LSTM) network into the
output of a CNN to process spatio-temporal informa-
tion. Meanwhile, the 3D-CNN extends the traditional
2D CNN by incorporating a temporal dimension.
As shown in Fig. 6, to train our E2EDMs, we
fine-tune two LRCN networks (LRCN-18 and LRCN-
50) with Resnet-18 and Resnet-50 backbones on the
BDD-3AA dataset. Both backbones are pre-trained
on ImageNet (He et al., 2016) and connected to a
stack of fully connected layers with ReLU activa-
tion. We also fine-tune a 3D-CNN network with an
18-layer Resnet3D backbone, pre-trained on Kinetics
(Tran et al., 2018) and connected to a stack of fully
connected layers with ReLU activation.
0 20 40 60 80 100
Masked area (%)
0.2
0.4
0.6
0.8
1.0
Similarity (F1-score)
Fidelity evaluation for LCRN-18
Object 30.94
Grad-CAM 41.10
IG 32.01
Saliency 44.27
95% confidence interval
0 20 40 60 80 100
Masked area (%)
0.3
0.4
0.5
0.6
0.7
0.8
0.9
1.0
Similarity (F1-score)
Fidelity evaluation for LCRN-50
Object 40.01
Grad-CAM 47.30
IG 42.18
Saliency 46.37
95% confidence interval
0 20 40 60 80 100
Masked area (%)
0.3
0.4
0.5
0.6
0.7
0.8
0.9
Similarity (F1-score)
Fidelity evaluation for 3D-CNN
Object 33.41
Grad-CAM 38.64
IG 38.97
Saliency 39.37
95% confidence interval
Figure 7: Fidelity evaluation results of 3 pixel-level and an
object-level explanation method for three E2EDMs.
4.3 12 Explanations for E2EDMs
For the pixel-level explanation, we use Grad-CAM
(Selvaraju et al., 2017), saliency (Simonyan et al.,
2013), and integrated gradient (Sundararajan et al.,
2017) to explain each of the above 3 E2EDMs. For
the object-level explanation, we apply the occlusion-
based object-level explanation method (Zhang et al.,
2023b) to explain each of the above 3 E2EDMs. Since
we have 3 E2EDMs and 4 explanation methods, over-
all, we made 3 × 4 = 12 groups of explanations for
fidelity and persuasibility evaluation.
5 EXPERIMENTAL RESULTS
AND DISCUSSION
5.1 The Fidelity Evaluation Results
In the assessment of the explanations’ fidelity, we
quantify the impact of masked area by measuring the
changes in the prediction results after applying masks
VISAPP 2024 - 19th International Conference on Computer Vision Theory and Applications
514
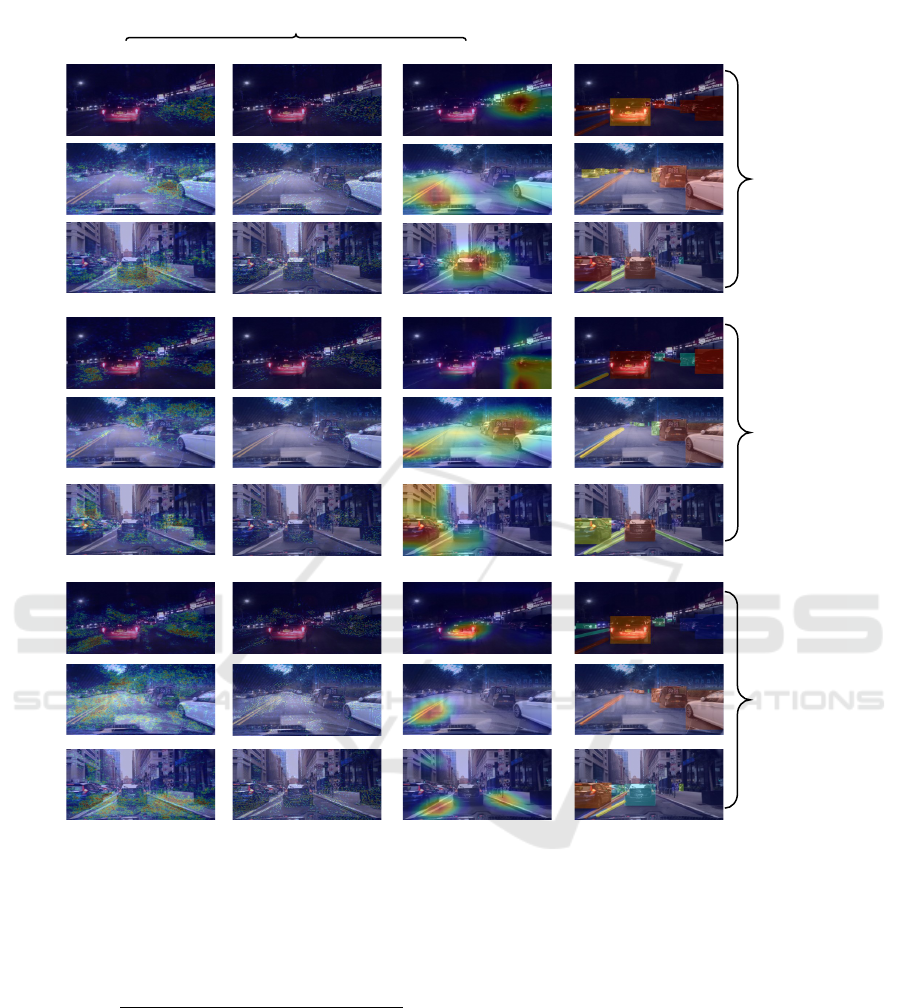
Pixel-level
Saliency IG Grad-CAM
Object-level
LCRN-50
3D-CNN
LCRN-18
Figure 8: Heatmaps for each explanation generated from three E2EDMs.
to the original images based on the explanations. We
also use the macro F1-score to measure the changes,
which is calculated as the average value of the F1-
score for the three actions,
Macro F
1
=
F
1
(
ˆ
A
a
, A
a
) + F
1
(
ˆ
A
l
, A
l
) + F
1
(
ˆ
A
r
, A
r
)
3
,
(4)
where
ˆ
A is the prediction actions for masked images
and A is the prediction actions for original images.
A
a
, A
l
, and A
r
, representing acceleration, steering
left, and steering right. Lower scores indicate greater
changes in the predictions and therefore a higher fi-
delity.
As shown in Fig. 7, for each E2EDM, we calcu-
late the F1-score as the fidelity score for each expla-
nation method. Since the object-level explanations
have a limited 60% range of masked area even if all
objects in images are masked. Therefore, the AUCs
for all explanation methods only consider the masked
area ranging from 1% to 60%. The results of the
AUC are presented in the legend of Fig. 7, reveal-
ing that the object-level explanation method outper-
forms all three pixel-level explanation methods in fi-
delity. More precisely, for all E2EDMs, the object-
level explanation method achieves a performance gain
by 1.07%, 2.17%, and 5.23% than their correspond-
ing best performance in pixel-level explanation meth-
ods, respectively.
The object-level explanation method determines
the object’s importance by the significance of the
change in the E2EDM’s prediction result after mask-
ing that object and inputs the masked image into the
Comprehensive Evaluation of End-to-End Driving Model Explanations for Autonomous Vehicles
515

Table 1: The objective persuasibility evaluation results for
pixel-level and object-level explanations.
Pixel-level Object
Grad-CAM IG Saliency level
LCRN-18 73.68% 73.07% 72.6% 74.55%
LCRN-50 71.89% 72.90 % 73.45% 75.14%
3D-CNN 73.93% 72.45% 73.00 % 75.74%
Table 2: The subjective persuasibility evaluation results for
pixel-level and object-level explanations.
Pixel-level Object
Grad-CAM IG Saliency level
LCRN-18 3.25 3.31 3.43 4.20
LCRN-50 2.91 2.74 2.99 3.52
3D-CNN 3.20 3.17 3.24 3.82
E2EDM, in other words, for the most important object
indicated by the object-level explanation, the masking
of that object will naturally cause the big change in the
prediction results. This happens to align well with the
fidelity evaluation method, which assesses the fidelity
of the explanations based on the changes in prediction
results after masking the important area. Therefore,
the object-level explanation method is well-suited for
the fidelity property of explanations and thus has high
fidelity.
5.2 The Persuasibility Evaluation
Results
In objective persuasibility evaluation, We also use
macro F1-score to measure the similarity between the
prediction actions for partial images and respective
original images. Higher scores indicate more per-
suasive explanations, as shown in Table 1, the re-
sults of the objective evaluation show that the object-
level explanations outperformed all three pixel-level
explanations for each E2EDM. More precisely, for
all E2EDMs, the object-level explanation method
achieves a performance gain by 0.87%, 1.69%, and
1.81% than their corresponding best performance in
pixel-level explanation methods, respectively.
In the subjective persuasibility evaluation, as
shown in Fig. 8, participants rated the persuasibility
of pixel-level and object-level explanations for each
E2EDM. Higher scores indicate more persuasive ex-
planations, as shown in Table 2, the subjective eval-
uation results show that the object-level explanations
outperformed all three pixel-level explanations. More
precisely, in the subjective score, for all E2EDMs,
the object-level explanation method achieves a perfor-
mance gain by 0.77, 0.53, and 0.58 than their corre-
sponding best performance in pixel-level explanation
methods, respectively.
The object-level explanation method masks an ob-
ject and inputs the masked image into the E2EDM,
the importance of the object is then determined by the
significance of the change in the E2EDM’s prediction
result. Therefore, the object-level explanation method
has the characteristic that a larger masked area tends
to result in a greater change in the prediction result.
As shown in Table 1 and Table 2, these object-level
explanations were found to be more persuasive than
all pixel-level explanations. The reason behind this
phenomenon may be that large objects are also closer
to the ego vehicle and typically more important to the
driving task. Therefore, the object-level explanation
method naturally has high persuasibility in driving
tasks since the explanation method tends to consider
that close objects are important.
6 CONCLUSION
Evaluating the explainability of the E2EDMs is al-
ways a topic of widespread concern, thus many ex-
planation evaluation methods are proposed. However,
the bottommost property of explanations is often ne-
glected, i.e., whether the explanations are faithful to
E2EDM’s prediction method (fidelity), thus there is
no comprehensive and universal evaluation method
designed for explanations that have different express
forms, i.e., pixel-level and object-level.
Therefore, in this study, we propose a compre-
hensive evaluation method for both object-level and
pixel-level explanations. By assessing their fidelity
and persuasibility, we observed an intriguing phe-
nomenon: while object-level explanations might ap-
pear unfaithful at first glance since E2EDMs rely on
pixel-based prediction methods, due to the occlusion-
based explanation method instinctively has higher fi-
delity, therefore, compared to traditional pixel-level
explanations, object-level explanations generated by
the occlusion-based method are more faithful. More-
over, considering the persuasive nature of object-level
explanations, given that the human recognition sys-
tem is based on objects (Scholl, 2001), employing the
occlusion-based object-level explanation method can
significantly enhance the explainability of E2EDMs.
However, our explanation evaluation method
heavily relies on human-dependent experiments,
which are time-consuming and costly. As a future di-
rection, we plan to design a human-independent ex-
planation evaluation method for E2EDMs under lim-
ited time and manpower conditions.
VISAPP 2024 - 19th International Conference on Computer Vision Theory and Applications
516

ACKNOWLEDGMENT
This work was supported by JST SPRING JP-
MJSP2125, JSPS KAKENHI Grant Number
23H03474, and JST CREST Grant Number JP-
MJCR22D1. The author Chenkai Zhang would like
to take this opportunity to thank the “Interdisciplinary
Frontier Next-Generation Researcher Program of the
Tokai Higher Education and Research System.”
REFERENCES
Arrieta, A. B., D
´
ıaz-Rodr
´
ıguez, N., Del Ser, J., Bennetot,
A., Tabik, S., Barbado, A., Garc
´
ıa, S., Gil-L
´
opez, S.,
Molina, D., Benjamins, R., et al. (2020). Explainable
artificial intelligence (xai): Concepts, taxonomies, op-
portunities and challenges toward responsible ai. In-
formation fusion, 58:82–115.
Bojarski, M., Choromanska, A., Choromanski, K., Firner,
B., Jackel, L., Muller, U., and Zieba, K. (2016a). Vi-
sualbackprop: visualizing cnns for autonomous driv-
ing. arXiv preprint arXiv:1611.05418, 2.
Bojarski, M., Del Testa, D., Dworakowski, D., Firner,
B., Flepp, B., Goyal, P., Jackel, L. D., Monfort,
M., Muller, U., Zhang, J., et al. (2016b). End to
end learning for self-driving cars. arXiv preprint
arXiv:1604.07316.
Cui, X., Lee, J. M., and Hsieh, J. (2019). An integrative 3c
evaluation framework for explainable artificial intelli-
gence.
Donahue, J., Anne Hendricks, L., Guadarrama, S.,
Rohrbach, M., Venugopalan, S., Saenko, K., and Dar-
rell, T. (2015). Long-term recurrent convolutional net-
works for visual recognition and description. In Pro-
ceedings of the IEEE conference on computer vision
and pattern recognition, pages 2625–2634.
Gilpin, L. H., Bau, D., Yuan, B. Z., Bajwa, A., Specter,
M., and Kagal, L. (2018a). Explaining explanations:
An approach to evaluating interpretability of machine
learning. arXiv preprint arXiv:1806.00069, page 118.
Gilpin, L. H., Bau, D., Yuan, B. Z., Bajwa, A., Specter,
M., and Kagal, L. (2018b). Explaining explanations:
An overview of interpretability of machine learning.
In 2018 IEEE 5th International Conference on data
science and advanced analytics (DSAA), pages 80–89.
IEEE.
Guidotti, R., Monreale, A., Ruggieri, S., Turini, F., Gian-
notti, F., and Pedreschi, D. (2018). A survey of meth-
ods for explaining black box models. ACM computing
surveys (CSUR), 51(5):1–42.
He, K., Zhang, X., Ren, S., and Sun, J. (2016). Deep resid-
ual learning for image recognition. In Proceedings of
the IEEE conference on computer vision and pattern
recognition, pages 770–778.
Kulesza, T., Stumpf, S., Burnett, M., Yang, S., Kwan, I.,
and Wong, W.-K. (2013). Too much, too little, or
just right? ways explanations impact end users’ men-
tal models. In 2013 IEEE Symposium on visual lan-
guages and human centric computing, pages 3–10.
IEEE.
Lage, I., Chen, E., He, J., Narayanan, M., Kim, B., Gersh-
man, S., and Doshi-Velez, F. (2019). An evaluation
of the human-interpretability of explanation. arXiv
preprint arXiv:1902.00006.
Lee, J. and Moray, N. (1992). Trust, control strategies and
allocation of function in human-machine systems. Er-
gonomics, 35(10):1243–1270.
Levinson, J., Askeland, J., Becker, J., Dolson, J., Held, D.,
Kammel, S., Kolter, J. Z., Langer, D., Pink, O., Pratt,
V., et al. (2011). Towards fully autonomous driving:
Systems and algorithms. In 2011 IEEE intelligent ve-
hicles symposium (IV), pages 163–168. IEEE.
Lipton, Z. C. (2018). The mythos of model interpretability:
In machine learning, the concept of interpretability is
both important and slippery. Queue, 16(3):31–57.
Mascharka, D., Tran, P., Soklaski, R., and Majumdar, A.
(2018). Transparency by design: Closing the gap be-
tween performance and interpretability in visual rea-
soning. In Proceedings of the IEEE conference on
computer vision and pattern recognition, pages 4942–
4950.
McAllister, R., Gal, Y., Kendall, A., Van Der Wilk, M.,
Shah, A., Cipolla, R., and Weller, A. (2017). Con-
crete problems for autonomous vehicle safety: Ad-
vantages of bayesian deep learning. In Proceedings
of the Twenty-Sixth International Joint Conference on
Artificial Intelligence. International Joint Conferences
on Artificial Intelligence Organization.
Mohseni, S., Zarei, N., and Ragan, E. D. (2018). A survey
of evaluation methods and measures for interpretable
machine learning. arXiv preprint arXiv:1811.11839,
1:1–16.
Mohseni, S., Zarei, N., and Ragan, E. D. (2021). A mul-
tidisciplinary survey and framework for design and
evaluation of explainable ai systems. ACM Transac-
tions on Interactive Intelligent Systems (TiiS), 11(3-
4):1–45.
Petsiuk, V., Das, A., and Saenko, K. (2018). Rise: Ran-
domized input sampling for explanation of black-box
models. arXiv preprint arXiv:1806.07421.
Pomerleau, D. (1998). An autonomous land vehicle in a
neural network. Advances in neural information pro-
cessing systems, 1:1.
Ras, G., Xie, N., Van Gerven, M., and Doran, D. (2022).
Explainable deep learning: A field guide for the unini-
tiated. Journal of Artificial Intelligence Research,
73:329–396.
Ribeiro, M. T., Singh, S., and Guestrin, C. (2016). ” why
should i trust you?” explaining the predictions of any
classifier. In Proceedings of the 22nd ACM SIGKDD
international conference on knowledge discovery and
data mining, pages 1135–1144.
Scholl, B. J. (2001). Objects and attention: The state of the
art. Cognition, 80(1-2):1–46.
Selvaraju, R. R., Cogswell, M., Das, A., Vedantam, R.,
Parikh, D., and Batra, D. (2017). Grad-cam: Visual
explanations from deep networks via gradient-based
Comprehensive Evaluation of End-to-End Driving Model Explanations for Autonomous Vehicles
517

localization. In Proceedings of the IEEE international
conference on computer vision, pages 618–626.
Simonyan, K., Vedaldi, A., and Zisserman, A. (2013).
Deep inside convolutional networks: Visualising im-
age classification models and saliency maps. arXiv
preprint arXiv:1312.6034.
Sundararajan, M., Taly, A., and Yan, Q. (2017). Axiomatic
attribution for deep networks. In International confer-
ence on machine learning, pages 3319–3328. PMLR.
Tampuu, A., Matiisen, T., Semikin, M., Fishman, D., and
Muhammad, N. (2020). A survey of end-to-end driv-
ing: Architectures and training methods. IEEE Trans-
actions on Neural Networks and Learning Systems,
33(4):1364–1384.
Tran, D., Wang, H., Torresani, L., Ray, J., LeCun, Y., and
Paluri, M. (2018). A closer look at spatiotemporal
convolutions for action recognition. In Proceedings of
the IEEE conference on Computer Vision and Pattern
Recognition, pages 6450–6459.
Xie, N., Lai, F., Doran, D., and Kadav, A. (2019). Visual
entailment: A novel task for fine-grained image un-
derstanding. arXiv preprint arXiv:1901.06706.
Xu, H., Gao, Y., Yu, F., and Darrell, T. (2017). End-to-
end learning of driving models from large-scale video
datasets. In Proceedings of the IEEE conference on
computer vision and pattern recognition, pages 2174–
2182.
Yang, F., Du, M., and Hu, X. (2019). Evaluating expla-
nation without ground truth in interpretable machine
learning. arXiv preprint arXiv:1907.06831.
Yurtsever, E., Lambert, J., Carballo, A., and Takeda, K.
(2020). A survey of autonomous driving: Common
practices and emerging technologies. IEEE access,
8:58443–58469.
Zablocki,
´
E., Ben-Younes, H., P
´
erez, P., and Cord, M.
(2021). Explainability of vision-based autonomous
driving systems: Review and challenges. arXiv
preprint arXiv:2101.05307.
Zeiler, M. D. and Fergus, R. (2014). Visualizing and
understanding convolutional networks. In Com-
puter Vision–ECCV 2014: 13th European Confer-
ence, Zurich, Switzerland, September 6-12, 2014, Pro-
ceedings, Part I 13, pages 818–833. Springer.
Zhang, C., Deguchi, D., and Murase, H. (2023a). Re-
fined objectification for improving end-to-end driving
model explanation persuasibility. In 2023 IEEE Intel-
ligent Vehicles Symposium (IV), pages 1–6. IEEE.
Zhang, C., Deguchi, D., Okafuji, Y., and Murase, H.
(2023b). More persuasive explanation method for
end-to-end driving models. IEEE Access, 11:4270–
4282.
Zhang, Y., Ti
ˇ
no, P., Leonardis, A., and Tang, K. (2021). A
survey on neural network interpretability. IEEE Trans-
actions on Emerging Topics in Computational Intelli-
gence, 5(5):726–742.
Zhou, J., Gandomi, A. H., Chen, F., and Holzinger, A.
(2021). Evaluating the quality of machine learning
explanations: A survey on methods and metrics. Elec-
tronics, 10(5):593.
VISAPP 2024 - 19th International Conference on Computer Vision Theory and Applications
518
