
Detecting Manuscript Annotations in Historical Print: Negative Evidence
and Evaluation Metrics
Jacob Murel and David Smith
Khoury College of Computer Sciences, Northeastern University, Boston, MA, U.S.A.
Keywords:
Object Detection, YOLO, Historical Print, Handwriting, Digital Humanities.
Abstract:
Early readers’ manuscript annotations in books have been analyzed by bibliographers for evidence about
book history and reading practice. Since handwritten annotations are not uniformly distributed across or
within books, however, even the compilers of censuses of all copies of a single edition have very seldom
produced systematic information about these interventions in the lives of books. This paper analyzes the
use of object detection models (ODMs) for detecting handwritten annotations on the pages of printed books.
While computer vision developers have dealt widely with imbalanced datasets, none have addressed the effect
of negative sample images on model accuracy. We therefore investigate the use of negative evidence—pages
with no annotations—in training accurate models for this task. We also consider how different evaluation
metrics are appropriate for different modes of bibliographic research. Finally, we create a labeled training
dataset of handwritten annotations in early printed books and release it for evaluation purposes.
1 INTRODUCTION
Recent decades have seen an exponential increase in
the digitization of early printed books for preserva-
tion and accessibility. But as Sarah Werner remarks,
the act of digitization is often seen as sufficient unto
itself (Werner, 2016). One area for advancing digi-
tization services is the detection of manuscript anno-
tations in early print. Bibliographic scholar William
Sherman writes, ”[C]ontemporary annotations repre-
sent an extensive and still largely untapped archive of
information about the lives of books and their place
in the intellectual, spiritual, and social lives of their
readers” (Sherman, 2002). Despite interest in hand-
written reader marks, constraints on time and fund-
ing limit research to a single text or small handful.
When scholars are able to conduct global censuses of
printed works (Marg
´
ocsy et al., 2018; West, 2003),
documentation of manuscript annotations is scant and
vague. Similarly, library catalog records provide little
information on handwriting in collection items due to
logistical constraints for such time-consuming work.
Given the mass digitization of library collections and
importance of manuscript annotations for researchers,
a tool that detects and enumerates handwriting in col-
lections would be immensely valuable. To this end,
we examine the training and evaluation of object de-
tection models (ODMs) on handwriting in digitized
printed books with two focuses.
First, we examine the effect of different dataset
proportions on model precision and recall. Recent
research on handwriting detection gives no atten-
tion to how the makeup of training data may affect
model performance (Kusetogullari et al., 2021; Wu
et al., 2021; Moustapha et al., 2023). More specifi-
cally, none mention the prevalence of negative sam-
ple images, i.e., images of print sans handwriting,
in datasets, let alone the potential impact of nega-
tive sample images on model accuracy. Dataset de-
scriptions are typically confined to a paragraph enu-
merating positive sample images, image pixel dimen-
sions, and data source. Handwriting in early print is
scarce, following a long-tail distribution and result-
ing in imbalanced datasets. Other recent studies argue
synthetic positive sample images (e.g., data augmen-
tation) may help correct problems related to imbal-
anced datasets (Saini and Susan, 2023; Nguyen-Mau
et al., 2023; Kim et al., 2023). But even studies that
examine the effect of different dataset proportions or
manipulation techniques on classification tasks do not
address the potential value of negative sample images
in improving model accuracy (Thabtah et al., 2020;
Rao et al., 2023). Given their ready availability in
long-tail distribution sets, the effect of negative sam-
ple images on model accuracy is worth exploring. We
join calls for re-evaluating the importance of negative
Murel, J. and Smith, D.
Detecting Manuscript Annotations in Historical Print: Negative Evidence and Evaluation Metrics.
DOI: 10.5220/0012365600003654
Paper published under CC license (CC BY-NC-ND 4.0)
In Proceedings of the 13th International Conference on Pattern Recognition Applications and Methods (ICPRAM 2024), pages 745-752
ISBN: 978-989-758-684-2; ISSN: 2184-4313
Proceedings Copyright © 2024 by SCITEPRESS – Science and Technology Publications, Lda.
745
evidence in machine learning (Borji, 2018) by arguing
that negative sample images are an untapped resource
for improving detection accuracy of positive sample
images, particularly in bibliographic search tasks.
Second, we consider evaluation metrics appropri-
ate for different bibliographic search tasks. Object de-
tection models are often evaluated at the pixel level,
using metrics such as intersection over union (Wu
et al., 2021; Rezatofighi et al., 2019). While it can be
helpful to localize handwriting on the page, we pro-
pose that many book-historical search tasks are bet-
ter modeled as page-level retrieval tasks. We there-
fore employ mean average precision (mAP) to evalu-
ate tasks where the researcher has selected a book and
wants to locate all pages with handwriting therein. We
also employ corpus-level average precision to evalu-
ate tasks where the researcher wants to find examples
of handwriting across a larger collection without fo-
cusing on a particular book. These metrics, we argue,
are more appropriate for search tasks where the user
will not be able to examine every page of a book or
every result. It is much more efficient, furthermore, to
collect user feedback at the page level than by asking
for individual regions to be highlighted.
To conduct these investigations, we compile train-
ing data for a wide array of open-access early printed
books and compile test data from ten open-access
copies of Shakespeare’s First Folio (9,100+ images).
We release our training data under an open-source li-
cense to enable further work on this task.
1
2 DATASETS
2.1 Training Datasets
We compiled a training set by hand from several
open-access digital collections including: the Ox-
ford University Bodleian Library, the Wellcome Li-
brary, Princeton University Library, John Carpenter
Brown Library, the Folger Shakespeare Library’s Dig-
ital LUNA Collection, Annotated Books Online, and
the Munich DigitiZation Center and Bavarian State
Library. We also include (and re-annotate) images
digitized from the UCLA Clark Library and available
on GitHub as part of the Omniscribe project
2
for de-
veloping a Detectron-based handwriting ODM. Due
to their curation from multiple institutions, and the
lack of digitization standards even within one institu-
tion, page image dimensions vary. Nevertheless, all
1
The training dataset is presently available for use at
https://github.com/jmurel/em reader ann
2
https://github.com/collectionslab/Omniscribe/tree/ma
ster
Figure 1: Example manuscript manicule and alphabetic
note in early printed book. Courtesy of UCLA Clark Li-
brary, Los Angeles, California, USA.
Figure 2: Example manuscript simple brackets and alpha-
betic notes in early printed book. Courtesy of The Free Li-
brary of Philadelphia, Philadelphia, Pennsylvania, USA.
images are considered hi-res (600+ dpi) with the av-
erage image height being around 1000 pixels.
ICPRAM 2024 - 13th International Conference on Pattern Recognition Applications and Methods
746

Figure 3: Illustration of bounding boxes for marginal
manuscript annotations in early print. Note the exclusion
of manuscript underlining from bounding boxes. Courtesy
of UCLA Clark Library, Los Angeles, California, USA.
We curate all the images for our training sets from
digitized copies of books printed in Europe and Amer-
ica from the fifteenth through the nineteenth century.
The majority of these books are printed in Latinate
type. Documents printed in non-Latinate type—i.e.,
Arabic, Hebrew, Greek, and Chinese—constitute less
than approximately 10% percent of our training data,
and have been included to account for the small pres-
ence of these types in European and American print.
The number of positive sample images—i.e., im-
ages with handwriting—used in each training set is
2,448. We label all forms of ink-based handwriting,
including doodles (Fig.1), manicules, simple brack-
ets, and alphabetic notes (Fig.2) under one ”hand-
writing” class. We ignore manuscript underlining
of printed text. Figure 3 illustrates how we label a
page with alphabetic notes, a manicule, and underlin-
ing. All images are labeled by a trained paleographer
using Roboflow,
3
a development tool for producing
computer vision models. Across the 2,448 positive
sample images, there are 9,830 ”handwriting” labels
total.
3
https://roboflow.com/
We use three different datasets to train three dif-
ferent models. All three datasets share the same 2,448
positive images. We retain the same number of posi-
tive sample images across each set in order to isolate
the effect of negative sample images on model accu-
racy. The datasets differ in their respective number of
negative sample images—i.e., those images without
any handwriting, and so no labels.
Ultralytics’ YOLOv5 documentation,
4
in addition
to external help articles and forums, recommend the
number of negative sample images equal less than
10% the number of positive sample images in ODM
training. We therefore train Model 1 on a dataset con-
taining 245 negative sample images in addition to the
2,448 positive sample images. But this train-test split
does not mimic expected real-world proportions of
handwriting in early print, as often far less than 10%
of an early printed book contains handwriting. Thus,
we train Model 2 on a dataset with an equal number of
negative sample (2448) as positive sample images and
Model 3 on a dataset containing double the number of
negative sample (4896) as positive sample images.
We curate the additional negative sample images
for each successive training set from digitized col-
lections at the aforementioned institutions. The ma-
jority of these negative sample images come from
different books than the positive sample images, al-
though there is some overlap. Object detection re-
search has demonstrated the positive effect of using
misclassified samples in finetuning to improve model
accuracy (Zou et al., 2023). As such, when select-
ing negative sample images, we aim to compile im-
ages that contain features frequently returned as false
positives in handwriting detection tasks. Such fea-
tures include bleed-through (Fig.4), italic type, and
physical damage (Kusetogullari et al., 2021; Mondal
et al., 2022). Our preliminary tests confirmed this.
Admittedly, such features are difficult to locate when
combing digital collections, though we nevertheless
include several images with bleed-through, worming,
and page tears, and even more with italic type.
2.2 Test Datasets
We test each of the three generated models on dig-
itized copies of Shakespeare’s First Folio (FF). We
have chosen the FF as our test text given its wide ac-
cessibility. Due to its canonicity, many FF copies have
been digitized in their entirety, significantly more so
than other early printed texts.
5
The FF further serves
4
https://docs.ultralytics.com/yolov5/tutorials/tips for b
est training results/
5
Sarah Werner documents forty-nine of 228 First Folios
that have been digitized in their entirety (https://sarahw
Detecting Manuscript Annotations in Historical Print: Negative Evidence and Evaluation Metrics
747

Figure 4: Example of manuscript doodle (right) and bleed-
through (left). In preparing data, the former is marked with
a bounding box while the latter is left unlabeled. From Der
teutsche Kalender. Meister Almansor spricht. Courtesy of
the Wellcome Collection.
as a suitable test case given the scarcity of handwrit-
ing in extant copies. While most copies used in our
evaluations contain some form of handwriting, only
one copy contains handwriting on more than 10% of
its 900+ pages. Thus, in comparison to other early
printed books that may contain an abnormally high
amount of handwriting (e.g., herbals or devotionals),
the FF serves a suitable case study for detecting rare
occurrences of handwriting in early print. In order to
further assess model accuracy, no pages from the FF
(or any edition of a Shakespeare Folio) are used in the
training data. The FF serves only as a test set.
We use two test data sets, a single-Folio set and a
multi-Folio set, to account for different bibliographic
search tasks. In locating annotated pages in digitized
books, researchers may be interested in examining
only one large book or comparing the proportion of
manuscript annotations among several books. Addi-
tionally, library catalogers may be interested in de-
erner.net/blog/digitized-first- folios/). We downloaded
the copies used in this paper from First Folios Compared
(https://firstfolios.com/view-first-folios).
termining the proportion of manuscript annotations
across an entire collection, as well as in each indi-
vidual book. Thus, we utilize these two test sets to
account for possible bibliographic research tasks as
well as to assess model accuracy when deployed on
one versus many books.
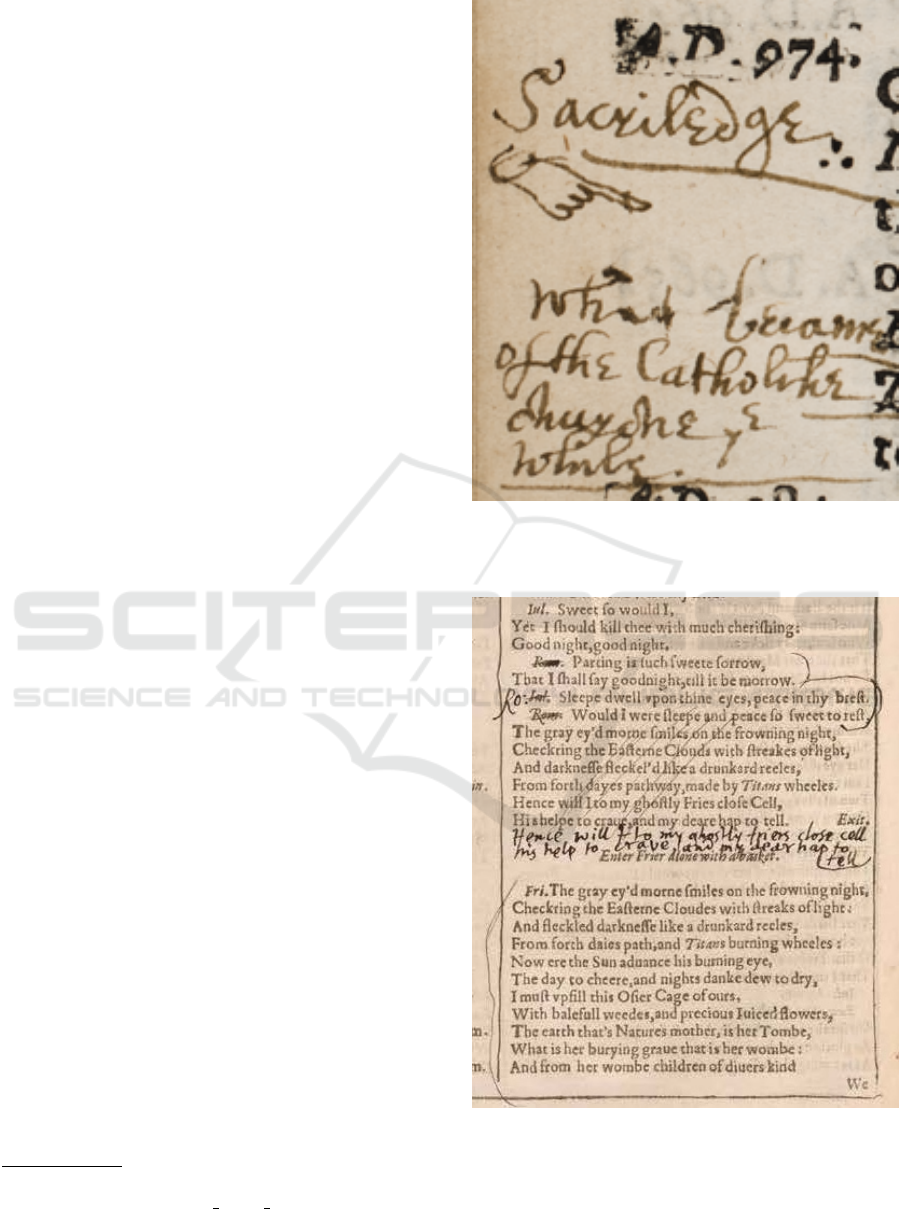
The single-Folio set consists of one FF copy from
the Free Library in Philadelphia, Pennsylvania, USA.
We have selected this copy as an individual test text
for two reasons. First, with the exception of a FF held
at Meisei University (for which hi-res open-access
images are unavailable), this is the most heavily-
annotated digitized FF. Of its 918 digitized images
(including front and back covers), exactly 330 con-
tain handwriting. As such, the copy provides a wealth
of positive sample images to test for model accuracy.
Additionally, as a result of the handwriting being at-
tributed to the poet John Milton (Bourne and Scott-
Warren, 2002; McDowell, 2021), bibliographic re-
searchers have documented all of the contained hand-
writing, thereby providing a ground truth for measur-
ing model accuracy.
The multi-Folio test set is comprised of ten digi-
tized FFs. They are curated from the Auckland Public
Library, Oxford University Bodleian Library, Cam-
bridge University Kings College Library, Manch-
ester University John Rylands Library, State Library
of New South Wales, National Library of Scot-
land, Saint-Omer Library, Folger Shakespeare Li-
brary, Free Library of Philadelphia, and W
¨
urttemberg
State Library. These ten were chosen by hand and
intended to cover a range of manuscript annotation
proportions. Some are heavily annotated while others
contain nearly no handwriting.
3 METHOD
Using a Google Colab notebook, we train one
YOLOv5 model for each of the three training sets
described above. Although individual image dimen-
sions vary, no image falls under 640 pixels high, and
so we adopt this size for training our YOLOv5 mod-
els. We train each model for a maximum 250 epochs
with early stopping enabled. We choose a 250 epochs
as preliminary training showed model accuracy and
loss to level out at this point. Once trained, we test all
three models on both the single-Folio and multi-Folio
test sets.
We determine each model’s accuracy by calculat-
ing the mean average precision (mAP) for both test
sets. We eschew intersection over union (IoU) in
favor of mAP as an evaluation metric given we are
principally concerned with the model’s ability to de-
ICPRAM 2024 - 13th International Conference on Pattern Recognition Applications and Methods
748

tect any handwriting on a given page rather than its
ability to accurately delineate the boundaries of that
handwriting. mAP builds from the standard precision
equation, where TP is the total number of true posi-
tives and FP is the total number of false positives in
the model output:
Precision =
T P
T P + FP
(1)
With this formula, we calculate an average precision
for each page in the model output. We then use these
precision values to calculate the model’s mAP using
the following formula, where AP
k
is the average pre-
cision of each class k and n is the number of classes:
mAP =
1
n
k=n
∑
k=1
AP
k
(2)
Given we are concerned with page-level accuracy
rather than object-level accuracy, we calculate mAP
for each page image in the model’s output. We cal-
culate mAP cumulatively in descending order for the
top 100 page images returned by each model. As
expected, our models regularly identify multiple in-
stances of handwriting on a single page. We therefore
take the confidence level for the highest-ranked object
on a given page as model’s prediction that the entire
page has handwriting. We ignore additional detected
objects on a given page following the highest-ranked
object from that page.
Though we calculate mAP the same for each
model and set, practical limitations demand a modi-
fication in how we calculate recall between the two
test sets. For both sets, we use the standard recall for-
mula, where TP is the total number of true positives
and FN is the total number of false negatives in the
model output:
Recall =
T P
T P + FN
(3)
We calculate recall for the single-Folio test set us-
ing Bourne and Scott-Warren’s documented list of all
330 pages with handwriting in the Philadelphia FF
(Bourne and Scott-Warren, 2002). To calculate re-
call in the multi-Folio set, we pool different system
outputs as is common in information retrieval evalua-
tions. Given the implausibility of manually combing
a test set of 9100+ images for each manuscript anno-
tation, we compile a master list of every true positive
image from each model’s top 100 results for the multi-
Folio set. From here, we calculate the percentage of
true positive images identified by an individual model
out of that master list.
We also explore alternative methods for evaluating
model accuracy on the multi-Folio set. More specifi-
cally, we calculate the mAP for each FF in the multi-
Folio set. To do this, we count the number of true
positive and total positive results for each FF from
the top 100 page images returned by a given model
and use those values to calculate individual mAPs for
each FF in the multi-Folio test set. This marks the
model’s mAP for detecting handwriting in an individ-
ual book when tested on a collection of books. Scor-
ing this way can be useful for researchers or librarians
who want to determine the likelihood or proportion of
annotations in each individual book across an entire
collection.
Finally, we consider the makeup of false posi-
tives identified by each model, specifically the num-
ber of print features and non-print features (e.g., book
damage) each model falsely identified as handwriting.
Through this, we aim to further explore how negative
sample images may affect not only a model’s preci-
sion and recall but also what features it erroneously
identifies as positive instances.
4 RESULTS
To reiterate: Model 1 is trained on a dataset in which
the number of negative sample images equals 10% the
number of labeled positive sample images; Model 2
is trained on a dataset with an equal number of neg-
ative sample and positive sample images; Model 3 is
trained on a dataset in which there are twice as many
negative sample images as positive sample images.
All three models contain the same number of positive
sample images.
Table 1: Model mAP and recall for single-Folio set.
mAP Recall
Model 1 .32 .14
Model 2 .39 .14
Model 3 .33 .13
Table 2: Model mAP and recall for multi-Folio set.
mAP Recall
Model 1 .33 .57
Model 2 .52 .74
Model 3 .5 .77
Table 1 and Table 2 display mAP and recall rates
for each model tested on the single-Folio and multi-
Folio sets respectively. While the difference in preci-
sion and recall between each of the models is, admit-
tedly, marginal, Model 2 is clearly the most accurate
of all three. Model 1 scores the lowest in mAP and re-
call on both test sets. By comparison, Model 3 scores
higher than Model 1 but nevertheless scores lower in
mAP than Model 2 on both test sets.
Detecting Manuscript Annotations in Historical Print: Negative Evidence and Evaluation Metrics
749

Indeed, on the multi-Folio set, Model 3 mAP lev-
els off with a small improvement in recall. This sug-
gests that Model 3 may identify more true positive
page images in the multi-Folio set than Model 2, but
those images are identified with a lower overall confi-
dence value. In regards to the single-Folio set, Model
3 scores lower in mAP and recall than Model 2. In
fact, Model 3 performs relatively similar to Model
1. In other words, while the greatest difference in
mAP and recall for both test sets is generally between
Model 1 and Model 2, Model 3 generally shows a de-
crease or leveling off of mAP and recall from Model
2.
Table 1 and Table2 thus suggest that increasing the
number of negative sample images during training im-
proves model mAP and recall with a certain threshold.
We speculate that simply increasing negative sample
images interacts poorly with the ODM’s threshold es-
timation. Even though the training set for Model 3
most closely replicates the proportion of annotated
and non-annotated pages in early printed books, this
model’s improvement over Model 2 was largely non-
existent, if not negative.
Table 3: mAP for multi-Folio test set organized by book.
Model 1 Model 2 Model 3
Auckland .22 .19 .21
Manchester .02 .03 .05
Philadelphia .25 .28 .2
New South Wales .16 .13 .14
W
¨
urttemberg 0 .03 .04
NL Scotland .03 .05 .06
St. Omer .13 .05 .11
Bodleian .01 .02 .05
Cambridge 0 .01 0
Folger .04 .03 .03
Mean .09 .09 .09
Table 3 displays mAP for each individual book
from the multi-Folio set. The results in this table com-
plicate consideration of the impact of negative sample
images on model accuracy after a certain threshold.
While mAP improves with each successive model in
regard to certain books, e.g., the Scotland and Manch-
ester FFs, model mAP shows no improvement in re-
gards to the Cambridge FF, even deterioration of ac-
curacy in regard to the Auckland FF. A cursory ex-
amination of these four books suggests that both the
Auckland and Manchester FF contain significantly
more manuscript annotations than either the Cam-
bridge of Folger FFs—although neither of the for-
mer possess anywhere near the quantity found in the
Philadelphia FF. The drastically minimal amount of
handwriting in copies like the Cambridge and Folger
FFs may affect model performance.
While book-specific scores in Table 3 may suggest
increasing the amount of negative sample images dur-
ing training fails to significantly improve model accu-
racy, it is possible that not enough negative sample
images are utilized, even in Model 3. For instance, a
quick survey of the digitized Folger FF suggests less
than fifteen of the book’s pages contain any form of
handwriting (out of 900+ total pages). If less than
one percent of a test set (here, the Folger FF) is com-
prised of true positives, then none of the training sets
used for the present experiments approaches replicat-
ing the proportion of positive and negative samples
found in the test set. In this way, all three of the
models may be overtrained on handwriting samples,
and so expect a significantly larger quantity of posi-
tive sample images than actually exists in each book
comprising the multi-Folio test set. Book-specific rel-
evance feedback and pseudo-relevance feedback may
be effective in fine-tuning ODMs to resolve this issue.
Notably, the mAP for the Philadelphia FF in Ta-
ble 3 ostensibly confirms scores in Table 1. When
testing on only the Philadelphia FF, mAP improves
most between Models 1 and 2, but then plateaus or
decreases between Models 2 and 3. Table 3 displays
this same trend in regards to the Philadelphia FF. This
suggests that, when comparing model accuracy in
terms of mAP, testing models on a collection of books
and calculating mAP book-by-book from that output
may be a roughly equivalent indicator of comparative
model precision as testing models on each book indi-
vidually. Of course, further experimenting is needed
to confirm this.
Table 4 and Table 5 list the total number and
makeup of false positives in model outputs for each
test set. “Print” refers to pages without handwriting
in which the model misclassifies a print feature (e.g.,
page number, signature mark, italic type) as handwrit-
ing. “Non-Print” signifies pages without handwrit-
ing in which the model misclassifies non-print fea-
tures (e.g., foxing, worming, page tears) as handwrit-
ing. Both tables show how the makeup of false pos-
itives changes with each model. For both the sin-
gle and multi-Folio sets, Model 1 largely—indeed,
almost exclusively—returns false positives that are
print. By comparison, Models 2 and 3 not only in-
creasingly return fewer false positives, they increas-
ingly misidentify non-print features as handwriting
rather than print.
We suspect this change in the amount and makeup
of false positives identified by each model to be in-
fluenced by the nature of negative sample images se-
lected for training. When compiling negative sam-
ple images for each training set, we sought out books
ICPRAM 2024 - 13th International Conference on Pattern Recognition Applications and Methods
750

Table 4: Makeup of false positives for the single-Folio set.
Print Non-Print Total Pages
Model 1 51 1 52
Model 2 30 3 33
Model 3 17 8 25
Table 5: Makeup of false positives for the multi-Folio set.
Print Non-Print Total Pages
Model 1 47 7 54
Model 2 21 19 40
Model 3 23 15 38
whose pages represent a wide array of typefaces, page
layouts, genres, and even contain commonly known
false positive features, such as ink bleed-through. We
admittedly gave less attention to selecting images of
pages affected by the wear and tear of time. Thus,
the training sets successively contain a smaller pro-
portion of images that display features such as foxing,
worming, or page tears. Such features are increas-
ingly misclassified in each successive model as hand-
writing. Obviously, curating negative sample images
with these features may likely eliminate such false
positives from the output. Locating these specific fea-
tures, however, is difficult.
Notably, Table 5 matches the trend shown in Ta-
ble 1 and Table 2. The greatest drop in number of
false positives as well as misclassified print features
is between Models 1 and 2, with a more negligible
difference between Models 2 and 3.
5 DISCUSSION
5.1 Conclusion
In this paper, we investigate the effect of different
proportions of positive and negative sample images
during training on ODM precision in bibliographic
search tasks. We train three YOLOv5 ODMs us-
ing training sets with different proportions of posi-
tive and negative sample images. We then test each
model on a single-Folio and multi-Folio test set. Our
comparison of model mAP and recall scores for each
test set suggests the model trained on a equal num-
ber of positive and negative sample images is the
most accurate in detecting handwriting in historical
print. The model trained on a dataset with 10% the
number of negative sample as positive sample im-
ages scores lowest. The model trained on a dataset
with twice as many negative sample as positive sam-
ple images shows negligible improvement–and even
decreased accuracy at times—in comparison to the
model trained on an equivalent number of negative
and positive sample images.
Finally, we investigate evaluation metrics of ODM
accuracy in bibliographic search tasks. We calcu-
late mAP for each book in the multi-Folio set as
a way of measuring the likelihood or proportion of
manuscript annotations in each book across a collec-
tion. While model accuracy varied on each book,
comparing model scores with those from the single-
Folio test set suggests this new evaluation metric may
be a roughly accurate measure of model accuracy
for bibliographic search tasks. We then consider the
makeup of false positives identified by each model on
both test sets in order to further measure how nega-
tive sample images may affect model precision and
recall. This final evaluation reinforces our findings in
the initial model score comparisons. Model 2 and 3
return the lowest number of false positives, as well
as increasingly smaller number of print features mis-
classified as handwriting. As before, the difference
between Models 2 and 3 is negligible.
Overall, our investigation suggests increasing the
quantity of negative sample images during training
may positively effect model precision and recall, with
a point of diminishing returns.
5.2 Outlook
This paper suggests that, when developing object de-
tection models for recognizing handwriting in print,
equalizing the quantity of negative and positive sam-
ple images during training produces the highest over-
all model mAP, assuming negative sample images
capture a wide array of possible false positives. Nev-
ertheless, the proximity of results between Models 2
and 3 may require further study. For example, a study
that quadruples the number of background images in
the training set or tests both models on other forms
of early print besides books (e.g., broadsheets, maps,
etc.) would be warranted to confirm our results.
Moreover, a greater focus on the makeup of neg-
ative sample images in training may be beneficial.
While we attempt to include negative sample im-
ages with features commonly identified false posi-
tives (e.g., bleed-through and physical damage) in our
training sets, locating such examples in digitized col-
lections is difficult, and so our sampling of such fea-
tures is limited. It may be worthwhile therefore to
focus on enlarging and diversifying the negative sam-
ple images with more examples of features such as
worming, foxing, and page tears. Considering data
augmentation’s promising results for correcting im-
balanced datasets in research, data augmentation of
negative sample images may serve as an interesting
Detecting Manuscript Annotations in Historical Print: Negative Evidence and Evaluation Metrics
751

means of acquiring samples with these scarce yet
problematic misclassified features.
As noted, book-specific fine-tuning with pseudo-
relevance feedback could also be effective. Finally,
we believe the techniques for retrieval and evaluation
developed here are worth systematic user studies with
bibliographical researchers.
ACKNOWLEDGEMENTS
This work was supported in part by the Andrew W.
Mellon Foundation’s Scholarly Communications and
Information Technology program. Any views, find-
ings, conclusions, or recommendations expressed do
not necessarily reflect those of the Mellon.
REFERENCES
Borji, A. (2018). Negative results in computer vision: A
perspective. Image and Vision Computing, 69:1–8.
Bourne, C. and Scott-Warren, J. (2002). “thy unvalued
Booke”: John Milton’s Copy of the Shakespeare First
Folio. Milton Quarterly, 56:1–85.
Kim, C., Kim, G., Yang, S., Kim, H., Lee, S., and Cho,
H. (2023). Chest x-ray feature pyramid sum model
with diseased area data augmentation method. In Pro-
ceedings of the IEEE/CVF International Conference
on Computer Vision (ICCV) Workshops, pages 2757–
2766.
Kusetogullari, H., Yavariabdi, A., Hall, J., and Lavesson,
N. (2021). DIGITNET: A Deep Handwritten Digit
Detection and Recognition Methods Using a New His-
torical Handwritten Digit Dataset. Big Data Research,
(23):1–13.
Marg
´
ocsy, D., Somos, M., and Joffe, S. (2018). The Fab-
rica of Andreas Vesalius: A Worldwide Descriptive
Census, Ownership, and Annotations of the 1543 and
1555 Editions. Brill, Leiden.
McDowell, N. (2021). Reading Milton reading Shakespeare
politically: what the identification of Milton’s First
Folio does and does not tell us. The Seventeenth Cen-
tury, 36(4):509–525.
Mondal, R., Malakar, S., Barney Smith, E. H., and Sarkar,
R. (2022). Handwritten english word recognition us-
ing a deep learning based object detection architec-
ture. Multimedia Tools and Applications, 81:975–
1000.
Moustapha, M., Tasyurek, M., and Ozturk, C. (2023). A
Novel YOLOv5 Deep Learning Model for Handwrit-
ing Detection and Recognition. International Journal
on Artificial Intelligence Tools, 32(4):1–33.
Nguyen-Mau, T.-H., Huynh, T.-L., Le, T.-D., Nguyen, H.-
D., and Tran, M.-T. (2023). Advanced augmenta-
tion and ensemble approaches for classifying long-
tailed multi-label chest x-rays. In Proceedings of the
IEEE/CVF International Conference on Computer Vi-
sion (ICCV) Workshops, pages 2729–2738.
Rao, A., Lee, J.-Y., and Aalami, O. (2023). Studying the im-
pact of augmentations on medical confidence calibra-
tion. In Proceedings of the IEEE/CVF International
Conference on Computer Vision (ICCV) Workshops,
pages 2462–2472.
Rezatofighi, H., Tsoi, N., Gwak, J., Sadeghian, A., Reid, I.,
and Savarese, S. (2019). Generalized intersection over
union: A metric and a loss for bounding box regres-
sion. In Proceedings of the IEEE/CVF Conference on
Computer Vision and Pattern Recognition (CVPR).
Saini, M. and Susan, S. (2023). Tackling class imbalance
in computer vision: A contemporary review. Artificial
Intelligence Review, 56:1279–1335.
Sherman, W. (2002). What Did Renaissance Readers Write
in Their Books? In Andersen, J. and Sauer, E., ed-
itors, Books and Readers in Early Modern England:
Material Studies, pages 119–137. University of Penn-
sylvania Press, Philadelphia.
Thabtah, F., Hammoud, S., Kamalov, F., and Gonsalves, A.
(2020). Data imbalance in classification: Experimen-
tal evaluation. Information Sciences, 513:429–441.
Werner, S. (2016). Digital First Folios. In Smith, E., edi-
tor, The Cambridge Companion to Shakespeare’s First
Folio, pages 170–184. Cambridge University Press,
Cambridge.
West, A. (2003). The Shakespeare First Folio: The History
of the Book. Oxford University Press, Oxford.
Wu, Y., Hu, Y., and Miao, S. (2021). Object Detection
Based Handwriting Localization. In ICDAR 2021
Workshop: Industrial Applications of Document Anal-
ysis and Recognition, pages 225–239.
Zou, Z., Chen, K., Shi, Z., Guo, Y., and Ye, J. (2023). Ob-
ject detection in 20 years: A survey. Proceedings of
the IEEE, 111(3):257–276.
ICPRAM 2024 - 13th International Conference on Pattern Recognition Applications and Methods
752
