
Segmentation and Classification of Dental Caries in Cone Beam
Tomography Images Using Machine Learning and Image Processing
Luiz Guilherme Kasputis Zanini
1 a
, Izabel Regina Fischer Rubira-Bullen
2 b
and F
´
atima de Lourdes dos Santos Nunes
3 c
1
Department of Computer Engineering and Digital Systems, University of S
˜
ao Paulo, S
˜
ao Paulo, Brazil
2
Department of Surgery, Stomatology Pathology and Radiology, University of S
˜
ao Paulo, Bauru, Brazil
3
School of Arts, Sciences and Humanities, University of S
˜
ao Paulo, S
˜
ao Paulo, Brazil
Keywords:
Image Processing, Machine Learning, Dental Caries, Segmentation, Classification, CBCT, ICDAS.
Abstract:
Dental caries are caused by bacterial action that demineralizes tooth enamel and dentin. It is a serious threat
to oral health and potentially leads to inflammation and tooth loss if not adequately treated. Cone Beam
Computed Tomography (CBCT), a three-dimensional (3D) imaging technique used in dental diagnosis and
surgical planning, can potentially contribute to detection of caries. This study aims at developing a com-
putational method to segment and classify caries in CBCT images. The process involves data preparation,
segmentation of caries regions, extraction of relevant features, feature selection, and training machine learning
algorithms. We evaluated our method performance considering different stages of caries severity based on the
International Caries Detection and Assessment System scale. The best results were achieved using a Gaussian
filter with a multimodal threshold with a convex hull for the region of interest segmentation, feature selection
via Random Forest, and classification using a model based on k-nearest neighbors algorithm. We achieved
outcomes with an accuracy of 86.20%, a F1-score of 86.18%, and a sensitivity of 83.35% in multiclass clas-
sification. These results show that our approach contributes to the early segmentation and classification of
dental caries, thereby improving oral health outcomes and treatment planning.
1 INTRODUCTION
Dental caries compose a condition that significantly
impacts oral health, which can cause degradation of
enamel and dentin due to the action of bacteria present
in dental plaque. If not treated, this disease can
progress into the interior of the tooth, contacting the
dental pulp, where nerves and blood vessels are lo-
cated, leading to inflammation and potential tooth loss
(Rathee and Sapra, 2023).
Cone Beam Computed Tomography (CBCT) is
a technique that allows the acquisition of three-
dimensional (3D) radiographic images. This imaging
modality is widely employed for diagnostic purposes,
ranging from dental root canal treatments to the as-
sessment of tooth demineralization, issues related to
low bone density, and even the planning of surgical
procedures (Setzer et al., 2017). Furthermore, a po-
a
https://orcid.org/0000-0002-8344-3178
b
https://orcid.org/0000-0002-5069-9433
c
https://orcid.org/0000-0003-0040-0752
tential application of CBCT is caries diagnosis, es-
pecially in proximal caries, which is a dental lesion
between adjacent teeth, often hidden from direct view
and better indicated by dental X-rays (Felemban et al.,
2020). As such, it is vital to identify caries lesions
within CBCT images, and once identified, they should
be incorporated into the final CBCT examination re-
ports.
Several studies have explored various methods for
locating and classifying diseases in computed tomog-
raphy images. For example, a study conducted by
(Ezhov et al., 2021) used the U-Net network (Ron-
neberger et al., 2015) to detect dental caries. In (Chen
and Zhang, 2017), a segmentation process was pro-
posed, employing advanced image processing tech-
niques along with a threshold to segment the affected
area. Meanwhile, the study by (Ahmed et al., 2017)
combined unsupervised machine learning techniques,
such as the K-means clustering algorithm, to gener-
ate segmentations. However, these approaches mainly
concentrated on discerning the disease’s presence or
absence. Upon our analysis, we observed few studies
428
Zanini, L., Rubira-Bullen, I. and Nunes, F.
Segmentation and Classification of Dental Caries in Cone Beam Tomography Images Using Machine Learning and Image Processing.
DOI: 10.5220/0012365300003657
Paper published under CC license (CC BY-NC-ND 4.0)
In Proceedings of the 17th International Joint Conference on Biomedical Engineering Systems and Technologies (BIOSTEC 2024) - Volume 2, pages 428-435
ISBN: 978-989-758-688-0; ISSN: 2184-4305
Proceedings Copyright © 2024 by SCITEPRESS – Science and Technology Publications, Lda.

conducting classification after segmentation, as well
as a notable absence of standardization in lesion clas-
sification.
Therefore, given this gap, this study aimed to seg-
ment and classify severity levels of lesions. Fig-
ure 1 illustrates the variation in lesions at different
stages, increasing the complexity of diagnosing these
affected areas. Accurately identifying the level of le-
sion severity plays a fundamental role in applying the
appropriate treatment to patients with carious teeth.
Our method segments the affected regions and
subsequently classifying them based on the ICDAS
score. To achieve this purpose, we employed a set of
image processing techniques specifically adapted for
images acquired through CBCT. The second step in-
volves feature extraction from these regions. Then,
we proceeded with the selection of the most relevant
features, and finally, we trained machine learning al-
gorithms to perform the classification. Therefore, the
contributions of this work:
• A set of image processing techniques developed
specifically to segment regions affected by caries
in CBCT images;
• Classification of the region of interest based on a
standard score used by dentists (ICDAS);
• Extraction of relevant features from the images;
• Evaluation of machine learning algorithms in or-
der to classify different levels of the disease.
These contributions represent significant advance-
ments in the development of an effective system for
the segmentation and classification of lesioned re-
gions, particularly in images obtained through CBCT.
2 RELATED WORK
In the literature, there are studies that aimed to clas-
sify and segment caries in different imaging modali-
ties. In this section, we highlight approaches involv-
ing feature extraction and techniques similar to those
used in our approach.
The research studies (Jusman et al., 2022a), (Jus-
man et al., 2022b), (Singh and Sehgal, 2017) used
features extracted from x-ray images with the pri-
mary goal of classifying dental cavities. One of the
methods applied the Gray-Level Co-occurrence Ma-
trix (GLCM) to extract texture details, aiming to spot
variations in grayscale shades within the images (Jus-
man et al., 2022a). In (Jusman et al., 2022b), the au-
thors explored the extraction of shape characteristics
using Hu Moments to achieve insights about the tooth
geometry and categorize images with lesions. Fur-
thermore, the study (Singh and Sehgal, 2017) inves-
tigated the classification of cavities using the Radon
transformation and Discrete Cosine Transform to ex-
tract patterns about pixel intensities in different direc-
tions.
In a study utilizing periapical images (Geetha
et al., 2020), the authors segmented the affected area
and extracted features from this region, referred to as
texture-based analysis. These features included pa-
rameters such as contrast, correlation, energy, homo-
geneity, mean, entropy, and root mean square. The
study (Sornam and Prabhakaran, 2017) used periapi-
cal images, and GLCM was applied to extract fea-
tures from grayscale images, with a linearly adaptive
optimization using a particle swarm optimization al-
gorithm in conjunction with a neural network to opti-
mize the learning rate parameter. In the study (Datta
et al., 2019), the Particle Swarm Optimization (PSO)
algorithm was employed to divide the image into mul-
tiple regions or segments, enabling the identification
of the intersection of two lines, which detects restora-
tions and caries in periapical images.
Panoramic radiographs served as the base for the
studies (Al Kheraif et al., 2019), (Verma et al., 2020),
(Lakshmi and Chitra, 2020). In (Al Kheraif et al.,
2019), a cavity detection method was implemented
using Sobel edge detection and a deep convolutional
neural network (CNN). In (Verma et al., 2020), a
CNN was employed to extract image features, and
a Support Vector Machine (SVM) was used to clas-
sify images as normal or abnormal based on these
features, including Haralick and Hu moments. The
study (Al Kheraif et al., 2019) applied various image
enhancement techniques and compared segmentation
approaches with the hybrid graph cut method.
Many of these studies do not assume the varia-
tion in caries severity levels, limiting themselves to
only identifying the presence or absence of the dis-
ease. Furthermore, these approaches tend to focus
on isolated techniques without integrating informa-
tion about the nuances of gray levels of the image and
tooth shapes. Based on the analyses and discussions
of the presented studies, we propose an approach that
uses image processing segmentation and feature ex-
traction to classify the intensity of the affected area.
3 MATERIAL AND METHODS
As depicted in Figure 2, our approach is split into sev-
eral stages. Firstly, a preprocessing step is responsi-
ble for preparing the initial image by removing noise
and enhancing relevant features. Next, we highlight
Segmentation and Classification of Dental Caries in Cone Beam Tomography Images Using Machine Learning and Image Processing
429
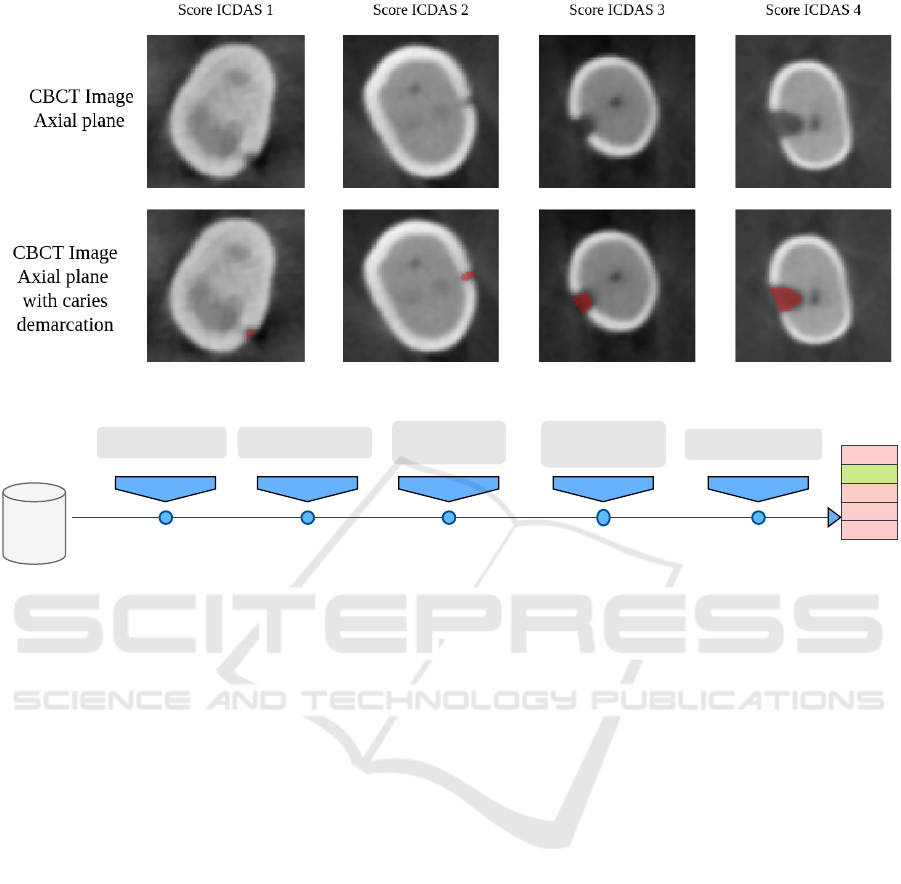
Figure 1: Examples of different levels of caries using the score International Caries Detection and Assessment System (IC-
DAS).
CBCT
exam
Stage 1 Stage 3
Pre processing
Segmentation
Feature
Extraction
Dimensionality
reduction
Stage 5
Training Models
Stage 2 Stage 4
0 ICDAS
1 ICDAS
Score
2 ICDAS
3 ICDAS
4 ICDAS
Figure 2: Steps of the proposed approach for image classification.
the lesion region segmentation stage, where we iden-
tify the affected area. The third stage performs the
feature extraction, where essential information is ob-
tained from both the segmentation and the original
image. Then, a feature selection stage identifies the
most relevant features. Lastly, machine learning al-
gorithms are trained to classify the caries considering
different severy levels.
3.1 Materials
The dataset used in this study contains 493 images
obtained from CBCT scans, each one classified by ex-
perts according to the ICDAS. ICDAS is an adopted
system by oral healthcare professionals for assessing
and categorizing the state of dental caries (Gugnani
and Pandit, 2011). This system provides standard-
ization in detecting and recording dental caries le-
sions, assigning a classification that represents differ-
ent stages of the disease. Each image has a score clas-
sifying the image according to Figure 1. The score
ranges from zero, indicating the absence of caries, to
1, 2, 3, and 4 values indicating greater severity of le-
sions.
The distribution of images about ICDAS classifi-
cations applied on an image is as follows: 66 images
were classified as ICDAS 0, indicating the absence
of caries, 32 images received the ICDAS 1 classifi-
cation, 50 images were classified as ICDAS 2, 151
images were classified as ICDAS 3, and 194 images
were classified as ICDAS 4. The image base used
in the experiments of this project was provided by the
Faculty of Dentistry of Bauru of the University of S
˜
ao
Paulo and approved by the Ethics Committee.
3.2 Methods
During the initial image processing phase (Figure 3),
the focus was enhancing visual quality and sharpen-
ing image details. Two techniques were employed:
first, a Gaussian filter was applied to reduce noise
originating from radiation capture and detection. Af-
ter, Gamma correction was used to boost contrast,
thereby enhancing details within the images, making
them easier to analyze and interpret.
The next stage of the process involved the seg-
mentation of dental structures, which begins with an
application of multimodal thresholding aiming at dis-
tinguishing three tooth structures. We search for two
local minima within the image histogram. Utilizing
these minima, we employed the multimodal thresh-
olding method to segment the resulting structures.
Lower values correspond to the background, interme-
diate values are related to dentin and higher values
HEALTHINF 2024 - 17th International Conference on Health Informatics
430
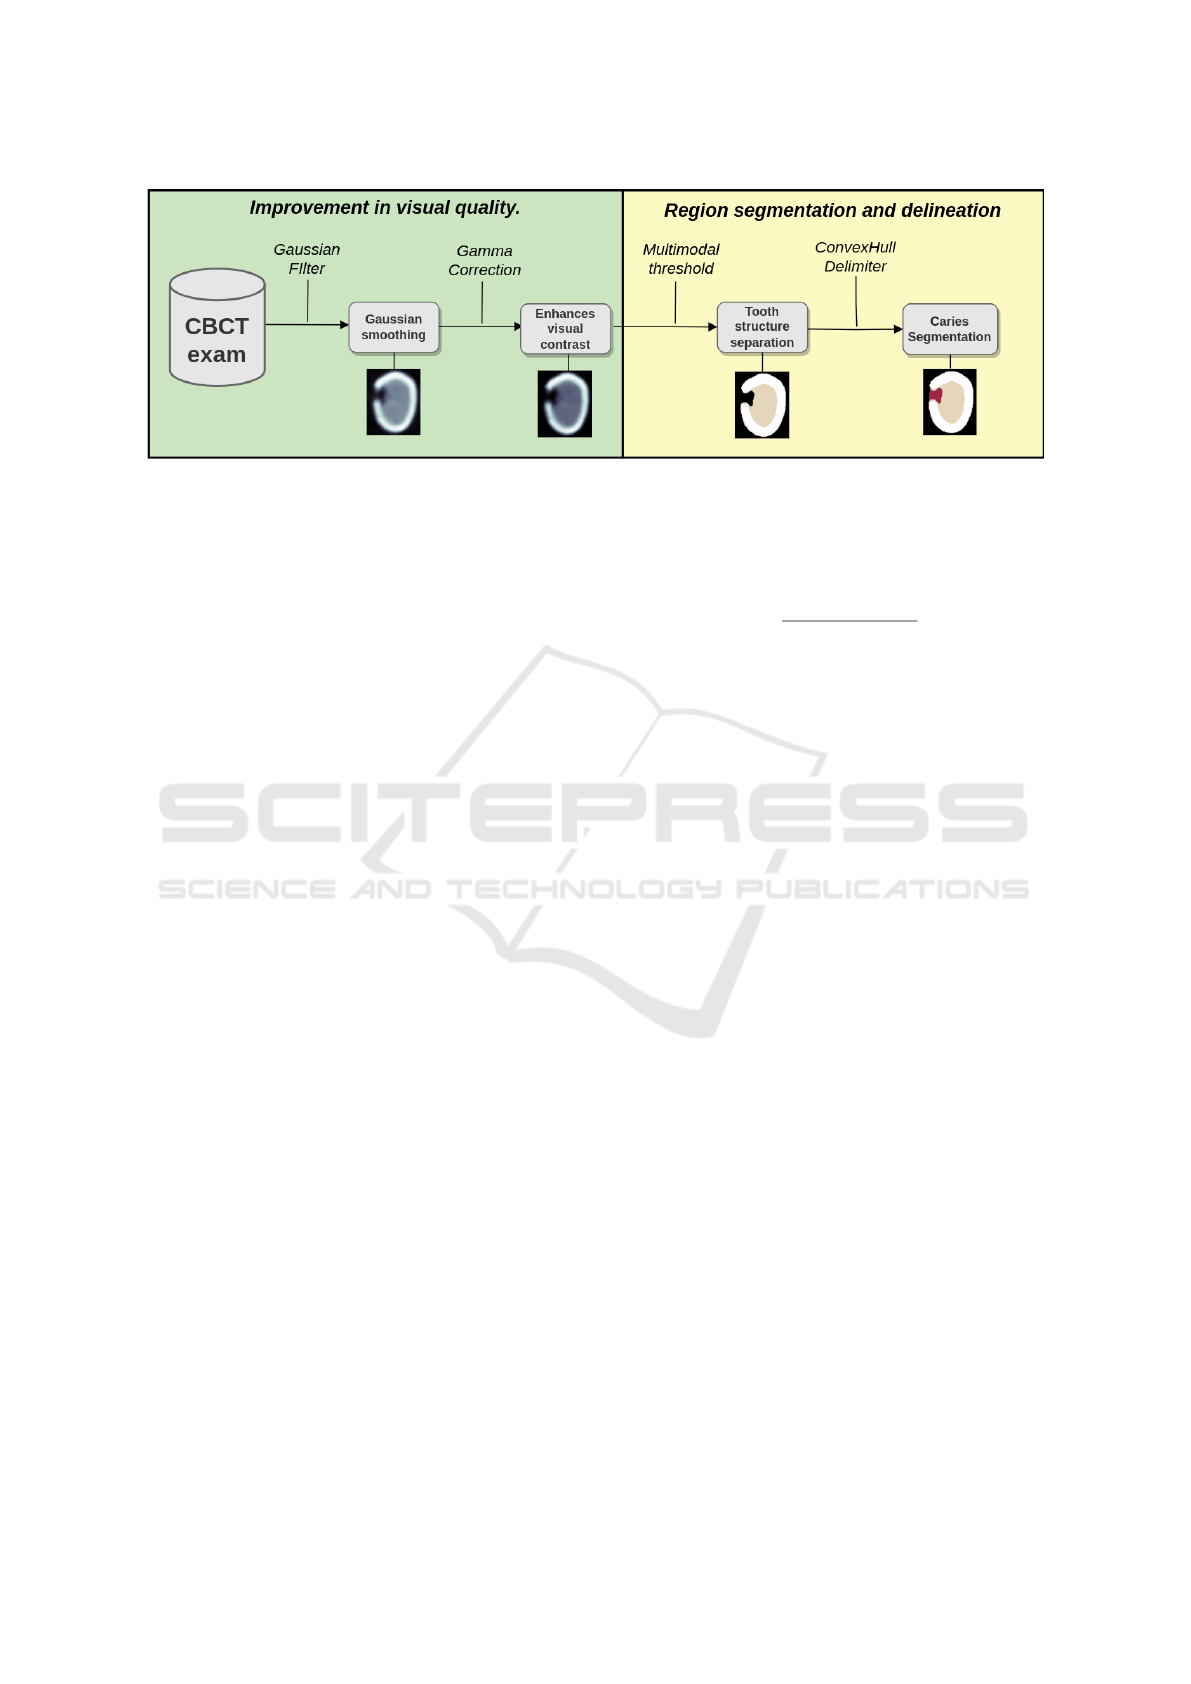
Figure 3: Preprocessing techniques and segmentation techniques to enhance CBCT images.
indicate enamel.
After calculating the segmentation’s contour and
identifying the points covering the region, we applied
the convex hull method. This technique discerns the
intersection of all convex sets within the segmenta-
tion. Subsequently, we merged the original segmenta-
tion with the convex hull area, giving rise to the poten-
tial regions with caries, forming the red area (Figure
3). The carie region is delimited by this procedure in
all the images that compose the CBCT tooth volume.
The feature extraction stage begins with comput-
ing Haralick features, Hu Moments, and shape fea-
tures. Haralick features aim to capture information
about the dental surface’s texture. These features are
achieved by calculating the GLCM from the prepro-
cessed original image, which represents the spatial re-
lationship between pixels with similar gray levels in
the image. The features extracted from this process
include numerical values that describe different as-
pects of the tooth’s texture, such as energy, contrast,
correlation, and homogeneity, among others (L
¨
ofstedt
et al., 2019).
Hu Moments are attributes designed to record
shape or geometry-related information in the image
(Prokop and Reeves, 1992). These parameters are
derived from image segmentation, which can be ex-
tended to the tooth’s structure and are characterized
by their scale, rotation, and reflection invariance.
Therefore, in addition to textural information, precise
data about the tooth’s shape can be obtained.
Lastly, shape features obtained after caries seg-
mentation focuses on analyzing the geometry of the
region of interest (caries), containing attributes such
as area, perimeter, circularity, and eccentricity, pro-
viding a description of the overall shape of the region
(Mingqiang et al., 2008).
Data normalization was performed using the
”min-max” technique, which ensures that the features
have the same relative importance during analysis, es-
pecially when the original data has different scales.
The equation 1 represents this procedure, where x is
the value of the feature to be normalized, and x
′
is the
result of this operation.
x
′
=
x − min(x)
max(x) − min(x)
(1)
The next step involves the reduction of dimension-
ality in which three distinct methods are applied to
form different sets of features.
The first method is Principal Component Anal-
ysis (PCA), which aims to reduce the dimensional-
ity of the dataset by performing feature fusion, trans-
forming it into a simplified new set (Bro and Smilde,
2014). PCA accomplishes this reduction by identify-
ing linear combinations of the original features that
maximize data variance while preserving relevant in-
formation as much as possible.
The second method adopts the Random Forest
(RF) technique to evaluate the importance of each fea-
ture in order to select the more relevant ones. RF is a
machine learning algorithm capable of estimating the
relevance of variables by minimizing the impurity of
their nodes (Breiman, 2001). At the end of this pro-
cess, each feature receives a relevance score, which
allows selecting of the most informative features for
subsequent analysis.
Finally, the Chi-squared test considers the rela-
tionship between target variables and the extracted
features. This statistical test determines if there is
a statistically significant relationship between target
variables and the used features, allowing the identi-
fication of the most relevant features for the specific
task.
In the last phase of this process, we evaluate
a variety of inductive algorithms, which encompass
RF, Naive Bayes (NB), K-Nearest Neighbors (KNN),
Support Vector Machine (SVM), logistic regression
(LR), and XGBoost (XG). This variety of algorithms
offers a wide range of techniques, allowing us to
explore different perspectives and approaches. The
Segmentation and Classification of Dental Caries in Cone Beam Tomography Images Using Machine Learning and Image Processing
431

multi-class classification approach was chosen to en-
hance our analysis, allowing for more precise dif-
ferentiation between various categories within the
dataset. Thus, our results benefit from increased ro-
bustness and accuracy, helping us to identify the most
suitable model for our specific analytical task, while
considering the unique challenges and requirements
of dental structure image analysis.
3.3 Evaluation Process
The evaluation process involves using different com-
binations of techniques to consider four distinct
datasets. The first dataset contains all the original
features. Principal Component Analysis (PCA) is ap-
plied to reduce dimensionality and forms the second
dataset. The third dataset is created by using RF al-
gorithm to select features, and the fourth dataset is
created using the Chi-squared technique to select fea-
tures.
We set the PCA algorithm to retain features that
explain up to 90% of the data variance, which is
a common approach to reduce dimensionality while
preserving most of the information. In the case of
feature selection with the RF algorithm, we chose pa-
rameters to maintain features to represent up to 90%
importance of features that are provided by the al-
gorithm. Finally, the Chi-squared test generates a p-
value, and features with a p-value less than 0.05 were
considered.
We employed a stratified 5-fold cross-validation
method to assess the model’s performance with five
distinct metrics. In this process, the dataset is divided
into five equal segments, with each segment repre-
senting 20% of the total data. The stratified approach
guarantees that the distribution of five classes remains
across these five segments. During each iteration, four
of these stratified segments (80% of the data) are uti-
lized for training, while the remaining fifth segment,
containing around 20% of the data, takes its turn as
the test set in a rotating technique.
The metrics generated for performance evaluation
include precision, specificity, recall, F1, and accuracy.
These metrics provide a comprehensive assessment of
how well the model performs the classification task,
helping to determine its effectiveness and ability to
handle different scenarios.
To evaluate the best model compared to other
models, the McNemar test was employed to identify
if there is a significant difference between the best
results obtained with each approach. The McNemar
test is a statistical tool for determining whether two
different approaches have statistically distinct perfor-
mances, aiding in selecting the strategy (Japkowicz
and Shah, 2015). The calculation of the χ
2
statistic is
depicted in Equation 2.
χ
2
=
(|b − c|− 1)
2
b + c
(2)
In Equation 2, the variable b indicates how many
times the first approach was correct while the second
one was incorrect, whereas variable c represents how
many times the second approach was correct while
the first one was incorrect. These values are obtained
by comparing the predictions of each of the models.
The χ
2
statistic, computed using Equation 2, is then
compared to a chi-squared distribution to derive the p-
value, allowing for the evaluation of the statistical sig-
nificance of the disparities between the approaches.
4 RESULTS AND DISCUSSION
In this section, we conducted a comparative analysis
of the generated data, inductive algorithms, and re-
lated studies and concluded with a final discussion.
4.1 Comparison Between Data
In the feature selection process, there was a reduc-
tion of the dataset from 100% of the total features to
72% (using RF), 28% (using Chi-squared), and 25%
(using PCA). It is important to note that PCA is an
unsupervised method in which feature selection does
not consider class labels, unlike Chi-squared and RF,
which are supervised methods.
The performance of the six inductive algorithms
on four different datasets is presented in Table 1. The
evaluation metrics include accuracy, which quantifies
the proportion of correct model predictions, and F1-
score, which combines precision and recall. It is im-
portant to note that none of the classifiers performed
best when using the Chi-squared technique among the
analyzed datasets. This suggests that the Chi-square
approach may not be the most appropriate when the
data does not directly represent the relationship be-
tween the features and the target variable, indicating
possible dependencies among the features.
When evaluating the four datasets (Origin, PCA,
Chi, RF), it was identified that the original set ob-
tained the best results in three of the six algorithms
tested according to Table 1. The feature selection of
the RF algorithm stood out in two of the six induc-
tive algorithms. This pattern suggests that a signifi-
cant portion of the extracted features were essential to
achieving the best results with both the RF algorithm
and the original dataset, considering that RF reduced
the dataset to 72% of its original size. However, the
HEALTHINF 2024 - 17th International Conference on Health Informatics
432
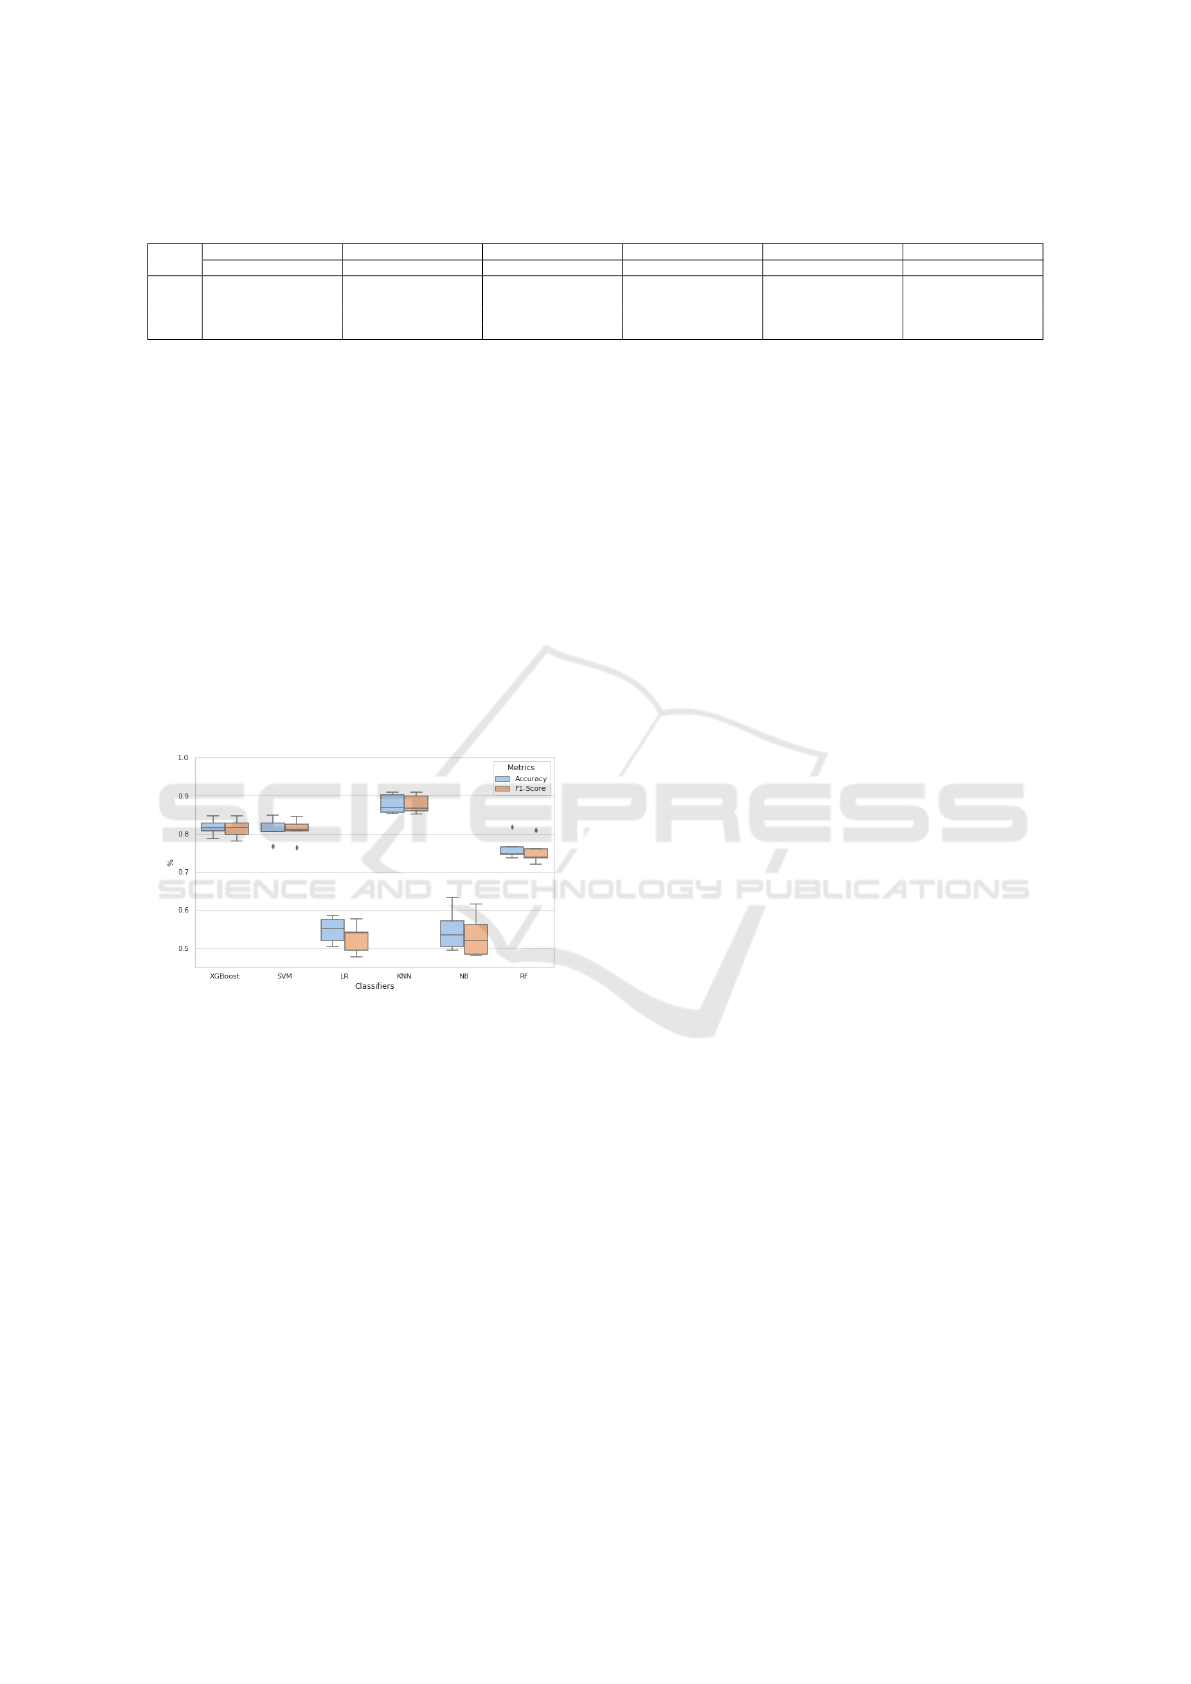
Table 1: Results obtained from the six algorithms varying across four datasets obtained from feature selection with accuracy
and average F1-score metrics.
Data
XG SVM Logistic Regression KNN NB RF
Accuracy F1-Score Accuracy F1-Score Accuracy F1-Score Accuracy F1-Score Accuracy F1-Score Accuracy F1-Score
Origin 81.75% 81.38% 80.94% 80.72% 54.76% 52.58% 80.73% 80.55% 43.01% 42.31% 76.26% 75.34%
PCA 74.43% 73.94% 79.30% 79.42% 46.65% 41.27% 76.67% 76.31% 54.79% 53.23% 68.78% 68.03%
Chi 75.46% 74.54% 75.05% 74.18% 52.72% 47.67% 76.47% 76.03% 45.03% 43.63% 64.49% 62.64%
RF 80.12% 79.63% 81.13% 81.07% 47.23% 40.81% 86.20% 86.18% 49.49% 48.83% 75.86% 74.91%
application of Chi-square and PCA to the distribution
of characteristics resulted in a considerable reduction
in the size of the datasets: 28% with Chi-square and
25% with PCA. This reduction in dataset size nega-
tively impacted performance.
4.2 Comparison Between Inductive
Algorithms
Figure 4 illustrates the variation in the performance
using cross-validation. The performance measure was
obtained through stratified 5-fold cross-validation. In
this representation of the data, we highlight the previ-
ous best results in Table 1 to the comparison between
the models. Furthermore, we highlight two metrics to
assess the overall performance of the classes.
Figure 4: BoxPlot of accuracy and f1-score for the best 6
algorithms.
The SVM and XG classifiers demonstrated simi-
lar performance f1-score 81.75% and 81.07%. How-
ever, SVM revealed the presence of outliers, as evi-
denced in Figure 4. NB, LR, and RF classifiers ex-
hibited lower performance. This difference in perfor-
mance can be attributed to the inherent characteristics
of these classifiers.
Finally, the KNN algorithm demonstrated the
best performance, standing out as the most effective
choice among the evaluated models. KNN, despite its
simplicity, is a non-parametric classifier, meaning it
makes no specific assumptions about the data distri-
bution and can manage non-linear relationships. Be-
sides that, KNN does not require complex adaptations
for multiclass classification, as it can perform this task
due to cluster choice, making it a robust and effective
option (Jiang et al., 2007).
4.3 Comparison over the Classification
Figure 5 shows four metrics over the five classes of
the problem. Sensitivity, which assesses the ability
to identify positive cases accurately, showed lower
performance when compared to other ICDAS stages,
with rates ranging between 60% and 70% for caries
classified as ICDAS 1 (Figure 5). These results point
to a significant challenge in detecting caries in the
early stages, which are critical for the effectiveness of
preventive measures. It is also relevant to note that the
models demonstrated more satisfactory performance
when classifying more advanced caries stages, such
as ICDAS 3 and ICDAS 4, highlighting a superior
ability to identify caries in these scenarios.
The XG model showed the best precision in clas-
sifying caries as ICDAS 1 (Figure 5). However,
when expanding the analysis to different levels of
caries severity, it was observed that XG achieved re-
sults similar to KNN, maintaining competitive perfor-
mance across different stages of caries.
The F1-score, a metric that balances sensitiv-
ity (recall) and precision, demonstrated that KNN
achieved the best results across different caries stages
(Figure 5). This analysis indicates that, although pre-
cision and sensitivity may vary between classifiers
considering different severity levels of caries, F1-
score considers both aspects and provides a balanced
performance assessment.
The analysis between classifiers was conducted
using the McNemar test to assess the difference in
performance between the best model (KNN) and the
other models. This test was performed to determine
if, in each test fold, the models showed a statistically
significant difference in performance compared to the
best model.
The results showed that, compared to KNN, all
models had a p-value below 0.05, indicating a sig-
nificant difference in performance, except XG. In the
case of XG, only one of the data divisions had a p-
value of 0.103 in the comparison between XG and
KNN, while the other four divisions had p-values be-
low 0.05. This means there is only a difference be-
tween XG and KNN, and in general, KNN outper-
forms all other models and stands out as the best op-
tion.
Segmentation and Classification of Dental Caries in Cone Beam Tomography Images Using Machine Learning and Image Processing
433
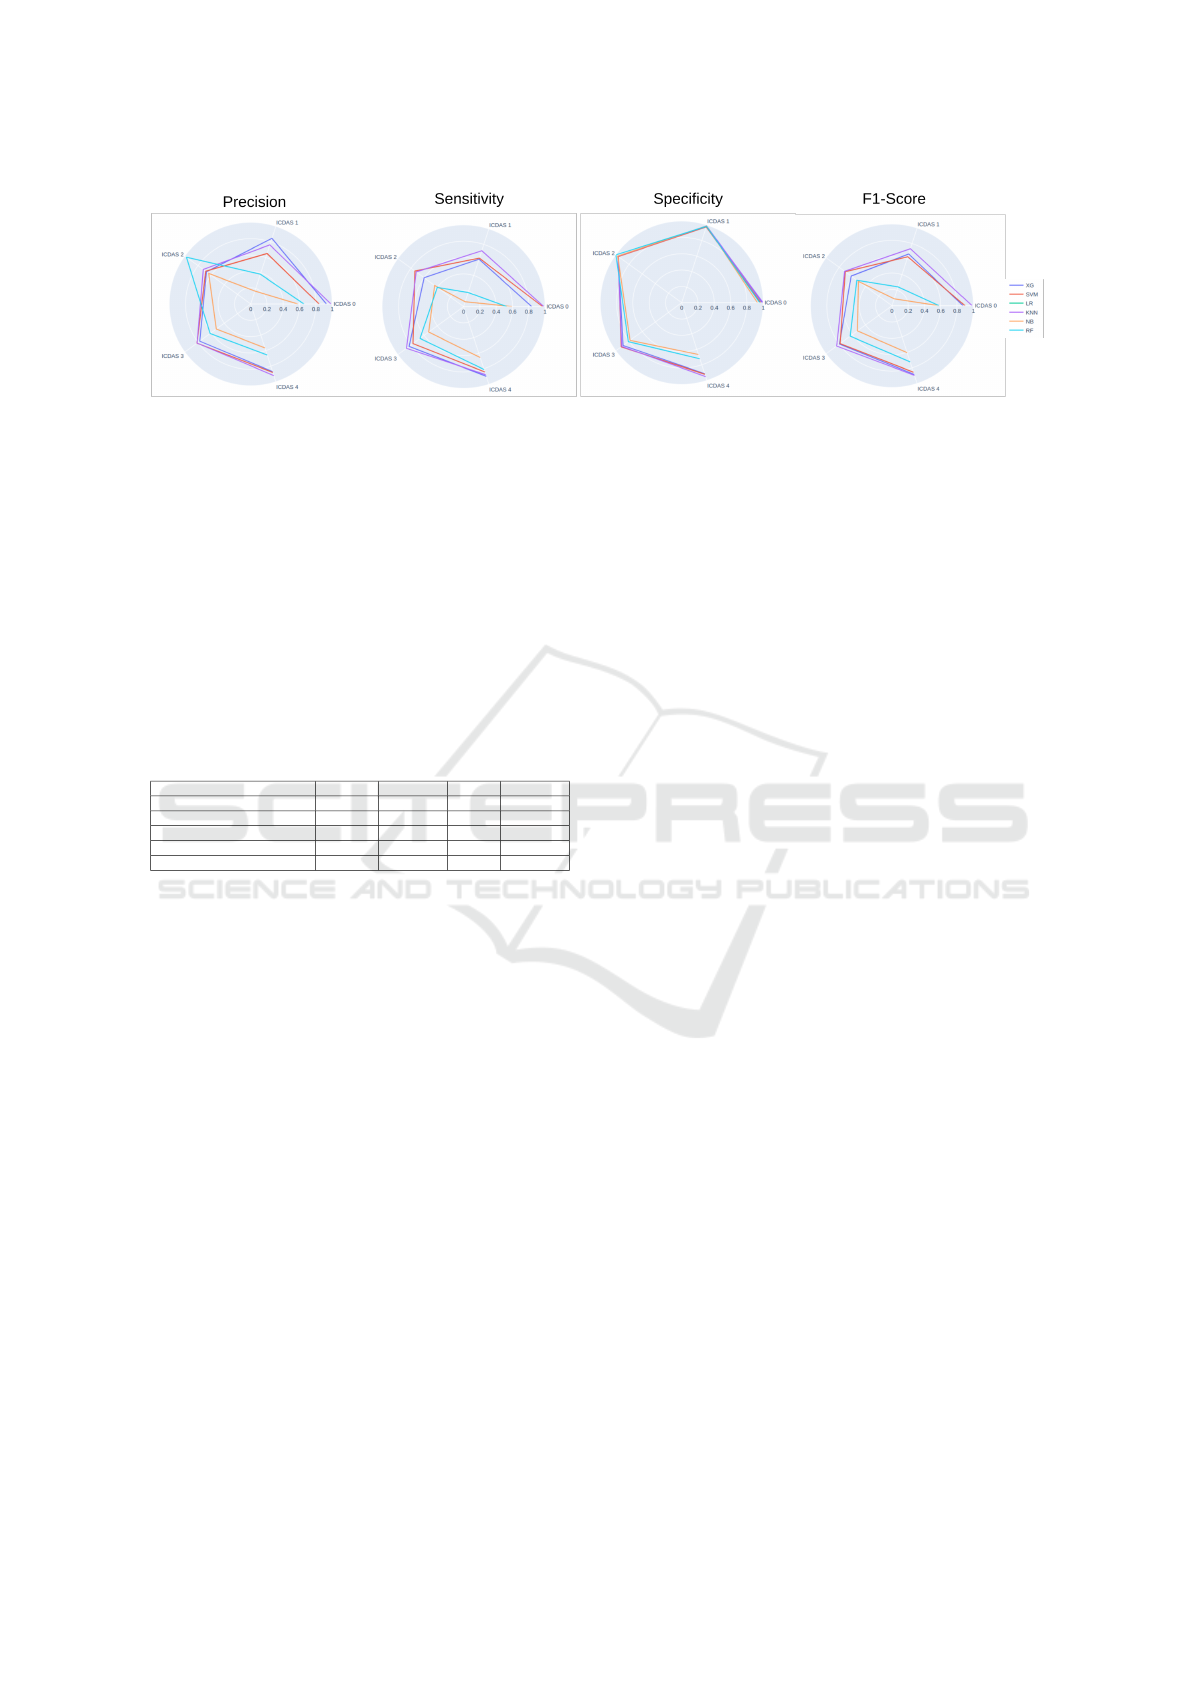
Figure 5: Comparison of best six algorithms between metrics over the five classes ICDAS.
4.4 Comparison Studies
Table 2 shows a comparison with other studies. It is
challenging due to notable differences in data, tech-
niques used, and types of images analyzed. Each of
these studies manages specific characteristics, such as
the number of classes to categorize caries lesions at
different levels. Additionally, some studies focus on
identifying caries regions, while others may not in-
clude this step in their approach. These variations re-
flect the complexity of dental image analysis and the
diversity of approaches available in the literature.
Table 2: Comparison between studies.
Study Accuracy Sensitivity Classes Image
(Jusman et al., 2022b) 96.10% - 4 Bitewing
(Ezhov et al., 2021) - 72.85% 2 CBCT
(Zhu et al., 2022) 93.61% 86.01% 4 Panoramic
(Imak et al., 2022) 99.13% 98.00% 2 Periapical
(Ramana Kumari et al., 2022) 93.67% 94.66% 2 X-ray
When comparing our study to a two-class study,
as presented in Table 2, it is important to note that we
need to adapt our results by combining ICDAS lev-
els 1, 2, 3, and 4 into class 1, If we calculated the
metrics of these binary conditions, the best algorithm
achieves an accuracy of 99.59%. Notably, the KNN
model exhibits a high sensitivity of 98.46% for IC-
DAS 0 (Figure 5), highlighting that in this context,
the primary challenge is distinguishing between vari-
ous levels of caries. The choice of model evaluation
metrics is crucial to align with the specific study ob-
jectives and ensure the derivation of meaningful and
relevant results.
The study most similar to ours is the research con-
ducted by (Ezhov et al., 2021). In this study, the au-
thors utilized a dataset of 4,398 teeth to train a model
that incorporates a contextual area for caries segmen-
tation. Their model achieved a specificity of 99.53%
and a sensitivity of 72.85% in binary caries segmenta-
tion. However, this study does not provide a compre-
hensive set of performance metrics and primarily em-
phasizes broader dental applications, such as identi-
fying periodontal bone and periapical lesions. In con-
trast, our model excels in terms of sensitivity within
the broader metrics, achieving an 83.35% sensitivity
in a multi-class problem.
5 CONCLUSION
A limitation of our approach is the limited ability to
classify more than two caries lesions in the same im-
age. The current system was not developed to address
this specific situation, as classification is performed
on individual images. However, this limitation is par-
ticular and our method can be adapted to consider this
topic.
The primary goal of this project is to segment
regions with caries and subsequently classify them,
which was achieved through the application of im-
age processing and machine learning techniques. The
performance metrics of the proposed approach have
shown promising results, achieving an accuracy of
86.20%, an f1-score of 86.18%, and a sensitivity of
83.35% in the context of multiclass classification us-
ing ICDAS.
For future work, we intend to compare the current
model to deep learning approaches, and the applica-
tion will be extended to include knowledge transfer
(few-shot learning), enabling an even broader range
of applications and improving the accuracy and effec-
tiveness of the system.
ACKNOWLEDGEMENTS
This work is supported in part by the Brazilian Na-
tional Council for Scientific and Technological Devel-
opment (CNPq grant number 307710/2022-0), in part
by the Coordenac¸
˜
ao de Aperfeic¸oamento de Pessoal
de N
´
ıvel Superior - Brasil (CAPES) - Finance Code
001, Brazil, and Ita
´
u Unibanco S.A. through the PBI
program of the Centro de Ci
ˆ
encia de Dados (C
2
D)
of Escola Polit
´
ecnica at Universidade de S
˜
ao Paulo,
and S
˜
ao Paulo Research Foundation (FAPESP) – Na-
tional Institute of Science and Technology – Medicine
HEALTHINF 2024 - 17th International Conference on Health Informatics
434

Assisted by Scientific Computing (INCT-MACC) –
grant 2014/50889-7.
REFERENCES
Ahmed, S., Saifuddin, K. M., Ahmed, A. S., Aowlad Hos-
sain, A., and Iqbal, M. T. (2017). Identification and
volume estimation of dental caries using CT image.
ICTP, pages 48–51.
Al Kheraif, A. A., Wahba, A. A., and Fouad, H. (2019). De-
tection of dental diseases from radiographic 2d dental
image using hybrid graph-cut technique and convolu-
tional neural network. Measurement, 146:333–342.
Breiman, L. (2001). Random Forests. Machine Learning,
45(1):5–32.
Bro, R. and Smilde, A. K. (2014). Principal component
analysis. Analytical methods, 6(9):2812–2831.
Chen, R. and Zhang, H. (2017). Large-scale 3D Reconstruc-
tion with an R-based Analysis Workflow. Proceedings
Big Data Computing, pages 85–93.
Datta, S., Chaki, N., and Modak, B. (2019). A Novel Tech-
nique to Detect Caries Lesion Using Isophote Con-
cepts. IRBM, 40(3):174–182.
Ezhov, M., Gusarev, M., Golitsyna, M., Yates, J. M.,
Kushnerev, E., Tamimi, D., Aksoy, S., Shumilov, E.,
Sanders, A., and Orhan, K. (2021). Clinically appli-
cable artificial intelligence system for dental diagnosis
with CBCT. Scientific Reports, 11(1).
Felemban, O. M., Loo, C. Y., and Ramesh, A. (2020). Ac-
curacy of Cone-beam Computed Tomography and Ex-
traoral Bitewings Compared to Intraoral Bitewings in
Detection of Interproximal Caries. The Journal of
Contemporary Dental Practice, 21(12):1361–1367.
Geetha, V., Aprameya, K. S., and Hinduja, D. M. (2020).
Dental caries diagnosis in digital radiographs using
back-propagation neural network. Health Inf Sci Syst,
8(1):8.
Gugnani, N. and Pandit, I. (2011). International caries de-
tection and assessment system (ICDAS): A new con-
cept. International Journal of Clinical Pediatric Den-
tistry, 4(2):93–100.
Imak, A., Celebi, A., Siddique, K., Turkoglu, M., Sengur,
A., and Salam, I. (2022). Dental Caries Detection
Using Score-Based Multi-Input Deep Convolutional
Neural Network. IEEE Access, 10:18320–18329.
Japkowicz, N. and Shah, M. (2015). Performance evalua-
tion in machine learning. Machine Learning in Radi-
ation Oncology: Theory and Applications, pages 41–
56.
Jiang, L., Cai, Z., Wang, D., and Jiang, S. (2007). Survey
of improving k-nearest-neighbor for classification. In
Fourth international conference on fuzzy systems and
knowledge discovery (FSKD 2007), volume 1, pages
679–683. IEEE.
Jusman, Y., Widyaningrum, A., and Puspita, S. (2022a). Al-
gorithm of Caries Level Image Classification Using
Multilayer Perceptron Based Texture Features. Cy-
berneticsCom, pages 168–173.
Jusman, Y., Widyaningrum, A., Tyassari, W., Puspita, S.,
and Saleh, E. (2022b). Classification of Caries X-Ray
Images using Multilayer Perceptron Models Based
Shape Features. ICITDA, pages 1–6.
Lakshmi, M. M. and Chitra, P. (2020). Classification of
Dental Cavities from X-ray images using Deep CNN
algorithm. ICOEI, pages 774–779.
L
¨
ofstedt, T., Brynolfsson, P., Asklund, T., Nyholm, T., and
Garpebring, A. (2019). Gray-level invariant haralick
texture features. PloS one, 14(2):e0212110.
Mingqiang, Y., Kidiyo, K., Joseph, R., et al. (2008). A
survey of shape feature extraction techniques. Pattern
recognition, 15(7):43–90.
Prokop, R. J. and Reeves, A. P. (1992). A survey of
moment-based techniques for unoccluded object rep-
resentation and recognition. CVGIP: Graphical Mod-
els and Image Processing, 54(5):438–460.
Ramana Kumari, A., Nagaraja Rao, S., and Ramana Reddy,
P. (2022). Design of hybrid dental caries segmen-
tation and caries detection with meta-heuristic-based
ResneXt-RNN. Biomedical Signal Processing and
Control, 78:103961.
Rathee, M. and Sapra, A. (2023). Dental Caries. In Stat-
Pearls. StatPearls Publishing, Treasure Island (FL).
Ronneberger, O., Fischer, P., and Brox, T. (2015). U-net:
Convolutional networks for biomedical image seg-
mentation. pages 234–241.
Setzer, F. C., Hinckley, N., Kohli, M. R., and Karabucak,
B. (2017). A Survey of Cone-beam Computed To-
mographic Use among Endodontic Practitioners in the
United States. J Endod, 43(5):699–704.
Singh, P. and Sehgal, P. (2017). Automated caries detection
based on Radon transformation and DCT. ICCCNT,
pages 1–6.
Sornam, M. and Prabhakaran, M. (2017). A new lin-
ear adaptive swarm intelligence approach using back
propagation neural network for dental caries classifi-
cation. ICPCSI, pages 2698–2703.
Verma, D., Puri, S., Prabhu, S., and Smriti, K. (2020).
Anomaly detection in panoramic dental x-rays using
a hybrid Deep Learning and Machine Learning ap-
proach. TENCON, pages 263–268.
Zhu, H., Cao, Z., Lian, L., Ye, G., Gao, H., and Wu,
J. (2022). CariesNet: a deep learning approach for
segmentation of multi-stage caries lesion from oral
panoramic X-ray image. Neural Comput Appl, pages
1–9.
Segmentation and Classification of Dental Caries in Cone Beam Tomography Images Using Machine Learning and Image Processing
435
