
Advanced Deep Learning Techniques for Industry 4.0: Application to
Mechanical Design and Structural Health Monitoring
Fakhreddine Ababsa
a
PIMM, Arts et Métiers ParisTech, CNRS, CNAM, HESAM University, Paris, France
Keywords: Generative Design, Deep Learning, Additive Manufacturing, Topology Optimization, Structural Health
Monitoring (SHM), MLP, GAN.
Abstract: Nowadays, Deep Learning (DL) techniques are increasingly employed in industrial applications. This paper
investigate the development of data-driven models for two use cases: Additive Manufacturing-driven
Topology Optimization and Structural Health Monitoring (SHM). We first propose an original data-driven
generative method that integrates the mechanical and geometrical constraints concurrently at the same
conceptual level and generates a 2D design accordingly. In this way, it adapts the geometry of the design to
the manufacturing criteria, allowing the designer better interpretation and avoiding being stuck in a time-
consuming loop of drawing the CAD and testing its performance. On the other hand, SHM technique is
dedicated to the continuous and non-invasive monitoring of structures integrity, ensuring safety and optimal
performances through on-site real-time measurements. We propose in this work new ways of structuring data
that increase the accuracy of data driven SHM algorithms and that are based on the physical knowledge related
with the structure to be inspected. We focus our study on the damage classification step within the aeronautic
context, where the primary objective is to distinguish between different damage types in composite plates.
Experimental results are presented to demonstrate the effectiveness of the proposed approaches.
1 INTRODUCTION
Many industrial sectors have embraced the concepts
and technologies of Industry 4.0. These technologies
offer the opportunity to promote efficient, on-demand
production through digitisation and the integration of
intelligent machines. This transition is primarily
driven by technological advances, which include
artificial intelligence (AI) and machine learning,
sensor networks, Internet of Things (IoT)
technologies, cloud computing, additive
manufacturing and the accessibility of large data sets
that can be leveraged by these innovations. However,
the degree of adoption of AI technologies for the
industry 4.0 varies considerably from one industrial
sector to another (Khelalef et al., 2019). Many
research studies have been carried out last years on
the use of AI in Industry 4.0. They highlight how the
different AI technologies aim to solve problems
concerning the acquisition, processing, modelling
and interpretation of data results. For example, in
(Nath et al., 2021) an AI-based feature engineering
framework was introduced for rotor fault diagnosis.
This study utilized a range of AI/ML methodologies
to extract significant data features, enabling the
detection of rotor faults. (Lockner et al., 2021)
introduced an enhanced injection molding process
through transfer learning. The authors employed
neural networks and genetic algorithms to optimize
the molding process, meeting customer demands for
waste reduction and operational speed. In a study
(Oehlmann et al., 2021), researchers employed an
artificial neural network (ANN) to predict the
pressure inside the nozzle of an FFF printer with the
aim of optimizing the printing process. In (Mohan et
al., 2021), a machine learning-based approach for
predictive maintenance was proposed. They
introduced a data-driven regression system to
transition from Industry 3.0 to Industry 4.0 with
minimal alterations to the existing setup. In another
study (Arden et al., 2021), the necessity of
implementing Industry 4.0 and AI-driven processes in
the pharmaceutical sector was examined. They
suggested that the pharmaceutical industry should
a
https://orcid.org/ 0000-0003-3862-2449
Ababsa, F.
Advanced Deep Learning Techniques for Industry 4.0: Application to Mechanical Design and Structural Health Monitoring.
DOI: 10.5220/0012364300003636
Paper published under CC license (CC BY-NC-ND 4.0)
In Proceedings of the 16th International Conference on Agents and Artificial Intelligence (ICAART 2024) - Volume 3, pages 535-542
ISBN: 978-989-758-680-4; ISSN: 2184-433X
Proceedings Copyright © 2024 by SCITEPRESS – Science and Technology Publications, Lda.
535
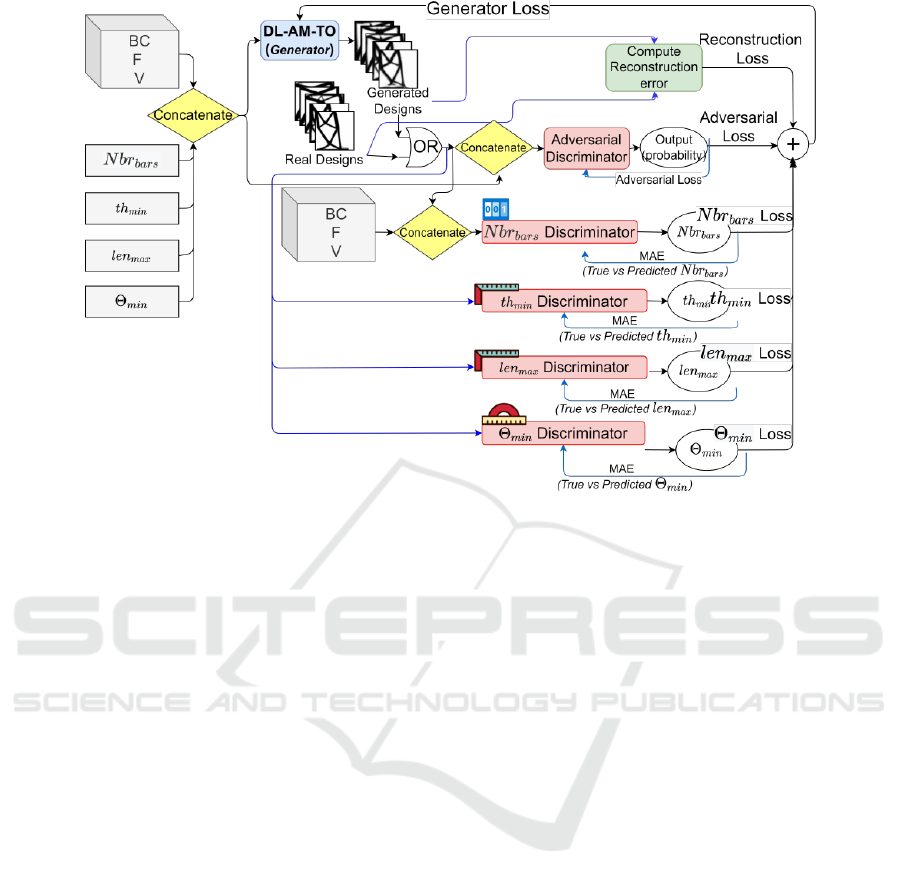
Figure 1: DL-AM-TO Training procedure.
leverage emerging cutting-edge technologies to
transition into the next generation of manufacturing.
In this paper, we aim to elaborate on two use cases of
AI within the scope of Industry 4.0, offering a
complementary perspective to the state of the art. The
first case focuses on harnessing Generative
Adversarial Networks (GANs) for design,
optimization, and numerical validation in the field of
additive manufacturing. The second case concerns the
utilization of a Convolutional Neural Network
(ConvNet) for the classification of damage cases in
the context of Structural Health Monitoring (SHM) of
aeronautical composite structures.
The rest of the manuscript is organized as follows:
Section 2 describes the methodology proposed for the
construction of the design algorithm using GAN’s.
Section 3 provides the details of the default
classification method for SHM. Section 4 gives
concluding remarks and suggestions for future work.
2 DL FOR ADDITIVE
MANUFACTURING-DRIVEN
TOPOLOGY OPTIMIZATION
In this work, we propose an advanced approach
utilizing Deep Learning (DL) to incorporate not only
mechanical constraints but also geometric constraints
inherent to Additive Manufacturing (AM) at a
conceptual level. DL's intrinsic capability to discern
spatial correlations obviates the necessity for deriving
explicit analytical formulas for geometric constraints,
relying instead on the availability of a substantial
dataset comprising numerous instances that
encapsulate these constraints.
We propose a topological optimisation (TO)
approach for data-driven AM (DLAM- TO). DL-AM-
TO is a generative model that takes mechanical
(Boundary conditions (BC), loads (F), and the volume
fraction (V)) and geometrical conditions (the
minimum thickness ( 𝑡ℎ
), the maximum length
(𝑙𝑒𝑛
), the minimum overhang (𝜃
), the number
of bars ( 𝑁𝑏𝑟
)) as inputs and generates a 2D
structure following these constraints. It is trained
within a five-discriminator-GAN (Goodfellow et al.
2014) framework consisting of a generator (DL-AM-
TO) and five discriminators: the traditional
adversarial discriminator and four geometric
discriminators, a bar counter,𝑡ℎ
, 𝑙𝑒𝑛
and 𝜃
predictors (Fig.1).
The four geometric constraints were chosen
among the existing set of constraints as a use case to
validate the proposed methodology.
2.1 Architecture
DL-AM-TO inherits the residual-convolutional
encoder-decoder architecture (Zhang et al., 2018)
presented in our previous work (Almasri et al., 2021)
ICAART 2024 - 16th International Conference on Agents and Artificial Intelligence
536

Figure 2: Performance of geometric discriminators showing predicted vs true values of 𝑡ℎ
, 𝑙𝑒𝑛
, 𝜃
, & 𝑁𝑏𝑟
,
from left to right respectively. The worst performant discriminator is clearly the 𝑡ℎ
predictor.
with one difference; the skip-connections between the
outputs of encoder layers and the inputs of decoder
layers were eliminated here. The traditional
discriminator consists of seven down-sample
convolutional layers followed by a dropout and a final
fully connected layer. The geometric discriminators’
network consists of a stem, an Inception/Reduction
Resnet-v1- block-A, an Inception/Reduction Resnet-
v1-block-B, an Inception Resnet-v1-block-C
followed by an average pooling layer, a dropout layer,
and a fully connected layer1. We would like to point
out that the input of the three geometric
discriminators (𝑡ℎ
, 𝑙𝑒𝑛
and 𝜃
) consists of
the 2D design only, and the bar counter’s input
consists of the design alongside the mechanical
conditions.
2.2 Training Loss Function
The most challenging aspect of GANs is to find an
equilibrium between the generator and the
discriminator and avoid the dominance of one over
the other. The loss function with other training
parameters play an important role into stabilizing the
training and condemning the phenomenon of
oscillating losses. In this work, the loss function is
further challenging; it has to also account for the
geometrical (𝑡ℎ
, 𝑙𝑒𝑛
, 𝜃
and 𝑁𝑏𝑟
) and
mechanical (BC, F, V) constraints. Thus
𝐿
𝐿
𝜆
𝜆
𝐿
𝐿
𝐿
𝐿
(1)
Where the reconstruction loss 𝐿
∑
𝑥
𝑥
.
𝑥
and 𝑥
are the real and generated 2D design and N
is the batch size, 𝐿
∑|
𝑐
𝑐̂
|
, 𝑐∈
𝑁𝑏𝑟
,𝑡ℎ
,𝑙𝑒𝑛
,𝜃
𝑐
𝑎𝑛𝑑 𝑐̂
are the
input and predicted geometrical values respectively,
and 𝐿
is the Binary Cross Entropy (0 𝐿
100 in PyTorch). Hence, 𝐿
was set to 0.01,
so 𝐿
becomes of the same order of magnitude of
all other losses varying between 0 and 1.
2.3 Results
In this section, we present the performance of DL-
AM-TO with regard to geometric constraints. Thus,
we not only evaluate the aesthetics of the generated
designs (Fig. 2), but also test DL-AM-TO's ability to
respond to geometric changes (Fig. 3).
2.3.1 Training and Test Dataset
11719 samples of GMCAD (Almasri et al., 2021) are
used for training and 4405 samples for test. It consists
of 2D designs (in a .png format) alongside their
mechanical and geometrical constraints. GMCAD’s
features are detailed in (Almasri et al., 2021)
2.3.2 Geometric Discriminators’
Performance
To train the geometric discriminators, we augmented
the training dataset with three rotations of 90°,
180°and 270°. The predictive performance of the
geometrical discriminators is presented in Fig. 2. In
order to evaluate a predictor, an admissible error
interval is set (predictions within the green lines in
Fig.2 are considered correct). As we can clearly see,
the 𝑡ℎ
predictor shows the highest number of
inadmissible predictions (predictions outside the
green intervals). To quantify this observation, the
percentage of erroneous predictions for every
geometrical discriminator is computed.
We choose for the 𝑡ℎ
and 𝑙𝑒𝑛
lenmax the
relative prediction error defined as 𝑒
%
|
|
100, and for 𝜃
and 𝑁𝑏𝑟
,
Δ
|
𝑇𝑟𝑢𝑒 𝑃𝑟𝑒𝑑𝑖𝑐𝑡𝑒𝑑
|
. The percentage of
predictions that fall within 𝑒
%
5% is 46%,
𝑒
%
5% is 1%, Δ𝜃
5
°
is 3,15% and
Δ𝑁𝑏𝑟
1 𝑏𝑎𝑟 is 0,15%. Consequently, we can
Advanced Deep Learning Techniques for Industry 4.0: Application to Mechanical Design and Structural Health Monitoring
537
conclude that all geometric discriminators are
sufficiently precise except for the 𝑡ℎ
one, which
needs further improvement. In fact, if we tolerate a
higher error interval of 10% for 𝑡ℎ
, we would end
up with 29,1%of inadmissible predictions
2.3.3 Dl-AM-TO’s Performance
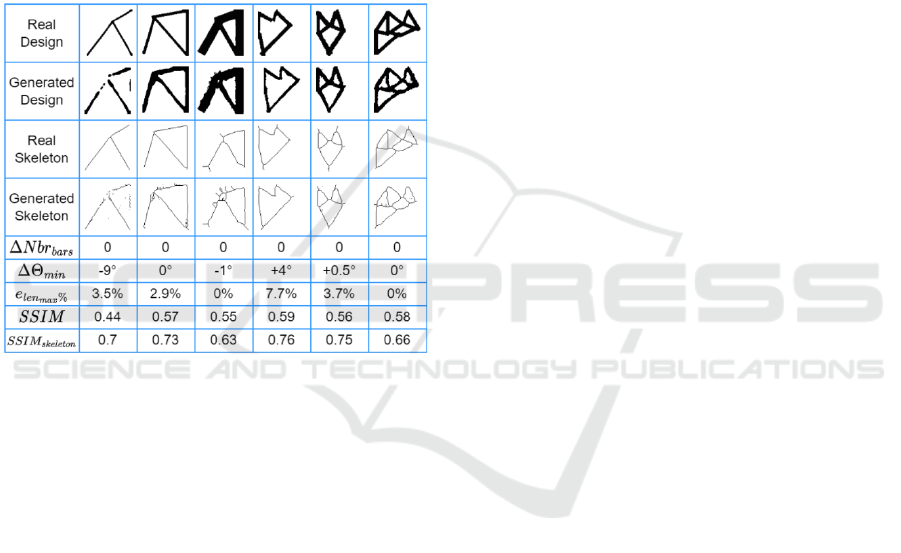
Figure 3 shows a sample of real versus generated
designs alongside their skeletons and the geometrical
metrics: Δ𝜃
, Δ𝑁𝑏𝑟
, and 𝑒
%
. In fact,
designers are more interested in the design’s
geometry, which is best defined by the skeletons,
which explains their use here for comparison.
Figure 3: Comparison between the real and generated
designs in their full and skeleton formats on the test set.
As we can clearly see, DL-AM-TO captures the
geometrical information; Δ𝑁𝑏𝑟
0, Δ𝜃
rarely exceeds 5°, similarly, 𝑒
%
does not
exceed 10%. Aesthetically, the generated designs’
skeletons are similar to the real ones; we used the
structural similarity index (SSIM) to compare them
(Wang et al., 2004). SSIM is 0.7. The overall
geometrical performance was evaluated manually
over a sample of 100 designs of the test set; in other
terms, we counted the 𝑁𝑏𝑟
and measured the
𝑙𝑒𝑛
, and 𝜃
manually. We define a design
complying with (i) the 𝑁𝑏𝑟
constraint if
Δ𝑁𝑏𝑟
1 , (ii) the 𝑙𝑒𝑛
constraint if
𝑒
%
10% , and (iii) the 𝜃
constraint if
Δ𝜃
5%. We find that 83% of the designs respect
the 𝑁𝑏𝑟
constraint, 76% comply with the 𝑙𝑒𝑛
constraint, and 90% with the 𝜃
constraint.
In order to further investigate the geometrical
understanding of DL-AM-TO, we realized the
following experiment: We fixed the mechanical
constraints and altered one geometrical variable at a
time (𝑙𝑒𝑛
and 𝜃
). To calibrate the design’s
geometry, we simply need to modify the input value
of the de-sired geometrical condition. As we can see,
every time we increase 𝑙𝑒𝑛
𝜃
⁄
, the design’s
shape is modified in order to comply with this
variation while always conforming with mechanical
constraints (the F and BC). However, we can notice
that some geometrical constraints are correlated;
increasing the 𝜃
alters the 𝑙𝑒𝑛
, and at a certain
value, an additional bar appears.
To sum up, DL-AM-TO captures the geometrical
and mechanical constraints concurrently and
responds to geometrical changes creatively; the
obtained results encourage the further improvement
of the model
2.3.4 Discussion
The performance of DL-AM-TO relies on several
factors. In this study, the traditional SIMP method
was used to create the GMCAD dataset for training,
with the main objective being the integration of
mechanical and geometrical conditions through DL
architectures, rather than developing a new TO
algorithm. The performance of geometrical
discriminators is a key consideration. These
discriminators, trained within GAN frameworks, are
sensitive to oscillating losses, particularly with the
"𝑡ℎ
" variable, which, when integrated into the
model, resulted in performance deterioration. The
"𝑡ℎ
" discriminator struggled with precision due to
the transformation of CAD designs into image-like
representations using computer vision filtering
techniques, which can inadvertently change the
design's thicknesses.
DL-AM-TO represents a flexible and adaptable
approach, as it allows for the incorporation of
additional geometric constraints to enhance the
generated designs without necessitating significant
modifications to the model's architecture. Each input
geometric condition can be integrated as an additional
objective function of the discriminator. Thus,
changing multiple conditions at a time for multiple
times will generate a set of optimal Pareto front
solutions.
3 DL FOR DATA DRIVEN SHM
APPLICATION
Structural Health Monitoring (SHM) is dedicated to
the continuous and non-invasive monitoring of
structures integrity, ensuring safety and optimal
performances through on-site real-time
ICAART 2024 - 16th International Conference on Agents and Artificial Intelligence
538
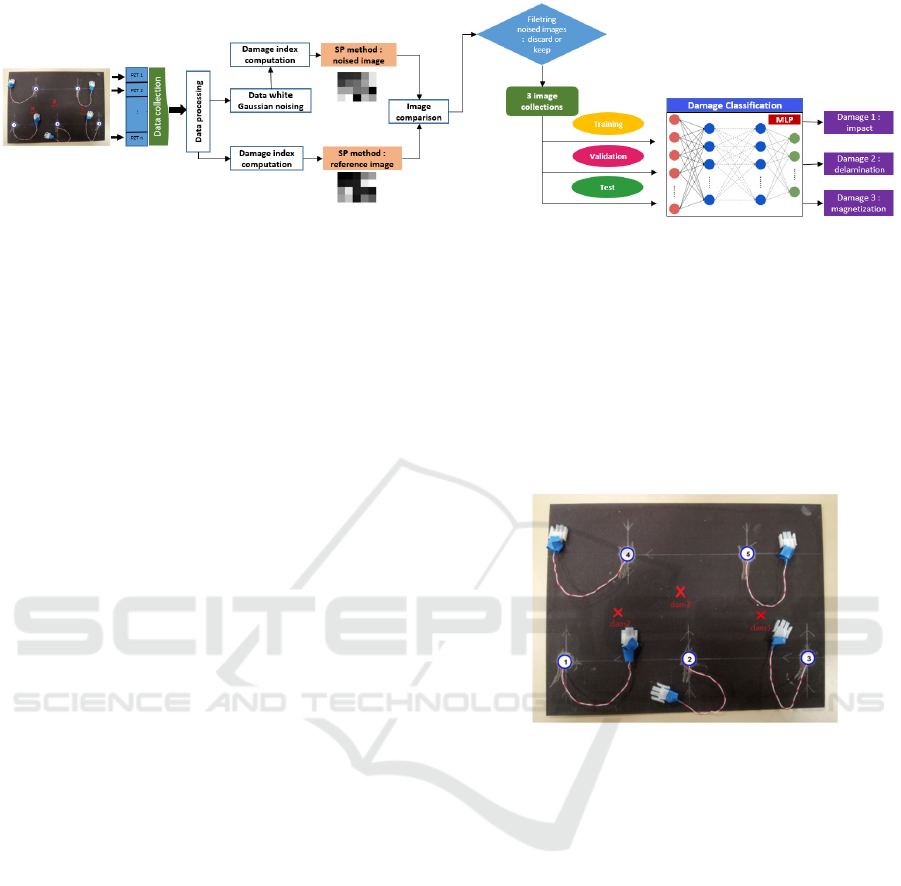
Figure 4: The work dataflow, from data acquisition and transformation into 2D images to MLP classification.
measurements (Worden et al., 2007). Typically, a
SHM approach for thin structures relies on the
utilization of transducers, such as piezoelectric
(PZT), bonded on the structure under examination
and that can either send and received ultrasonic waves
within the structure to be inspected. Thus, the data
collection process associated with the SHM of thin
structures using ultrasonic waves generate large
datasets composed of many time series associated
with all the PT paths available on the structure that
need to be processed using robust and efficient
techniques in order to determine the presence of the
damage and their properties (nature, position, size,
etc.). In this study, we investigate new ways of
structuring data that increase the accuracy of data
driven SHM algorithms and that are based on the
physical knowledge related with the structure to be
inspected. In particular, the generation of key images
from physics-based signals corresponding to all the
available PZT paths.
The overall dataflow of the developed SHM
algorithm is presented in Figure 4. First, the received
signals will be processed to compute the DIs for
various tested damage configuration. For each damage
case, reference images will then be generated from
these DIs, while on the other hand, a white Gaussian
noise will be added to the reference signals to compute
a new list of DIs. “Noisy” images will then be
generated from these noisy DIs and then compared
with the reference images in order to keep only images
that are relevant for supervised learning. The process is
repeated until there are enough images to form image
collections for each damage. The images are then
separated into training, validation, and test bases
depending on the methods, and fed into a MLP to
perform a classification task. The methods will finally
be compared according to their performance.
3.1 Lamb Waves Raw Data Acquisition
A complex composite aeronautic plate made of
composite carbon epoxy is considered (Fig. 5). It is
made with 4 plies oriented along [0°/ 45°/ 45°/ 0°]
and its dimension are 400x300 mm. A five
piezoelectric elements array is used, and each element
is bonded to the plate and acts sequentially as sensor
and actuator in order to emit and receive Lamb waves
signals. They are numbered from 1 to 5 and have a
12.5 mm radius. Three types of damage (impact,
delamination, magnet) are considered as shown in
Figure 4.
Figure 5: Epoxy plate under study, where “dam1” refers to
impact, “dam”2 refers to delamination and “dam3” refers to
magnet damage.
The first damage is made by an impact, the second
damage is made by placing magnet from both sides of
the plate, and the third damage is an artificial
delamination achieved by placing a small Teflon tape
between two composite plies. Lamb wave
measurements were employed for their ability to
interact with these damages (Mechbal et., 2017). The
signals were 5-cycle bursts with specific parameters,
and each signal was collected and emitted with
multiple repetitions for statistical robustness. Signal
pre-processing included denoising through a discrete
wavelet transform and time alignment to account for
hardware-induced time misalignments.
Following the collection of signals for all
receiver-actuator pairs, a set of 40 candidate Damage
Indexes (DIs) designed for damage detection is
computed by comparing the damaged state signals
with reference signals. The goal was to determine an
average score across three sub-scores that assess the
Advanced Deep Learning Techniques for Industry 4.0: Application to Mechanical Design and Structural Health Monitoring
539

coherence, range, and consistency of these DIs across
various scenarios. The study revealed that DIs based
on residual energy and signal correlation exhibit the
highest robustness, accommodating a wide range of
scenarios, environmental conditions, and potential
uncertainties, such as variations in the placement of
piezoelectric sensors. It's worth noting that for
reference-damage configurations, 100 DIs can be
generated (comparing 10 healthy signals to 10
damaged ones), whereas for ref-ref comparisons, only
45 DIs are computed due to the exclusion of
redundant comparisons within the available
repetitions.
3.2 Image Generation from DI’s
The developed technique is based on damage index
(DI) datasets computed for various damage
configurations. It exploits information about the
location of piezoelectric transducers (PZTs) to
structure a 2D image to match the acquired Lamb
wave signals. This approach, called sensor placement
(SP), uses the physical positioning of the sensors on
the plate, independently of the location of the
damage. The image generation process is as follows:
in the columns, from left to right, we position the
pixels corresponding to the PZT actuator located
furthest to the left and right of the plate. The rows of
pixels are in the same order as the columns, but this
concerns the positions of the receivers. For example,
a pixel at coordinates (3,4) in the image matrix
characterises the damage index (DI) between the third
leftmost PZT, acting as an actuator on the plate, and
the fourth leftmost PZT, acting as a sensor. In
particular, the actuator positioned in the column is not
taken into account, as actuator-receiver pairs
involving the same PZT are excluded from the
analysis. The available 40 DI’s would only provide us
with 40 images per damage, which is clearly
insufficient for performing supervised deep neural
network learning tasks. Therefore, we need to
generate more images from the original ones. We
chose to use additive white Gaussian noise (AWGN)
but in a manner different from what is commonly
found in the literature. Indeed, data augmentation
techniques often aim to manipulate image support to
generate new images. These techniques include
flipping, rotation, resizing, cropping, or even adding
noise directly to the source image. In our case, it is
the temporal signals that are being modified. We add
Gaussian noise directly to a signal, stored in our case
in matrix. AWGN is characterized by its signal-to-
noise ratio (SNR) whose expression is:
𝑆𝑁𝑅
10𝑙𝑜𝑔
𝐴
𝐴
20𝑙𝑜𝑔
𝐴
𝐴
(2)
Where 𝐴
and 𝐴
represent the amplitudes of
the reference signal and the additive noise,
respectively.
The AWGN models random noise distributed
according to a normal distribution and simulates the
background noise, caused for example by
interference, of a physical channel, in our case the
plate, which serves as an information transmission
gateway between a transmitter and a receiver. It is
therefore perfectly suited for this kind of situation.
Signals for the 3 damages that were initially recorded
were used to generate 40 reference images that we
will call vanilla. At the same time, these signals were
then used as a basis for applying AWGN that differ in
SNR. A limit SNR above which signal noise does not
create images that are sufficiently different from the
references was found empirically. Signals are noised
with SNRs below the SNR limit and then new DIs are
generated and batches of 40 (SP method) noisy
images are created per SNR value.Images generated
for the SP method with the noisy signals are shown in
Figure 6. It can be observed that according to the
damage, the reference image and the artificially
created AWGN image have the same structure and
differ only in the light intensity of some pixel blocks.
Figure 6: SP vanilla (1) vs. noisy (2) images with AWGN
for SNR=50.5 dB and for the DI Welch-based Power
Spectral Density (WPSD). Damage is by delamination (a),
impact (b) and magnet (c).
The main information in the artificial image, i.e., the
white pixel that informs about the largest DI, is
(a)
(b)
(c)
(1) (2)
ICAART 2024 - 16th International Conference on Agents and Artificial Intelligence
540
located at the same place and is of the same intensity
as in the corresponding vanilla image. After several
batches, we finally managed to generate 418 images
per class, i.e. 1254 images.
3.3 Classifier Architecture
Deep Learning is increasingly being adopted in the
field of Structural Health Monitoring (SHM) (Tabian
et al., 2019). In our case, we propose to train a MLP
neural network using the SP image dataset that we
presented in the previous section. The aim is to use
this network to perform a classification of the three
types of damage. We have therefore flattened the SP
images into a single vector which is used as the input
layer of a fully connected hidden MLP. We have
proposed a model where the hyper parameters have
been finely tuned to obtain the best classification rate.
For that, we employed a grid search approach and
conducted a series of experiments to systematically
determine the optimal hyper parameters of our MLP
model. The SOFTMAX activation function at the
final layer represents the categorical distribution,
assigning scores to each output class and
transforming them into probabilities.
3.4 Classification Results
The evaluation of the MLP model's performance will
involve analyzing the loss function across epochs.
The loss function is a crucial indicator of the model's
behavior after each optimization iteration, reflecting
its predictive accuracy. Additionally, we will
consider the accuracy metric, which measures the
model's predictive precision in comparison to the
ground truth data. Table 1 summarizes the accuracy
and loss results for the proposed MLP model, along
with the learning settings applied across multiple
training sessions.
Table 1: MLP model classification results.
Total number of ima
g
es
1254
N
umber of trainin
g
data
1003
N
umber of test ima
g
es
125
Epochs
30
Learnin
g
rate
0.001
Avera
g
e loss
0.372
Avera
g
e accurac
y
0.928
15 training sessions were conducted for each damage
to raise the average information depicted in table 1.
When we assess our model performance in
classifying the three types of defects, we can see that
the results are quite impressive, despite the dataset's
size limitations. After training for 30 epochs, the
accuracy approaches nearly 1, which means almost
perfect classification.
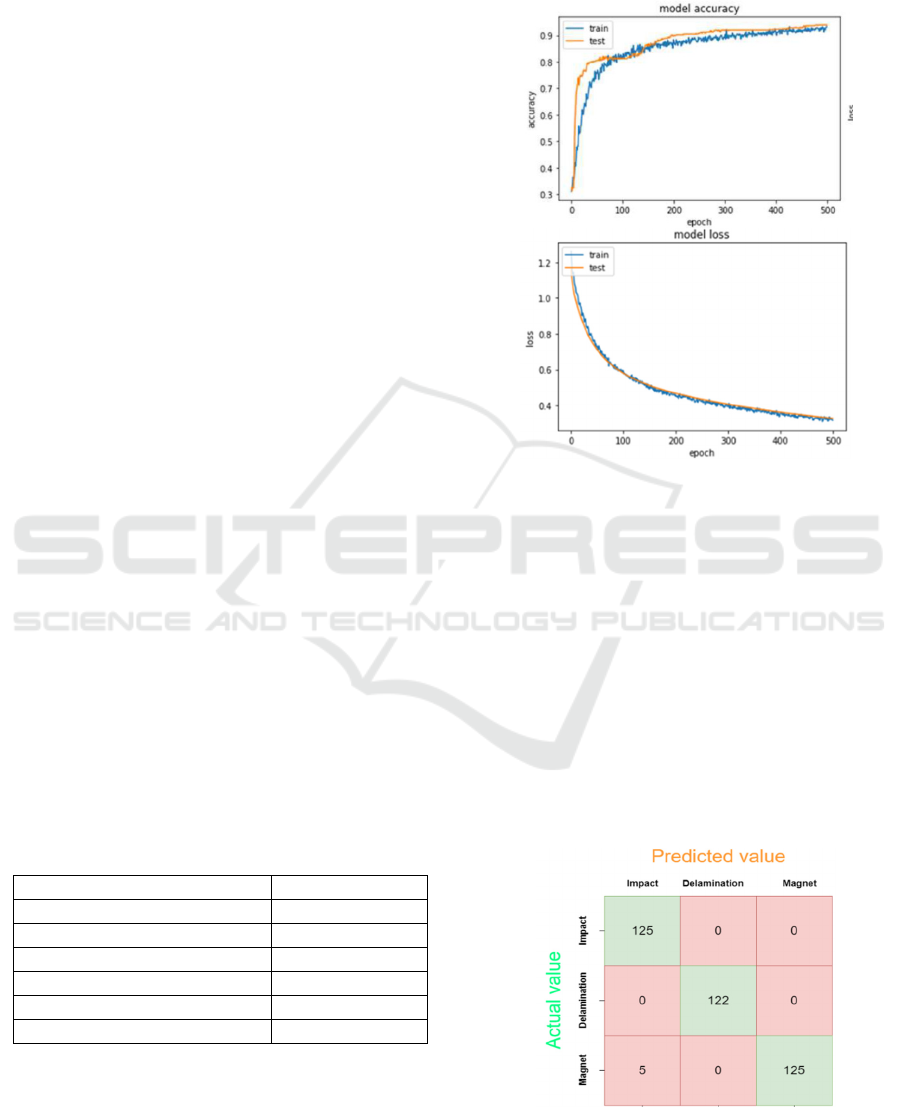
Figure 7: Performance of the MLP model after 500 epochs.
However, we observe a relatively high loss with
respect of that high accuracy. This can be understood
by examining the loss function mathematically. When
we plot a histogram of the loss values for individual
samples, it's evident that most samples have very low
loss, but a few outliers have significantly higher
losses. The MLP results are shown in figure 7. The
proposed model performs very well and does not
overfit. In fact, the SP images show to fit well for this
kind of task that is not too complex. The network
manages to class efficiently the three types of
damage, with few examples misclassified for the
magnet damage as shown in the confusion matrix
(figure 8).
Figure 8: The confusion matrix.
Advanced Deep Learning Techniques for Industry 4.0: Application to Mechanical Design and Structural Health Monitoring
541

3.5 Discussion
SP images appear to be perfectly suited to the task of
classifying defects using an MLP model.
Nevertheless, our primary challenge has been the
limited availability of data, primarily due to high
computational costs. Addressing the issue of data
scarcity is a common concern in deep learning. Data
augmentation techniques are often employed to
artificially expand datasets. Transfer learning, an
approach that leverages knowledge gained in solving
one problem to address another, is also of interest.
While our results suggest that the SP images performs
well with limited data, there is potential in exploring
how incorporating knowledge from complex neural
networks could benefit both methods.
4 CONCLUSIONS
In this paper, we presented two use cases for artificial
intelligence in Industry 4.0. The first is an additive
manufacturing-driven topological optimisation
approach based on deep learning, called DLAM- TO.
This technique integrates mechanical and geometric
constraints at the same level and generates 2D
designs. More interestingly, it easily adapts the
geometry of the design to propose several additive
manufacturing compliant geometries corresponding
to the needs of the design engineer while maintaining
a mechanical performance similar to that proposed by
SIMP. The second example demonstrated the
feasibility of a data-driven approach based on images
generated by physics (lamb wave propagation) to
classify three types of damage in the context of SHM
application. The next step involves finalizing the
demonstrators and planning their evaluation by end
users, namely, designers and maintenance operators.
This phase is crucial to refine these approaches and
transform them into fully operational tools intended
for use in the context of the factories of the future. It
also requires an optimization and adaptation process
to ensure their alignment with the specific needs of
these professionals before proceeding with the actual
deployment in industrial environments.
REFERENCES
Almasri, W., Bettebghor, D., Ababsa, F., Danglade, F. and
Adjed, F., 2021, July. Deep Learning Architecture for
Topological Optimized Mechanical Design Generation
with Complex Shape Criterion. In International Con-
ference on Industrial, Engineering and Other
Applications of Applied In-telligent Systems, pp. 222-
234, (2021)
Almasri W., Bettebghor D., Adjed F., Ababsa F., Danglade
F., GMCAD: an original Synthetic Dataset of 2D
Designs along their Geometrical and Mechanical
Conditions. In International Conference on Industry 4.0
and Smart Manufacturing, (2021).
Arden, N. S., Fisher, A. C., Tyner, K., Lawrence, X. Y.,
Lee, S. L., & Kopcha, M.. Industry 4.0 for
Pharmaceutical Manufacturing: Preparing for the Smart
Factories of the Future. International Journal of
Pharmaceutics, (2021)
Bendsoe, MP., Kikuchi N., Generating optimal topologies
in structural design using a homogenization method,
Computer Methods in Applied Mechanics and
Engineering, vol. 71, no. 2, pp. 197-224, (1988)
Goodfellow, I., Pouget-Abadie, J., Mirza, M., Xu, B.,
Warde-Farley, D., Ozair, S., Bengio, Y.. Generative
adversarial nets. In: Advances in neural information
processing systems, pp. 2672-2680, (2014)
Khelalef, A., Ababsa, F., Benoudjit, N., An Efficient
Human Activity Recognition Technique Based on Deep
Learning. Pattern Recognition and Image Analysis 29,
702-715 (2019)
Lockner, Y., Hopmann, C. Induced network-based transfer
learning in injection molding for process modelling and
optimization with artificial neural networks. Int J Adv
Manuf Technol 112, 3501–3513 (2021)
Mechbal, N., Rébillat, M., Damage indexes comparison for
the structural health monitoring of a stiffened
composite plate. 8th ECCOMAS Thematic Conference
on Smart Structures and Materials (SMART 2017) pp.
436-444, (2017)
Mohan, T. R., Roselyn, J. P., Uthra, R. A., Devaraj, D., &
Umachandran, K.. Intelligent machine learning based
total productive maintenance approach for achieving
zero downtime in industrial machinery. Computers &
Industrial Engineering, (2021)
Nath, A.G., Udmale, S.S. & Singh, S.K. Role of artificial
intelligence in rotor fault diagnosis: a comprehensive
review. Artif Intell Rev 54, 2609–2668 (2021).
Oehlmann, P., Osswald, P., Blanco, J.C. et al. Modeling
Fused Filament Fabrication using Artificial Neural
Networks. Prod. Eng. Res. Devel. 15, 467–478 (2021).
Tabian, I.; Fu, H.; Sharif Khodaei, Z. A Convolutional
Neural Network for Impact Detection and
Characterization of Complex Composite Structures.
Sensors, 19, 4933, (2019)
Wang, Z., Bovik, A.C., Sheikh, H.R. and Simoncelli, E.P.,
Image quality assessment: from error visibility to
structural similarity. IEEE trans-actions on image
processing, 13(4), pp.600-612, (2004)
Worden, K.; Farrar, C. R.; Manson, G. & Park, G. "The
Fundamental Axioms of Structural Health Monitoring"
Proceedings: Mathematical, Physical and Engineering
Sciences, The Royal Society, pp. 1639-1664, (2007)
Zhang, Z., Liu, Q.,Wang, Y., Road extraction by deep
residual u-net. IEEE Geoscience and Remote Sensing
Letters, 15(5), 749-753 (2018).
ICAART 2024 - 16th International Conference on Agents and Artificial Intelligence
542
