
Magnification Invariant Medical Image Analysis: A Comparison of
Convolutional Networks, Vision Transformers, and Token Mixers
Pranav Jeevan
a
, Nikhil Cherian Kurian
b
and Amit Sethi
c
Department of Electrical Engineering, Indian Institute of Technology Bombay, Mumbai, India
Keywords:
Histopathology, Classification, Vision-Transformer, Token-Mixers, Generalization.
Abstract:
Convolution neural networks (CNNs) are widely used in medical image analysis, but their performance de-
grades when the magnification of testing images differs from that of training images. The inability of CNNs
to generalize across magnification scales can result in sub-optimal performance on external datasets. This
study aims to evaluate the robustness of various deep learning architectures for breast cancer histopathological
image classification when the magnification scales are varied between training and testing stages. We com-
pare the performance of multiple deep learning architectures, including CNN-based ResNet and MobileNet,
self-attention-based Vision Transformers and Swin Transformers, and token-mixing models, such as FNet,
ConvMixer, MLP-Mixer, and WaveMix. The experiments are conducted using the BreakHis dataset, which
contains breast cancer histopathological images at varying magnification levels. We show that the performance
of WaveMix is invariant to the magnification of training and testing data and can provide stable and good clas-
sification accuracy. These evaluations are critical in identifying deep learning architectures that can robustly
handle domain changes, such as magnification scale.
1 INTRODUCTION
Computer aided medical image analysis is poised to
become a critical component in the diagnosis and
treatment of various diseases (Chakraborty and Mali,
2023; Duncan and Ayache, 2000). Convolutional neu-
ral networks (CNNs) are the most commonly used
deep learning architecture for medical image analy-
sis (Li et al., 2014). Deep learning models, such as
CNNs, have shown near-human performance in ana-
lyzing medical images, including magnetic resonance
imaging (MRI), computed tomography (CT), and his-
tology images when the training and testing data are
derived from the same sources (Chan et al., 2020;
Gupta et al., 2022). However, the performance of
these models can be affected by several factors, in-
cluding variations in image quality, lighting condi-
tions, and magnification scales. In particular, changes
in magnification scales between training and testing
datasets can significantly impact the accuracy and
robustness of deep learning models in medical im-
age analysis (Gupta and Bhavsar, 2017). In general,
a
https://orcid.org/0000-0003-4110-9638
b
https://orcid.org/0000-0003-1713-0736
c
https://orcid.org/0000-0002-8634-1804
training a CNN on images at a specific magnifica-
tion scale may result in good performance on that
scale, but this performance may not generalize well
to other magnification scales (Alkassar et al., 2021).
This is a significant limitation when analysing med-
ical imaging modalities like histology images where
slight to moderate changes in magnification are com-
mon with the change of sensors and lenses across hos-
pitals and datasets. Though, augmenting input images
with perturbations in scales can slightly improve per-
formance of CNNs, it is also important to explore or
develop more robust deep learning architectures that
can generate features that are inherently invariant to
the changes in scale of input images. Such architec-
tures should be designed to capture the important fea-
tures in the images, regardless of the change in the
magnification scale, in order to provide robust perfor-
mance for medical image analysis in a clinical set-
tings.
In this study, we evaluate the robustness of mul-
tiple popular deep learning architectures, including
CNN-based architectures such as ResNet (He et al.,
2016) and MobileNet (Howard et al., 2017), self-
attention based architectures such as Vision Trans-
formers (VIT) (Dosovitskiy et al., 2021) and Swin
Transformers (Liu et al., 2021), and token mix-
216
Jeevan, P., Kurian, N. and Sethi, A.
Magnification Invariant Medical Image Analysis: A Comparison of Convolutional Networks, Vision Transformers, and Token Mixers.
DOI: 10.5220/0012362900003657
Paper published under CC license (CC BY-NC-ND 4.0)
In Proceedings of the 17th International Joint Conference on Biomedical Engineering Systems and Technologies (BIOSTEC 2024) - Volume 1, pages 216-222
ISBN: 978-989-758-688-0; ISSN: 2184-4305
Proceedings Copyright © 2024 by SCITEPRESS – Science and Technology Publications, Lda.

Table 1: Train-validation-test split of the BreakHis dataset
for our experiments for each magnification.
Magnification Train Validation Test
40× 1395 201 399
100× 1455 209 417
200× 1408 202 403
400× 1273 182 365
ing models such as Fourier-Net (FNet) (Lee-Thorp
et al., 2021), ConvMixer (Trockman and Kolter,
2022), Multi-Layer Perceptron-Mixer (MLP-Mixer)
(Tolstikhin et al., 2021), and WaveMix (Jeevan et al.,
2023). Our aim is to compare the performance of
these deep learning models when the magnification
of the test data differs from the training data. The
BreakHis (Spanhol et al., 2015) dataset , which in-
cludes breast cancer histopathological images at vary-
ing magnification levels, was utilized for our exper-
iments. The empirical performance differences be-
tween the deep learning models will be used to deter-
mine the most robust architecture for histopathologi-
cal image analysis.
2 EXPERIMENTS
2.1 Dataset
We utilized the BreakHis (Spanhol et al., 2015)
dataset, which is a well-known public dataset of
digital breast histopathology, for our experiments.
BreakHis has been widely used in the development
and evaluation of computer-aided diagnosis (CAD)
systems for breast cancer diagnosis (Cherian Kurian
et al., 2021). It provides a challenging benchmark for
the development of CAD systems due to the inherent
large variations in tissue appearances.
The dataset consist of 7,909 microscopy images of
breast tissue biopsy specimens from 82 patients diag-
nosed with either benign or malignant breast tumors.
The images are collected from four different institu-
tions and are of four different magnifications scales -
40×, 100×, 200× and 400×, corresponding to an ob-
jective lens of 4×, 10×, 20× and 40×, respectively as
shown in Figure 1.
In addition to the malignancy information of each
image, the dataset is further annotated with clinical
information, such as the patient’s age, the sub-type
of malignancy and the type of biopsy. The dataset is
slightly imbalanced in terms of the distribution of be-
nign and malignant cases and the distribution of dif-
ferent magnifications. In the dataset there are 5,429
malignant cases, whereas benign cases are only about
2,480.
As the BreakHis (Spanhol et al., 2015) dataset
contains multiple images at different magnification
levels, the dataset serves as a challenging and rep-
resentative test-bed for evaluating the robustness of
deep learning architectures across the different mag-
nification levels or scales. These evaluations will be
carried out by training some of the recently reported
deep learning architectures on one magnification level
of the BreakHis (Spanhol et al., 2015) dataset and
testing these trained models across multiple held-out
magnification levels. Observing the average test ac-
curacy on the different magnification levels can hence
reveal the robustness of deep learning architectures to
varying image magnification at inference.
2.2 Models
2.2.1 CNNs and Vision Transformers
For CNN-based models, we compared perfor-
mance using ResNet-18, ResNet-34 and ResNet-
50 from the ResNet family (He et al., 2016),
and MobileNetV3-small-0.50, MobileNetV3-small-
0.75 and MobileNetV3-small-100 from MobileNet
family of models. We used ViT-Tiny, ViT-Small and
ViT-Base (all using patch size of 16, see (Dosovitskiy
et al., 2021)) along with Swin-Tiny and Swin-Base
(all using patch size of 4 and window size of 7, see
(Liu et al., 2021)) for the experiments.
2.2.2 Token-Mixers
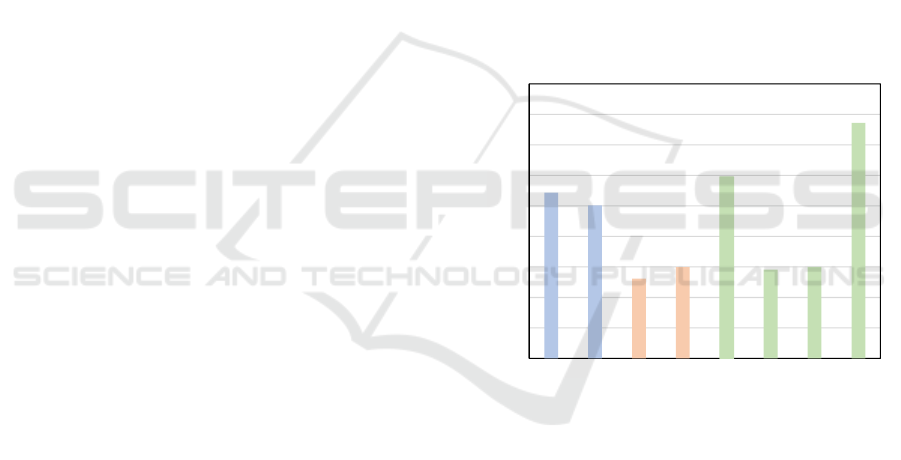
Token-mixers belong to a family of models which
uses an architecture similar to MetaFormer (Yu et al.,
2022) as its fundamental block as shown in Figure 2.
Transformer models can be considered as token-
mixing model which uses self-attention for token-
mixing. Other token-mixers use Fourier transforms
(FNet) (Lee-Thorp et al., 2021), Wavelet transforms
(WaveMix) (Jeevan et al., 2023), spatial-MLP (MLP-
Mixer) (Tolstikhin et al., 2021) or depth-wise con-
volutions (ConvMixer) (Trockman and Kolter, 2022)
for token-mixing. Token-mixing models have been
shown to be more efficient in terms of parameters and
computation compared to attention-based transform-
ers (Yu et al., 2022).
FNet (Lee-Thorp et al., 2021) was actually de-
signed for natural language processing (NLP) tasks
and was designed to handle 1D inputs sequences.
It has shown impressive performance compared to
transformer-based large language models in terms of
number of parameters used and speed. We have used
the 2D-FNet, i.e., a modified FNet that used a 2D
Fourier transform for spacial token-mixing instead of
a 1D Fourier transform used in FNet. The 2-D FNet
Magnification Invariant Medical Image Analysis: A Comparison of Convolutional Networks, Vision Transformers, and Token Mixers
217
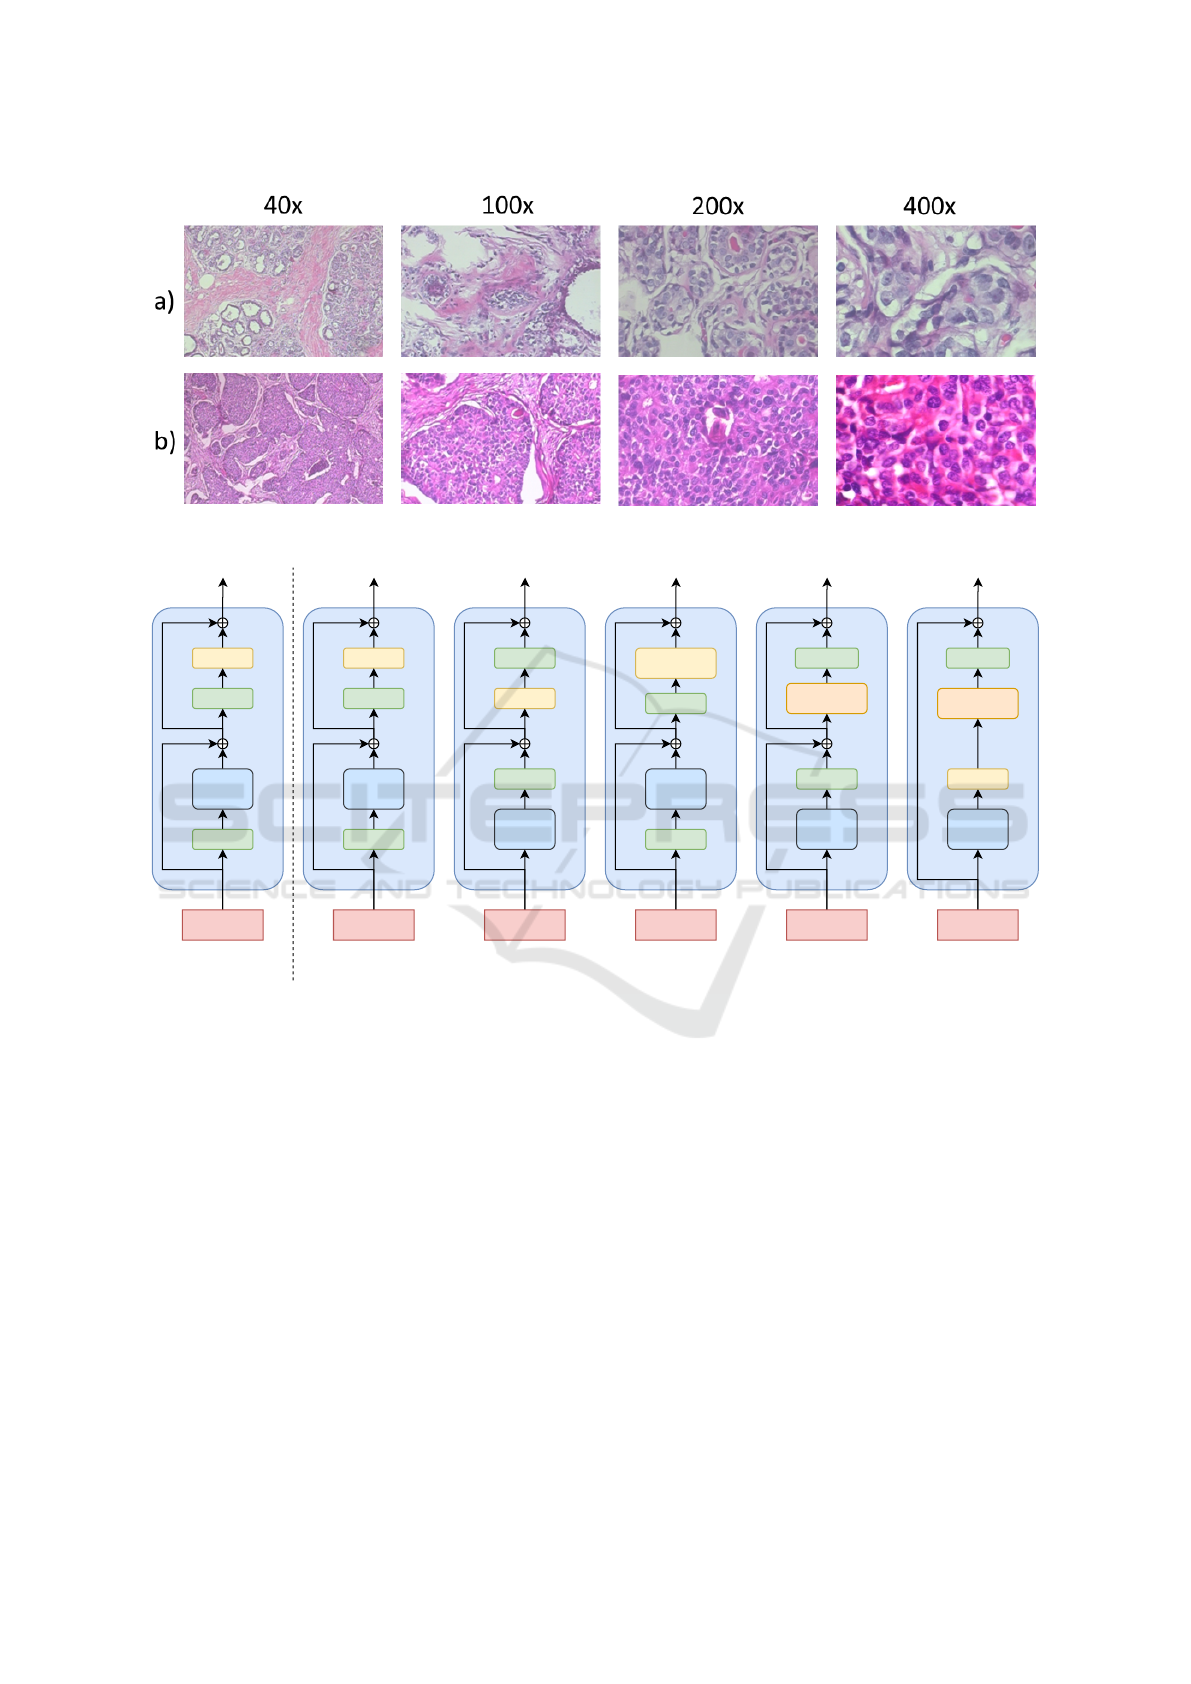
Figure 1: The BreakHis dataset includes images at four different magnifications: 40×, 100×, 200×, and 400×. The top row
shows (a) benign images, and bottom row shows (b) malignant images at four different magnification levels.
MLP
Norm
Norm
Token
mixer
Input
Embedding
MetaFormer
MLP
Norm
Norm
Self
Attention
Input
Embedding
Transformer
Norm
MLP
Fourier
Transform
Norm
Input
Embedding
F-Net
Norm
Pointwise
Conv
Depthwise
Conv
Norm
Input
Embedding
ConvMixer
Channel
MLP
Norm
Norm
Spacial
MLP
Input
Embedding
MLP-Mixer
Norm
Deconvolution
2D DWT
MLP
Input
Embedding
WaveMix
Figure 2: Architectures of various token-mixers along with the general MetaFormer block where the token-mixing operation
in different models is performed by different operations, such as spatial MLP, depth-wise convolution, self-attention, Fourier
and wavelet transforms.
can process images in the 2D form without the need
to unroll it into sequence of patches or pixels as done
in transformer and FNet. We experimented by vary-
ing the embedding dimension and number of layers to
get the best model.
WaveMix (Jeevan et al., 2023) uses 2D-Discrete
Wavelet transform (2D-DWT) for token-mixing. It
has been shown to be accurate, efficient and robust
across multiple computer vision tasks such as image
classification and semantic segmentation. We exper-
imented by varying the embedding dimension, num-
ber of layers and number of levels of 2D-DWT used
in WaveMix to get the model which gives highest val-
idation accuracy in the dataset.
ConvMixer (Trockman and Kolter, 2022) uses
depth-wise convolution for spacial token-mixing and
point-wise convolutions for channel token-mixing.
ConvMixer has shown impressive parametric-
efficiency in terms of classification performance
across various datasets. We used ConvMixer-
1536/20, ConvMixer-768/32, and ConvMixer-
1024/20 available in Timm model library (Wightman,
2019) for our experiments.
MLP-Mixer (Tolstikhin et al., 2021) uses spatial
MLP and channel MLP to mix spacial and channel to-
kens respectively. We used MLP-Mixer-Small (patch
size of 16) and MLP-Mixer-Base (patch size of 16) in
our experiments.
BIOIMAGING 2024 - 11th International Conference on Bioimaging
218
2.3 Implementation Details
The dataset was divided into train, validation and
test sets in the ratio 7:1:2 for each of the magnifi-
cations as shown in Table 1. Due to limited com-
putational resources, the maximum number of train-
ing epochs was set to 300. All experiments were
done with a single 80 GB Nvidia A100 GPU. All
models were trained from scratch using BreakHis
dataset. No pre-trained weights were used for any of
the models. We used the ResNet, MobileNet, Vision
transformer, Swin transformer, ConvMixer and MLP-
Mixer available in Timm (PyTorch Image Models) li-
brary (Wightman, 2019). Since WaveMix and FNet
were unavailable in the Timm library, these models
were implemented from their original papers. The
Timm training script (Wightman, 2019) with default
hyper-parameter values was used to train all the mod-
els. Cross-entropy loss was used for training. We used
automatic mixed precision in PyTorch during training
to optimize speed and memory consumption.
The images were resized to 672 × 448 for the
experiments. Transformer-based models and MLP-
Mixer required the images to be resized to sizes of
384 × 384 and 224 × 224 respectively. We trained
models of varying sizes belonging to the same archi-
tecture on the training set and evaluated it on vali-
dation set to find the model size that gives the best
performance on the BreakHis (Spanhol et al., 2015)
dataset. The model size with highest average valida-
tion performance over all magnifications was used for
evaluation using test set.
The maximum batch-size was set to 128. For
larger models, we reduced the batch-size so that it
can fit in the GPU. Top-1 accuracy on the test set of
the best of three runs with random initialization is re-
ported as a generalization metric based on prevailing
protocols (Hassani et al., 2021). We also reported the
class-weighted accuracy of token-mixers to compen-
sate for dataset imbalance.
3 RESULTS AND DISCUSSION
The cross-magnification classification performance of
all the best performing model variants of CNN, trans-
former and token-mixer models are shown in Table 2.
We can see that WaveMix performs better than all
the other models in maintaining high performance
across different testing magnifications. Only Con-
vMixer, another token-mixer, could perform better
than WaveMix in one magnification (200×). We also
observe that the accuracy of WaveMix is the most sta-
ble, never falling bellow 87%. Other models that per-
form well, such as, ConvMixer and ResNet-34, suf-
fers from unstable performance with their accuracy
falling to 81% and 78%, respectively. We believe
that the better performance of WaveMix is due to the
ability of 2D wavelet transform to capture multi-scale
features and efficiently mix spatial token informa-
tion. The subsequent use of deconvolution layers also
aids in rapid expansion of receptive field after each
wavelet block. The residual connections within each
block enables multiple levels of wavelet transform on
the feature maps which further aids long-range token-
mixing.
We also see from Figure 3 that WaveMix performs
the best among all models when we take the over-
all average of all the average testing accuracy over
all magnifications. We observe that the performance
of token-mixers (green) like MLP-Mixer and FNet is
comparable to that of transformer based models (red).
CNN-based models (blue) perform better than trans-
former models.
ResNet
-34
MobileNetV3
-Small 075
ViT-S/16
Swin-B
ConvMixer
-1024/20
MLP-Mixer-S/16
Fnet-256/8
WaveMix
-224/10
84
85
86
87
88
89
90
91
92
93
Accuracy
Models
Average Testing Accuracy
Figure 3: Average of all test accuracies reported for various
training magnifications for each of the models compared.
Figure 4 shows the average of test accuracy when
training and testing was done on same magnifica-
tions. We observe that ConvMixer performs better
than WaveMix when train and test magnifications are
same. Even ResNet-34 is performing almost on par
with WaveMix and ConvMixer. This shows that even
though other models perform well when magnifica-
tion of training and test data are same, they can-
not translate that performance when magnification
of training and testing set differs from each other.
WaveMix is mostly invariant to this change of magni-
fication between train and test data and is able to pro-
vide consistent performance compared to other CNN,
transformer and token-mixing models.
We also measure the class-weighted accuracy to
evaluate the performance of all models on BreakHis
dataset. Class-weighted accuracy measures the ac-
Magnification Invariant Medical Image Analysis: A Comparison of Convolutional Networks, Vision Transformers, and Token Mixers
219

Table 2: Results (test accuracy) of cross-magnification classification performance of all CNNs, transformers and token-mixers
on BreakHis (Spanhol et al., 2015) dataset.
CNNs
ResNet-34 MobileNetV3-Small 075
Training
Magnification
Average testing
performance
over all
magnifications
Training
Magnification
Average testing
performance
over all
magnifications
Testing Magnification Testing Magnification
40× 100× 200× 400× 40× 100× 200× 400×
40× 94.74 92.81 81.89 84.11 88.38 40× 92.48 91.13 84.62 82.19 87.60
100× 88.72 95.20 90.32 90.69 91.23 100× 87.47 89.69 88.59 89.04 88.70
200× 86.97 89.21 95.53 93.43 91.28 200× 86.97 89.21 94.54 90.96 90.42
400× 78.20 85.61 87.10 96.44 86.84 400× 85.71 86.81 90.07 94.79 89.35
Transformers
ViT-S/16 Swin-B
Training
Magnification
Average testing
performance
over all
magnifications
Training
Magnification
Average testing
performance
over all
magnifications
Testing Magnification Testing Magnification
40× 100× 200× 400× 40× 100× 200× 400×
40× 89.72 86.33 85.11 69.04 82.55 40× 91.48 87.05 75.43 70.68 81.16
100× 86.72 88.73 87.84 89.86 88.29 100× 88.22 88.49 90.57 86.85 88.53
200× 86.47 88.49 87.35 88.49 87.70 200× 85.97 89.21 92.06 88.22 88.86
400× 86.22 87.29 87.59 90.69 87.95 400× 87.97 88.01 89.83 91.78 89.40
Token-Mixers
ConvMixer-1024/20 MLP-Mixer-S/16
Training
Magnification
Average testing
performance
over all
magnifications
Training
Magnification
Average testing
performance
over all
magnifications
Testing Magnification Testing Magnification
40× 100× 200× 400× 40× 100× 200× 400×
40× 96.49 88.49 81.14 81.92 87.01 40× 91.98 80.58 78.16 81.10 82.95
100× 89.22 96.40 90.07 85.75 90.36 100× 86.72 88.73 87.84 89.86 88.29
200× 87.47 91.61 96.28 92.33 91.92 200× 88.47 88.49 94.29 91.78 90.76
400× 85.46 88.73 90.57 95.62 90.09 400× 83.46 86.57 84.86 87.67 85.64
WaveMix-224/10 FNet-256/8
Training
Magnification
Average testing
performance
over all
magnifications
Training
Magnification
Average testing
performance
over all
magnifications
Testing Magnification Testing Magnification
40× 100× 200× 400× 40× 100× 200× 400×
40× 95.99 93.77 87.10 90.68 91.88 40× 94.50 85.10 83.90 84.90 87.10
100× 89.97 94.72 92.31 89.86 91.72 100× 88.70 89.00 84.70 83.40 87.50
200× 87.97 89.69 94.79 93.70 91.54 200× 86.70 87.10 89.30 88.50 87.90
400× 89.31 88.49 91.47 97.69 91.74 400× 84.70 82.50 86.40 87.90 85.40
Table 3: Comparison of computational requirements and throughput of all the models for image classification on the BreakHis
dataset.
Model Input
Resolution
#Params
GPU consumption
for batch size of 64
(GB)
Throughput (img/s)
Train Inference
ResNet-34 672 × 448 21.3 M 37.6 107 80
MobileNetV3-Small 075 672 × 448 1.0 M 9.1 87 100
ViT-S/16 384 × 384 21.7 M 17.4 106 101
Swin-B 384 × 384 86.7 M 52.5 75 82
ConvMixer-1024/20 672 × 448 23.5 M 53.6 53 83
MLP-Mixer-S/16 224 × 224 18.0 M 10.3 141 104
FNet-256/8 672 × 448 2.4 M 1254.4 2 13
WaveMix-224/10 672 × 448 10.6 M 70.2 72 81
BIOIMAGING 2024 - 11th International Conference on Bioimaging
220
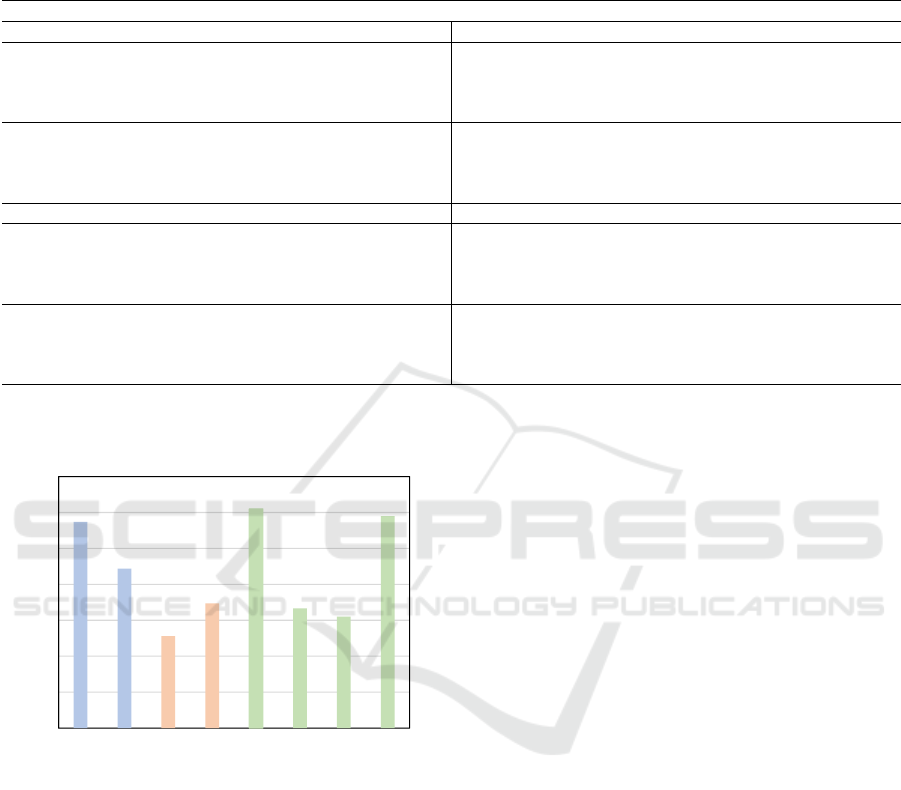
Table 4: Results of cross-magnification classification performance of token-mixers with class-weighted accuracy reported on
test set for a better understanding of performance of models on the imbalanced BreakHis dataset. Class-weighted accuracy
computes a weighted average of accuracies for different classes, taking into account the class distribution where weights are
determined by the proportion of samples in each class.
Token-Mixers
ConvMixer-1024/20 MLP-Mixer-S/16
Training
Magnification
Average testing
performance
over all
magnifications
Training
Magnification
Average testing
performance
over all
magnifications
Testing Magnification Testing Magnification
40× 100× 200× 400× 40× 100× 200× 400×
40× 93.58 85.93 85.41 80.59 86.38 40× 89.19 85.67 81.25 71.85 81.99
100× 86.89 90.35 86.38 79.12 85.69 100× 82.16 85.11 87.84 86.77 85.47
200× 88.35 90.75 96.32 91.76 91.80 200× 83.39 84.27 92.94 89.68 87.57
400× 81.32 81.69 83.2 96.21 85.61 400× 83.46 83.57 84.86 86.57 84.62
WaveMix-224/10 F-Net-256/8
Training
Magnification
Average testing
performance
over all
magnifications
Training
Magnification
Average testing
performance
over all
magnifications
Testing Magnification Testing Magnification
40× 100× 200× 400× 40× 100× 200× 400×
40× 91.03 90.70 83.00 81.23 86.49 40× 85.61 84.11 83.50 79.66 83.22
100× 93.59 96.48 90.20 85.23 91.38 100× 83.36 84.79 83.25 82.36 83.44
200× 85.78 90.94 98.51 90.37 91.40 200× 82.31 84.43 86.99 86.03 84.94
400× 82.33 84.95 85.81 96.87 87.49 400× 71.33 75.40 82.36 83.33 78.10
ResNet
-34
MobileNetV3
-Small 075
ViT-S/16
Swin-B
ConvMixer
-1024/20
MLP-Mixer-S/16
Fnet-256/8
WaveMix
-224/10
84
86
88
90
92
94
96
98
Accuracy
Models
Average testing accuracy for same training
magnification
Figure 4: Average test accuracy when training and testing
was done on same magnification for each model.
curacy for each class separately and then uses a
weighted average to compute the overall accuracy,
where the weights are based on the inverse of the class
frequencies. This metric is more insightful for im-
balanced datasets because it gives more weight to the
minority class, which is often the class of interest in
real-world applications such as cancer detection. Tra-
ditional metrics like accuracy can often be misleading
on imbalanced datasets like BreakHis dataset where
malignant cases outnumber benign cases more than
2:1. The class-weighted accuracy is reported for all
the token-mixers in Table 4. We see the similar re-
sults as observed in Table 2 where WaveMix is out-
performing all the other token-mixers.
FNet consumed largest GPU RAM (4-8× more)
compared to other architectures. CNN-based models
perform much better than transformer model-based
models in BreakHis classification. There is a signifi-
cant drop in performance when the transformer-based
models are trained on 40× magnification and tested
for other magnifications. Similar drop in accuracy
for 40× magnification testing was observed for MLP-
Mixer.
Since the input resolution for the reported re-
sults of MLP-Mixer, ViT and Swin-transformer were
lower, we also experimented with increased resolu-
tions. These results did not show any improvement
over the reported results.
4 CONCLUSIONS
Our study evaluated the robustness of various deep
learning models for histopathological image analy-
sis under different testing magnifications. We com-
pared ResNet, MobileNet, Vision Transformers, Swin
Transformers, Fourier-Net (FNet), ConvMixer, MLP-
Mixer, and WaveMix using the BreakHis (Spanhol
et al., 2015) dataset. Our experiments demonstrated
that the WaveMix architecture, which intrinsically in-
corporates multi-resolution features, is the most ro-
bust model to changes in inference magnification. We
observed a stable accuracy of at least 87% across all
test scenarios. These findings highlight the impor-
tance of implementing a robust architecture, such as
WaveMix, not only for histopathological image anal-
ysis but also for medical image analysis in general.
Magnification Invariant Medical Image Analysis: A Comparison of Convolutional Networks, Vision Transformers, and Token Mixers
221

This would help to ensure that anatomical features of
diverse scales do not influence the accuracy of deep
learning-based systems, thereby improving the relia-
bility of diagnostic inference in clinical practice.
REFERENCES
Alkassar, S., Jebur, B. A., Abdullah, M. A., Al-Khalidy,
J. H., and Chambers, J. A. (2021). Going deeper:
magnification-invariant approach for breast cancer
classification using histopathological images. IET
Computer Vision, 15(2):151–164.
Chakraborty, S. and Mali, K. (2023). An overview of
biomedical image analysis from the deep learning per-
spective. Research Anthology on Improving Medi-
cal Imaging Techniques for Analysis and Intervention,
pages 43–59.
Chan, H.-P., Samala, R. K., Hadjiiski, L. M., and Zhou,
C. (2020). Deep learning in medical image analy-
sis. Deep Learning in Medical Image Analysis: Chal-
lenges and Applications, pages 3–21.
Cherian Kurian, N., Sethi, A., Reddy Konduru, A., Maha-
jan, A., and Rane, S. U. (2021). A 2021 update on
cancer image analytics with deep learning. Wiley In-
terdisciplinary Reviews: Data Mining and Knowledge
Discovery, 11(4):e1410.
Dosovitskiy, A., Beyer, L., Kolesnikov, A., Weissenborn,
D., Zhai, X., Unterthiner, T., Dehghani, M., Minderer,
M., Heigold, G., Gelly, S., Uszkoreit, J., and Houlsby,
N. (2021). An image is worth 16x16 words: Trans-
formers for image recognition at scale. In Interna-
tional Conference on Learning Representations.
Duncan, J. S. and Ayache, N. (2000). Medical image anal-
ysis: Progress over two decades and the challenges
ahead. IEEE transactions on pattern analysis and ma-
chine intelligence, 22(1):85–106.
Gupta, R. K., Nandgaonkar, S., Kurian, N. C., Rane, S.,
and Sethi, A. (2022). Egfr mutation prediction of lung
biopsy images using deep learning. arXiv preprint
arXiv:2208.12506.
Gupta, V. and Bhavsar, A. (2017). Breast cancer histopatho-
logical image classification: is magnification impor-
tant? In Proceedings of the IEEE conference on com-
puter vision and pattern recognition workshops, pages
17–24.
Hassani, A., Walton, S., Shah, N., Abuduweili, A., Li, J.,
and Shi, H. (2021). Escaping the big data paradigm
with compact transformers.
He, K., Zhang, X., Ren, S., and Sun, J. (2016). Deep resid-
ual learning for image recognition. In Proceedings of
the IEEE conference on computer vision and pattern
recognition, pages 770–778.
Howard, A. G., Zhu, M., Chen, B., Kalenichenko, D.,
Wang, W., Weyand, T., Andreetto, M., and Adam, H.
(2017). MobileNets: Efficient convolutional neural
networks for mobile vision applications.
Jeevan, P., Viswanathan, K., S, A. A., and Sethi, A. (2023).
Wavemix: A resource-efficient neural network for im-
age analysis.
Lee-Thorp, J., Ainslie, J., Eckstein, I., and Ontanon, S.
(2021). Fnet: Mixing tokens with fourier transforms.
arXiv preprint arXiv:2105.03824.
Li, Q., Cai, W., Wang, X., Zhou, Y., Feng, D. D., and Chen,
M. (2014). Medical image classification with convo-
lutional neural network. In 2014 13th international
conference on control automation robotics & vision
(ICARCV), pages 844–848. IEEE.
Liu, Z., Lin, Y., Cao, Y., Hu, H., Wei, Y., Zhang, Z., Lin,
S., and Guo, B. (2021). Swin transformer: Hierar-
chical vision transformer using shifted windows. In
Proceedings of the IEEE/CVF international confer-
ence on computer vision, pages 10012–10022.
Spanhol, F. A., Oliveira, L. S., Petitjean, C., and Heutte, L.
(2015). A dataset for breast cancer histopathological
image classification. Ieee transactions on biomedical
engineering, 63(7):1455–1462.
Tolstikhin, I. O., Houlsby, N., Kolesnikov, A., Beyer, L.,
Zhai, X., Unterthiner, T., Yung, J., Steiner, A., Key-
sers, D., Uszkoreit, J., et al. (2021). Mlp-mixer: An
all-mlp architecture for vision. Advances in neural in-
formation processing systems, 34:24261–24272.
Trockman, A. and Kolter, J. Z. (2022). Patches are all you
need? arXiv preprint arXiv:2201.09792.
Wightman, R. (2019). Pytorch image models. https://gith
ub.com/rwightman/pytorch-image-models.
Yu, W., Luo, M., Zhou, P., Si, C., Zhou, Y., Wang, X., Feng,
J., and Yan, S. (2022). Metaformer is actually what
you need for vision. In Proceedings of the IEEE/CVF
conference on computer vision and pattern recogni-
tion, pages 10819–10829.
BIOIMAGING 2024 - 11th International Conference on Bioimaging
222
