
Social Implications of OCEAN Personality: An Automated BERT-Based
Approach
Chaitanya Chakka, Bathini Sai Akash and Aruna Malapati
Department of Computer Science & Information Systems, BITS Pilani Hyderabad Campus, Hyderabad, India
Keywords:
Personality Prediction, Machine Learning, OCEAN, BERT.
Abstract:
The importance of personality within society is paramount, as it profoundly influences individual and col-
lective behaviors, interpersonal interactions, and the overall functionality of societies. However, for a long
time, personality detection from online social texts has been lacking in performance. This is due to the limited
data availability and constrained supervised learning frameworks over small labeled datasets. In this work, we
present a novel approach to personality prediction utilizing BERT in conjunction with two notable datasets,
achieving proficient accuracy across the OCEAN traits. The research also extracts linguistic cues that do not
require supervision. Finally, we perform extensive empirical analysis to conclude over four research questions
that deal with the social implications of personality. The approach provides pragmatic results, making use of
the designed automatic personality prediction pipeline. The code has also been made open source to facilitate
enhanced innovation and research benefits (https://github.com/LearningLeopard/personality-prediction).
1 INTRODUCTION
A person’s personality substantially impacts how he
or she makes life decisions, desires, mental and phys-
ical health, and/or way of life. Due to this, various
academic fields have taken a keen interest in ana-
lyzing and predicting one’s personality. Some appli-
cations of personality prediction include recommen-
dation systems(Dhelim et al., 2022) where sugges-
tions are made for a suitable friend based on differ-
ent aspects of their digital-social footprint. To an-
alyze a person’s personality from a computational
perspective, many consensuses have been proposed
over the past few decades, including the Big Five
Model(also called the OCEAN model) and the Myers-
Briggs Type Indicator(MBTI), and these models can
be used to predict the personality of a person by
exploiting any textual information they have writ-
ten. The Myers-Briggs Type Indicator determines a
person’s personality through a self-report question-
naire (Briggs Myers, 1998) developed by Katharine
Cook Briggs and her daughter Isabel Briggs Myers in
1944. The categories are as follows; Introversion (I)
vs. Extraversion (E)(Energy orientation), Sensing (S)
vs. Intuition (N)(reliance on facts), Thinking (T) vs.
Feeling (F)(logic and objectivity), Perceiving (P) vs.
Judging (J)(structure—perceives)
On the other hand, the Big Five model has been
developed by many researchers working indepen-
dently over the past century, but the foundational con-
cept can be attributed to Goldberg at the Oregon Re-
search Institute(Goldberg, 1990) in 1990. This mea-
sure consists of five traits, which are defined as fol-
lows:
• Openness: Openness to new emotions and experi-
ences makes a person more creative and unusual.
A pragmatic, information-driven, and occasion-
ally dogmatic individual has low openness.
• Conscientiousness: This category’s high scorers
are often stubborn and laser-focused. However,
someone with low conscientiousness may be more
flexible, impulsive, sloppy, and untrustworthy.
• Extroversion: Extroversion: represents affability.
High scorers in this attribute are forceful and pow-
erful socially. Those that score lower are intro-
verted and less sociable.
• Agreeableness: Very amiable people are kind and
obedient. The other extreme is agnostic and un-
cooperative. They prioritize self-interest over so-
cializing.
• Neuroticism: Neurotic individuals often have
emotional instability, making stressful circum-
stances harder to manage.
Textual data on social networking sites like blogs
494
Chakka, C., Akash, B. and Malapati, A.
Social Implications of OCEAN Personality: An Automated BERT-Based Approach.
DOI: 10.5220/0012362700003636
Paper published under CC license (CC BY-NC-ND 4.0)
In Proceedings of the 16th International Conference on Agents and Artificial Intelligence (ICAART 2024) - Volume 3, pages 494-506
ISBN: 978-989-758-680-4; ISSN: 2184-433X
Proceedings Copyright © 2024 by SCITEPRESS – Science and Technology Publications, Lda.

and posts conceive information that can be used to
determine the characteristics of a personality. With
the rise of Big data, researchers are now presented
with abundant data that can be exploited for such
analysis. In this paper, we investigate various ma-
chine learning approaches to assess their effective-
ness in predicting personality traits based on textual
data authored by individuals. To improve the super-
vised learning process, we investigate the integration
of various datasets, which leads to notable improve-
ments in model performance. Then, we undertake
a case study to investigate how distinct facets of an
individual’s life, like their zodiac sign, age, and oc-
cupation, can provide insights into their personality
using the most promising models from the above ex-
periments. To support the veracity of our conclusions,
we also provide extensive statistical analysis for each
factor across the traits of the Big Five model and all
inferences in the research pertaining to social impli-
cations are grounded in empirical evidence and de-
void of any biases or stereotypes. The pipeline is also
open-sourced for further innovation and facilitation of
Research. Thus, our contributions include:
• Extract The Bidirectional Encoder Representa-
tions from Transformers (BERT, for brevity) and
psycholinguistic embeddings from textual data
by combining two notable datasets for personal-
ity prediction and exploring different machine-
learning models for the task at hand.
• Tabularize the results for different approaches and
note some exceptionally performing models.
• Undertake a case study where we take the best-
performing model from the above experimenta-
tion and perform extensive empirical analysis on
how social factors like age, gender, profession,
and zodiac sign correlate with the OCEAN per-
sonality of a person.
The rest of the paper is organized as follows. In sec-
tion 2, we discuss related work in personality pre-
diction. In section 3, we introduce and describe the
properties of the different datasets involved in this pa-
per. We also combine the datasets involved into the
Big Five model and provide the necessary justifica-
tion. In section 4, we conduct the methodology where
we describe pre-processing and feature extraction us-
ing BERT and other linguistic lexicons. The differ-
ent approaches that are explored in this paper are also
briefed here. The experimental setup and the research
framework are expounded in section 5 and the results
and explained and discussed in section 6. The case
study and the results of the empirical analysis is re-
ported under section 7 followed by the conclusion in
section 8.
2 RELATED WORK
Due to its wide range of applications combined with
the emerging era of big data, personality detection
has led researchers to focus on using natural lan-
guage processing for the task. (Liu and Zhu, 2016)
took advantage of the temporal nature of the Sina Mi-
croblog dataset and created a Linguistic Represen-
tation Feature Vector(LRFV), which makes embed-
dings for each user using a modified version of the
Linguistic Inquiry Word Count(LIWC). A temporal
vector has been created with each value correspond-
ing to the LIWC frequency values, which are then re-
duced using the Fast Fourier transform. This was fur-
ther reduced using the Stacked Auto Encoders model
and passed through linear regression models for each
trait, yielding a best Pearson correlation coefficient of
0.258. The innovation in this model lies in creating
LRFV, which is created by transforming the blog data,
taking only the semantic meaning of the data, yielding
better results. (Qin et al., 2022) used textual features
and their digital footprint on social networking sites to
extract comprehensive embeddings for OCEAN value
prediction. Datasets have been obtained by conduct-
ing a survey using the NEO personality questionnaire
to extract the non-textual features. The model has
been tested on the unified Facebook dataset presented
at the International AAAI Conference on Weblogs
and Social Media(ICWSM) in 2013. Textual embed-
dings are generated using LDA for ten topics where
text features are obtained by taking the topic proba-
bility distribution of each text. These features were
passed through a multilayer perceptron with five neu-
ron outputs for each trait. When compared to several
models presented at the same conference as above, the
results demonstrate a significant improvement across
different metrics.
Although the two measures of personality seem to be
taking different approaches towards human behavior,
(Furnham, 1996) has researched the discernible over-
lap between them in 1996, where they conclude that
except for neuroticism, all the other traits of OCEAN
personality measure distinctly correlate with one of
the classifications of the MBTI personality. This
could help combine datasets that use different mea-
sures, thereby helping us with better prediction per-
formances. This approach was briefly employed by
(Katare et al., 2022), where feature extraction was
performed using GloVe and Bag of Words models,
and they showed a notable improvement in predict-
ing the model’s personality.
Through self-attention mechanisms that identify con-
textual ties in data, Transformers, a ground-breaking
machine learning architecture, has revolutionized nat-
Social Implications of OCEAN Personality: An Automated BERT-Based Approach
495

ural language processing and achieved cutting-edge
performance across various applications. The most
recent innovation in the field of NLP using this mech-
anism is the BERT language model developed by
Google in 2019(Devlin et al., 2019). (Kazameini
et al., 2020) has used multiple variations of the BERT
model to generate document embeddings, which were
then passed into a bagged SVM model. This model
was compared against Word2Vec models and multi-
layer perceptron and outperformed them with an ac-
curacy of 60 percent. In addition to their model sur-
passing the previous state-of-the-art, they were also
able to improve training times, which were decreased
from 50 hours to roughly 7 minutes. (Majumder
et al., 2017) devised a novel mechanism using Con-
volutional Neural network models(CNNs) to obtain
sentence embeddings from word vectors, and these
were aggregated into document vectors along with
Mairesse features. Datasets obtained were filtered us-
ing NRC Lexicon to have at least one emotionally
charged word, and word embeddings were generated
using the pretrained word2vec model. These were
passed to different classification models, and the re-
sults claimed to have outperformed state-of-the-art re-
sults across all traits of the Big Five model.
3 DATASET CREATION AND
PROCESSING
Personality prediction performance is remarkably re-
lated to both data quality and quantity. The cur-
rent state-of-the-art research was developed on scarce
datasets due to labeled data constraints. On inspec-
tion, the current research identified three standard la-
beled datasets for predicting personality.
We utilized the Essays dataset (Pennebaker and King,
1999), which includes 2468 student essays anno-
tated with OCEAN Big Five personality and Kag-
gle MTBI dataset(Jolly, 2017) with 8675 data points
gathered from the PersonalityCafe forum. Finally,
Facebook’s myPersonality dataset included a sample
of personality ratings using Facebook profile infor-
mation(Stillwell and Kosinski, 2015). The informa-
tion was gathered using a Facebook application that
included, among other psychological examinations, a
test of the Big Five personality characteristics. Hence,
we captured two datasets with OCEAN traits and one
with MTBI. The descriptive statistics are given in ta-
ble 1. We develop a novel approach to merge three
datasets. However, since there are two different mod-
els employed in each of the datasets, we leveraged the
1
https://www.personalitycafe.com
research in (Furnham, 1996) on the high correlation
between the two personality measures. The research
concluded that
1. Extroversion of Big Five correlates with Introver-
sion or Extraversion
2. Openness of Big Five correlates with Sensing or
Intuition
3. Agreeableness of Big Five correlates with Think-
ing or Feeling
4. Conscientiousness of Big Five correlates with
Perceiving or Judging
In accordance with this research, we created
a conjunction of the MTBI Kaggle dataset with
OCEAN essays and myPersonality datasets. Integra-
tion was performed in a column-by-column fashion.
It is to be noted that we leave neuroticism empty for
all the data points corresponding to the MTBI dataset.
In total, we get 21,059 data points in the final dataset.
Further, to check for data quality and perfor-
mance, we follow our research approach 5 based
on BERT without extensive fine-tuning and run pre-
liminary analysis and results. The produced results
are in the table 2) and are rather unconvincing. A
close inspection of the combined dataset revealed
that the MyPersonality dataset had tiny tokens per
sentence (approx. 20) compared to the other two
datasets(approx. 500)1. The model’s poor perfor-
mance is attributed to the present analysis’s depen-
dence on an ample contextual foundation within the
sentences, thereby enhancing the prediction of their
respective personality traits. Substantial enhancement
in performance was observed upon the removal of
this specific dataset. This observation underscores the
significance of recognizing that pre-trained encoder-
decoder models, such as BERT, rely on the volume
of information available to proficiently encapsulate
semantics and contextual nuances within sentences,
manifesting as data-intensive models. Hence, we fi-
nally propose using the Essays OCEAN dataset in
conjunction with the Kaggle MTBI dataset alone, re-
sulting in 11143 data points.
4 METHODOLOGY
4.1 Pre Processing Text Data
Aiming at extracting personality traits from textual
data containing a high degree of semantic informa-
tion, it becomes essential to carefully conserve and
extract the emotional context inherent in sentences
for optimal results. According to empirical evidence
ICAART 2024 - 16th International Conference on Agents and Artificial Intelligence
496

Table 1: Distributions of Datasets over each Personality Traits.
Dataset Description Sen Length EXT(0,1) OPN(0,1) AGR(0,1) CON(0,1) NEU(0,1)
Essays Dataset Essay is a large dataset
based on the stream of
consciousness that was
collected by Pennebaker
and Laura King
652 1191, 1276 1196, 1271 1157, 1310 1214, 1253 1234, 1233
myPersonality myPersonality was a pop-
ular Facebook application
created by David Stillwell
in 2007
14 5705, 4207 2546, 7366 4647, 5265 4554, 5358 6196, 3716
Personality Cafe This dataset is taken from
Kaggle, extracted from a
website called Personality
Cafe.
1
1267 6675, 1999 1197, 7747 3981,4693 5241, 3433 0, 0
Table 2: Accuracy Scores of Classical Models including all
Datasets.
Model name EXT OPN AGR CON
SVM 0.662 0.789 0.644 0.607
Logistic Regression 0.667 0.784 0.649 0.611
Random Forest 0.656 0.792 0.622 0.589
cited by (Majumder et al., 2017), excluding emotion-
ally neutral words from the dataset significantly im-
proves our model’s accuracy.
To facilitate this process, we utilized the
NRC Word-Emotion Association Lexicon
dataset(Mohammad and Turney, 2013), which
describes the emotional associations of individual
words with fundamental human emotions such as
anger, fear, anticipation, trust, surprise, sadness,
joy, and disgust, as well as general sentiments with
both positive and negative connotations. Using this
dataset, we systematically eliminated all lexemes
devoid of emotional associations, i.e., words that
do not correspond to any of the previously listed
emotions or sentiments. In addition, we standardized
the text by converting all text to lowercase and
removing extraneous characters such as $ and #,etc.
4.1.1 Pre-Trained Embeddings and BERT
The BERT model is a sophisticated deep learning-
based language model designed to generate sentence
embeddings. At the core of BERT’s architectural
framework lies a transformer model characterized by
a series of stacked encoders. It deploys embeddings
that dynamically adapt based on the contextual usage
of a given word across different sentences.
Vannila BERT has two variations: BERT
BASE
consists of 12 encoders and 12 bi-directional self-
attention heads, while BERT
LARGE
consists of 24 en-
coders and 16 self-attention heads. In this research,
we made use of BERT
BASE
to generate embeddings
from text data.
4.1.2 Psycholingustic Features
Psycholinguistic features are a set of linguistic at-
tributes and language characteristics closely related to
cognitive processes and psychological aspects of hu-
man language comprehension and production. These
characteristics illuminate the complex relationship
between language and the human psyche by reveal-
ing how individuals perceive, process, and use lan-
guage. There are methods to extract these features
from spoken and written language. These additional
features extracted for paragraphs/sentences correlate
with the person’s personality. Hence, we integrate
these features along with the extracted BERT embed-
dings. The features utilized in this research are shown
below:
1. LIWC Features: Linguistic Inquiry and Word
Count (LIWC) is a language statistical analysis
software, researchers have widely used it to ex-
tract attributes of text data(Golbeck et al., 2011).
The dictionary consists of 64 categories, and the
words fall into each category. The features are
calculated by the percentage of words present in
each category.
2. SenticNet: This lexicon associates different
words with conceptual primitives, namely pleas-
antness, sensitivity, attention, aptitude, and polar-
ity(Cambria et al., 2018). These features strongly
correlate with the Big Five personality model as
shown in Table 3.
3. NRC Emotion Lexicon: A lexicon of over
14,000 English words named under the eight emo-
tions: anger, anticipation, disgust, fear, joy, sad-
ness, surprise, trust, and sentiment. The final
ouput is a 10-dimension vector, the mean of all
values of emotionally charged words in the docu-
ment.
4. VAD Lexicon: This lexicon relates 20,000 En-
glish words with three more descriptors: valence,
Social Implications of OCEAN Personality: An Automated BERT-Based Approach
497

arousal, and dominance. Like NRC, it results in
a three-dimensional vector, which takes a VAD
value mean for all the words in the document.
5. Readability: These features are just statistical
data values that are linear regressors on surface
characteristics like number of words, syllabus,
and sentences. This results in a 31-dimension
vector that could enhance the final predictions of
OCEAN personality.
Table 3: Correlation between SenticNet concepts and Big
Five personality traits on Essay’s Dataset
2
.
Concepts O C E A N
Pleasantness 0.041 0.066 0.032 0.025 -0.075
Attention 0.113 -0.026 0.013 -0.007 -0.017
Sensitivity -0.011 -0.052 -0.064 -0.034 -0.022
Aptitude -0.045 0.112 0.052 0.081 0.020
Polarity 0.000 0.081 0.037 0.056 0.058
4.2 SMOTE for Class Imbalance
The initial statistics reveal that the dataset is mod-
erately imbalanced, with the majority class covering
70-80% in all traits. To overcome this, we have per-
formed re-sampling with SMOTE analysis. SMOTE
was performed only on the training set after the train-
test split, and the test set was left entirely intact.
Consequently, this would make the machine learning
models more versatile without exaggerating results.
4.3 Classical Machine Learning Models
Classical machine learning offers straightforward yet
potent models designed for classification. While
models such as Naive Bayes may prove inadequate
when tasked with capturing intricate information,
they nonetheless furnish a robust foundational bench-
mark against which the efficacy of alternative models
can be duly assessed concerning their performance.
The models considered are as follows:
1. Nave Bayes
2. Support Vector Machine(SVM)
3. Random Forest
4. Logistic Regression
4.4 Deep Learning Models
Deep Neural Networks (DNNs) have become indis-
pensable in Natural Language Processing (NLP) due
2
Source: Bottom-Up and Top-Down: Predicting Per-
sonality with Psycholinguistic and Language Model Fea-
tures.
to their remarkable ability to process and understand
human language. The success of DNNs in NLP can
be attributed to their ability to learn meaningful text
representations through deep learning automatically.
Multi-layer perceptron is one of the basic models in
Deep neural networks, which serves as a building
block for more complex systems. Hyper-parameters
include the number of layers, the number of neurons
per layer, and the activation for each layer. The last
layer contains one single neuron for binary classifica-
tion with a sigmoid activation function. We make use
of multiple variants of MLP with supervised learning.
4.5 LSTM with BERT
The BERT model extracts word or sentence embed-
dings as input for a complex analysis. However, it
can be used as a classifier by attaching a classifica-
tion head(any other deep learning network) and can
be trained with the backpropagation algorithm. This
classification head gives us a vast space of models to
try and see which will perform better in the analysis.
In this analysis, we have used a Bi-directional LSTM
as a classification head with varying layers and nodes
for each layer and observed the performance.
5 RESEARCH FRAMEWORK
This section describes the training framework for
each method described in the prior sections. Across
all the methods, we treated each Big Five personality
trait as a different binary classification problem. This
strategy ensures that each trait will have the freedom
to choose any other model independent of the other.
One important note is that since neuroticism is not
available in the MBTI dataset, this trait is restricted to
using only the smaller Essays dataset, which points to
a potential drawback of this analysis.
5.1 Feature Extraction Using BERT
The research uses pre-trained word embeddings from
the BERT
BASE
model. The features are extracted by
first taking a mean over each word embedding( cor-
responding to a vector with 768 features) to get sen-
tence embeddings. Next, a mean is computed over the
12 BERT transformer layers. Finally, each sentence is
morphed into a 768 feature vector.
ICAART 2024 - 16th International Conference on Agents and Artificial Intelligence
498

5.2 Integration of Psycholinguistic
Features
We take a conjunction of BERT embeddings with
the aforementioned Psycholinguistic Features. Com-
bined with language model features, these features
could help improve feature quality and capture more
semantic meaning. The final dataset consisted of 850
dimensions, where 768 were pre-trained embeddings
from BERT, while the remaining 82 features com-
prised five psycholinguistic groups.
5.3 Training of Different Models
Classical Models. Grid Search with cross-validation
strategy is employed to tune the hyperparameters
of all classical models and a baseline is setup using
the Gaussian Naive Bayes model. Since using all
the available parameters can drastically increase the
search space, the search space is restricted based on
the parameters’ relevance to the task.
Deep Learning Model. The DNN model is tuned
using Hyperband hyperparameter optimization
algorithm (O’Malley et al., 2019) for following
hyper-parameters: The number of hidden layers, neu-
rons per layer, initial learning rate, and the activation
function of each layer. The base model contains
the input layer of 850 dimensions, and the output
layer is a single neuron with sigmoid activation and
compiled with Adam learning rate optimizer with
Binary cross-entropy loss.
BERT as Classifier. The classification head can vary
the number of Bi-LSTM layers and how many neu-
rons each layer has and the output will be passed
through a Dense layer to lead to a single neuron layer
with sigmoid activation. A maximum of 50 epochs
was given with an early stopping strategy with a pa-
tience of 3.
6 RESULTS AND DISCUSSION
6.1 Classical Models
The results of this experiment are summarized in table
4. Out of the three classical models considered, SVM
has performed the best in three of the traits consid-
ered, while the Logistic Regression model performs
better agreeableness. Consciousness, although it had
the best prediction using the Random forest model,
the SVM model predicted with almost the same ac-
curacy. Although all of the models have very close
accuracy scores, it is safe to say that SVM has per-
formed the overall best across all the traits. BERT has
a small context length of 512 tokens, while our dataset
has an average of 800 tokens per sentence. To exploit
this, the experiment was repeated using embeddings
generated by the Longformer model (Beltagy et al.,
2020), which increased the model context length to
4096 tokens. The model elegantly captures longer
context using three strategies: sliding window atten-
tion, dilated sliding window attention, and global +
sliding window. Contrary to our expectations, the ac-
curacy did not improve from the original BERT base
uncased model’s accuracy across all traits.
6.2 Deep Learning Models
The tuned parameters and scores are in table 4, which
used the SMOTE re-sampled dataset. It was observed
that the SMOTE applied dataset required fewer layers
with fewer neurons, while the original dataset needed
a more complicated architecture. This can be at-
tributed to the SMOTE applied dataset having more
clustered and separable data points, making it eas-
ier for the model to learn the separation boundaries.
However, since the data points have increased com-
pared to the original dataset, training time was com-
paratively higher compared to the same. Multi-layer
perceptron performs notably better than the classical
models by an average of 2.2% except for the Con-
sciousness trait. In this case, classical models perform
significantly better than deep learning models.
6.3 BERT with LSTM
The results of this experiment are shown in the table
4. An important observation is that no matter how
much more complex we make the classification head,
the accuracy did not improve from the values reported
in the table. During the analysis, increasing the num-
ber of layers or the number of neurons, adding ad-
ditional normalization layers in between each LSTM
layer, or adding psycholinguistic layers did not make
any difference in the accuracy of the model. However,
it affected the convergence rate at which the model
achieved the best accuracy. Although Extraversion
and Openness traits have accuracies close to the best
achieved so far, the rest of the models performed sig-
nificantly worse. In this experiment, we skipped neu-
roticism because very little data is available for this
trait.
Social Implications of OCEAN Personality: An Automated BERT-Based Approach
499

Table 4: Accuracy Scores of All Models.
Model name Trait Hyper Parameters Training Score Testing Score
Gaussian
Naive
Bayes
Extroversion var smoothing: 1e-9 - 0.698
Openness var smoothing: 1e-9 - 0.759
Agreeableness var smoothing: 1e-9 - 0.646
Consciousness var smoothing: 1e-9 - 0.776
Neuroticism var smoothing: 1e-9 - 0.581
SVM
Extroversion Kernel: RBF, C: 55, Gamma:0.8 0.730 0.725
Openness Kernel: RBF, C: 10, Gamma: 0.8 0.799 0.798
Agreeableness Kernel: RBF, C: 100, Gamma: 0.008 0.710 0.713
Consciousness Kernel: RBF, C: 10, Gamma: 0.8 0.803 0.792
Neuroticism Kernel: RBF, C: 100, Gamma: 0.001 0.599 0.579
Logistic
Regression
Extroversion Solver: sag , Penalty: L2 , C: 20 0.699 0.711
Openness Solver: Saga , Penalty: L1 , C: 0.001 0.786 0.782
Agreeableness Solver: Newton-Cholesky , Penalty: L2 , C: 1 0.707 0.720
Consciousness Solver: Sag , Penalty: L2 , C: 0.01 0.765 0.765
Neuroticism Solver: Newton-cg , Penalty: L2 , C: 1 0.589 0.595
Random
Forest
Extroversion Criterion: Log-Loss , Max Features: sqrt 0.726 0.720
Openness Criterion: Gini , Max Features: sqrt 0.800 0.793
Agreeableness Criterion: Entropy , Max Features: none 0.685 0.682
Consciousness Criterion: Gini , Max Features: log2 0.798 0.795
Neuroticism Criterion: entropy , Max Features: None 0.589 0.559
Multi Layer
Perceptron
Extroversion Layers: (500, relu), Learning Rate: 0.008 - 0.751
Openness Layers: (300, elu);(500, elu);(200, relu), lr: 0.08 - 0.811
Agreeableness Layers: (200, relu);(300, selu), lr: 0.004 - 0.730
Consciousness Layers: (100, selu);(100, relu), lr: 0.002 - 0.653
Neuroticism Layers: (100, elu), lr: 0.01 - 0.617
BERT
LSTM
Extraversion No of layers: 2, Nodes: 175 0.703 0.718
Openness No of layers: 4, Nodes:200 0.787 0.775
Agreeableness No of layers: 1, Nodes:50 0.540 0.537
Consciousness No of layers: 1, Nodes: 350 0.575 0.608
7 CASE STUDY
The importance of personality in society cannot be
overstated, as it plays a fundamental role in shaping
individual and collective behavior, relationships, and
the overall functioning of communities. Some criti-
cal implications of personality in society are leader-
ship, Career and culture fit, mental health and well-
being, social and cultural norms, gender roles and
equality, etc. Substantial research has been done on
social behavior and personality(Webster and Ward,
2011; Singer and Singer, 1983; Schmitt et al., 2017).
The novelty of our research stems from the utiliza-
tion of mathematical models rooted in machine learn-
ing to articulate the complex social concerns interwo-
ven with personality. These methodologies introduce
original perspectives for discourse and pave the way
for comprehensive automation, as elucidated in sub-
sequent sections. In subsequent research on the topic,
the work answers the following questions:
RQ1: Is there a correlation between zodiac signs and
one’s personality traits?
RQ2: How is gender related to personality based on
empirical evidence?
RQ3: Is personality influenced by one’s occupational
role within society?
RQ4: How does personality evolve with advancing
age?
To empirically derive conclusions pertaining to
these inquiries, it was imperative to procure and ex-
tract a standardized dataset containing textual state-
ments associated with age, gender, zodiac signs, and
occupational roles. The dataset employed for this pur-
pose is outlined as follows.
7.1 Blog Authorship Corpus
The dataset was named the Blog Authorship corpus
and made available to the public on GitHub(Argamon
et al., 2009). Each data point is a file in this corpus
in XML format. The naming convention is shown be-
low:
<uniqueId>.<gender>.<age>.<designation>.<zodiacSign>.xml
Each XML file consists of each blog under a post
tag chronologically arranged under the blog tag. A
sample file is given below:
<Blog>
<date>31,May,2004</date>
ICAART 2024 - 16th International Conference on Agents and Artificial Intelligence
500

<post>
Well, everyone got up and going this
morning. It’s still raining,...
</post>
<date>29,May,2004</date>
<post>
My four-year old never stops talking
...
</post>
...
</Blog>
We parsed the data from the XML files and created
and collected a corpus of 483090 blogs. Each blog
corresponds to a person, and each person typically
writes more than one blog. Further, every person’s
gender, age, zodiac, and occupation was also ex-
tracted.
It is imperative to acknowledge that the current
study primarily focuses on comprehending the associ-
ations between prevalent beliefs and speculations that
could potentially have implications for a broader de-
mographic. It is essential to clarify that this research
refrains from making definitive assertions concerning
generic beliefs, relying solely on empirical evidence
to draw its conclusions.
To perform extensive analysis in order to answer
the different research questions posed, we run the
Blog Corpus through our pipeline 5 and generate all
OCEAN labels for each blog first. Since all our
questions are aimed at answering people’s respective
traits, it’s essential to take a trait to mean overall blogs
written by each person to get a personality measure
of each respective single person. After this step, we
generate OCEAN personality traits for 18393 peo-
ple. To employ statistical studies for empirical com-
parison for the research questions Mann–Whitney U
test(McKnight and Najab, 2010) Test was employed.
Mann–Whitney U test examines disparities between
two groups on a single, ordinal measure with no de-
fined distribution by generation of p values for each
entity pair. If the ’p’ value of a pair under consid-
eration is ≤0.05 we conclude that the entity pair has
a significant difference. The independent samples t-
test, on the other hand, assumes that the sole variable
under consideration conforms to the interval or ratio
scale of measurement, as opposed to the ordinal scale,
and follows a normal distribution. This test essen-
tially compares two unique groups. Therefore, the t-
test and the Mann-Whitney U are fundamentally anal-
ogous tests for detecting whether two sampled groups
belong to the same population. The Mann-Whitney U
is often preferred when the parametric requirements
of the t-test are not fulfilled by the data. Since we do
not have an equal number of data points, for example,
out of 18393 people, 1514 people have Gemini; 1470
Table 5: Average OCEAN values based on Zodiac Sign.
Zodiac Sign EXT AGR CON OPN NEU
Cancer 0.862 0.595 0.477 0.666 0.242
Libra 0.873 0.604 0.473 0.675 0.236
Capricorn 0.860 0.604 0.479 0.682 0.240
Sagittarius 0.863 0.603 0.477 0.671 0.239
Virgo 0.863 0.613 0.468 0.678 0.241
Leo 0.867 0.604 0.483 0.676 0.234
Pisces 0.864 0.593 0.473 0.681 0.242
Scorpio 0.862 0.603 0.470 0.672 0.240
Gemini 0.864 0.600 0.468 0.678 0.236
Taurus 0.857 0.621 0.482 0.677 0.236
Aries 0.857 0.607 0.482 0.676 0.240
Aquarius 0.863 0.607 0.465 0.680 0.241
have Sagittarius; 1709 have Virgo, and so on as zo-
diacs, respectively. The t-test assumptions fail here,
hence, we utilize the Mann–Whitney U test.
7.2 RQ1: Zodiac and Personality
A horoscope is an astrological map that shows the
positions of the sun, moon, and other celestial bod-
ies. These specific alignments of these bodies are
recorded during a person’s birth, which is believed to
provide insights into that person’s life. In Western
astrology, these specific alignments are called Zodiac
signs. We have 12 zodiac signs. Astrology has gained
quite a traction even though little scientific evidence
proves their claims. Horoscopes are frequently fea-
tured socially in magazines and newspapers, and most
people believe in these predictions. In order to reach
a conclusion, the influence of the 12 zodiac signs on
personality differences was thoroughly compared in
this part.
RQ1: Is there a correlation between zodiac signs
and one’s personality traits?
Direct OCEAN Value Analysis Based on Descrip-
tive Statistics: After extracting the 18,393 OCEAN
traits for each individual, we proceed to compute the
average OCEAN values corresponding to each of the
12 zodiac signs. The descriptive statistics are shown
in table 5. On first inspection, we note that neuroti-
cism(NEU) mean values are notably lower than the
other four OCEAN traits. This can be attributed to
the lower number of NEU-positive words(have NEU
as 1) and sentences in the Blog Corpus. On inspec-
tion of multiple text statements, it was found that the
overall tone of blogs was more neutral to composed
than anxious or tense. The statistics shown in Table 5
lead to the following observation: most mean values
in different trait categories seem highly similar even
though absolute values vary notably among traits.
Statistical Hypothesis Testing for Comparison of
Zodiac Personality Values. As noted, we used the
Mann–Whitney U test Test as our method for assess-
Social Implications of OCEAN Personality: An Automated BERT-Based Approach
501

Table 6: p values for zodiac signs.
Zodiac pair Trait P-value
(Capricorn, Virgo) NEU 0.047
(Gemini, Sagittarius ) AGR 0.015
(Sagittarius, Cancer) AGR 0.036
(Pisces, Gemini) AGR 0.012
(Pisces, Cancer) AGR 0.028
ing our hypotheses. The findings of the hypothe-
sis test are shown in table 6, as p-values. However,
we display only the Zodiac entity pairs with p-value
≤0.05. All other zodiac pairs not displayed have p-
values greater than 0.05. The Mann–Whitney U Test
provides a p-value to each possible pair of zodiac
signs for every personality trait when testing hypothe-
ses. The entity pair under examination does not sig-
nificantly differ from each other, as per the null hy-
pothesis (H0). We rejected the null hypothesis using
statistical hypothesis testing if the value of p≤0.05,
and we now declare that there is a significant differ-
ence in the personality measure for a specific trait ( in
OCEAN traits) of the zodiac pair.
On inspection of Table6, we note that only five
pairs have significant differences in personalities with
p values ≤0.05. Added to this, a majority of these
pairs are for Agreeableness. This means for the traits
Openness, Conscientiousness, and Extraversion there
is no notable significant difference based on zodiac
signs. In the case of Neuroticism, only the Capricorn-
Virgo pair has a significant difference.
Although there is a significant difference between
some zodiac pairs, overall, for all pairs, there seems
to be no substantial difference in comparison of per-
sonality measures in all traits. The mean values
from table5 suggest the same. Hence, we infer that
there exists no notable distinction in the person-
ality traits of Openness, Conscientiousness, and
Extroversion predicated upon zodiac signs, albeit
there is a marginal degree of variability. In con-
trast, with regard to Agreeableness, three spe-
cific zodiac pairings exhibit significant differences,
while for Neuroticism, one pairing demonstrates a
significant difference as shown.
7.3 RQ2: Gender Based Personality
The personalities of men and women seem to vary in a
number of ways. According to social role theories of
development, sociopolitical power disparities, gender
socialization, and perceived gender roles are the main
causes of gender inequalities(Schmitt et al., 2017).
Further, Gender-based personality differences can be
evident in various aspects of life, such as communi-
cation styles, career choices, relationship dynamics,
hobbies, decision-making, emotional expression, and
Table 7: Average OCEAN values based on Gender.
Gender EXT AGR CON OPN NEU
Male 0.854 0.583 0.501 0.694 0.2475
Female 0.872 0.626 0.449 0.657 0.230
educational preferences. These differences may influ-
ence how individuals interact with others and navigate
different life situations.(Saad and Sackett, 2002)
In this section, we investigate with empirical
methods the difference in gender-based personality,
which could help numerous fields for increased diver-
sity and well-being. To reach a conclusion, the influ-
ence of typically Male and Female gender on person-
ality traits was thoroughly compared in this part.
RQ2: How is gender related to personality based on
empirical evidence?
OCEAN Value Analysis Based on Descriptive
Statistics: As aforementioned, after extracting
OCEAN traits for each individual, we proceed to
compute the average OCEAN values corresponding
to male and female genders. The descriptive statistics
are shown in table 7. On the first inspection, we came
up with the following observations:
• There is a notable difference in mean EXT, AGR,
CON and OPN traits for male and female cate-
gories
• The mean difference for NEU appears to be triv-
ial.
• OPN and CON traits appear to exhibit the highest
degree of disparity between males and females.
Statistical Hypothesis Testing for Comparison of
Male-Female Personality. As noted, we used the
Mann–Whitney U test Test as our method for assess-
ing our hypotheses. The entity pair under examina-
tion does not significantly differ from each other, as
per the null hypothesis (H0). We rejected the null
hypothesis using statistical hypothesis testing if the
value of p≤0.05, and we now declare that there is a
significant difference in the personality measure for a
specific trait ( in OCEAN traits) based on Gender.
After running Mann–Whitney U test for all traits
for Male-Female pairs, only the p-value for Open-
ness(OPN) is shown to be ≤0.05. The p-value for
male-female pair for OPN is 8.05e-27. All other traits
show p-values greater than 0.05 showing no signif-
icant difference in male-female personality for each
trait respectively.
Thus we deduce that there is a noteworthy dif-
ference in Openness, Conscientiousness and Ex-
troversion based on mean trait values. There
seems to be minimal variation for Neuroticism.
However, there is clearly a significant difference
between male and female Openness . It’s essential
ICAART 2024 - 16th International Conference on Agents and Artificial Intelligence
502
to point out that these generalizations about gender-
based personality characteristics do not apply to ev-
eryone. Gender is merely one of many aspects that
influence each person’s distinctive personality char-
acteristics and actions. Human personalities range
widely. Also, when societal conventions and expec-
tations around gender change, there is less of a focus
on stereotyped gender roles and behaviors.
7.4 RQ3: Personality and Its Influence
on Occupational Industry
Personality can significantly influence career choices
and performance within specific industries. Different
industries often require distinct personality traits for
success. For example, extroversion and assertiveness
are valued in sales and marketing, while analytical
thinking and attention to detail are important in tech-
nology and IT. Adaptability and teamwork are often
crucial in healthcare, and creativity and innovation are
prized in the arts and design fields.(Gibby and Zickar,
2008)
RQ3: Is personality related to one’s occupational
role within society?
In the authorship corpus, 38 possible professional
industries were annotated for each person. A fair
number of people(6483) fell into unknown category,
hence these entries were removed for empirical com-
parison. Further since its too involved comparing 38
entity pairs, we manually captured 11 prominent in-
dustries and tagged each person based on this. In
this section, we investigate with empirical methods
the variation of personality in these 11 industries us-
ing the five ocean traits.
OCEAN Value Analysis Based on Descriptive
Statistics: The computed industry personality aver-
ages are shown as descriptive statistics in table 8. On
the first inspection, we infer the following observa-
tions:
• Education has an evident increase in EXT and
AGR but a dip in Conscientiousness.
• Highest CON is shown in the Non-Profit industry.
• Software and Entertainment industry have the
lowest CON. Furthermore, Software also has the
least AGR with the highest OPN
• NEU remains relatively stable for all three age
groups.
Statistical Hypothesis Testing for Comparison of
Personalities Based on Professional Industry. As
aforementioned, we used the Mann–Whitney U test
Test as our method for assessing our hypotheses. If
the value of p≤0.05, we now declare that there is
Table 8: Average OCEAN values based on Professional In-
dustry.
Professional Industry EXT AGR CON OPN NEU
Non-Profit 0.832 0.565 0.523 0.674 0.236
Education 0.875 0.646 0.465 0.680 0.236
Media and News 0.848 0.561 0.513 0.670 0.244
Marketing & Management 0.854 0.540 0.497 0.687 0.246
Software 0.863 0.546 0.486 0.711 0.260
Law and Government 0.845 0.557 0.504 0.677 0.233
Entertainment 0.847 0.581 0.479 0.648 0.230
Engineering & manufacturing 0.851 0.581 0.481 0.683 0.252
Medical 0.852 0.548 0.492 0.698 0.244
Hospitality 0.846 0.564 0.478 0.671 0.238
Finance 0.865 0.530 0.478 0.668 0.239
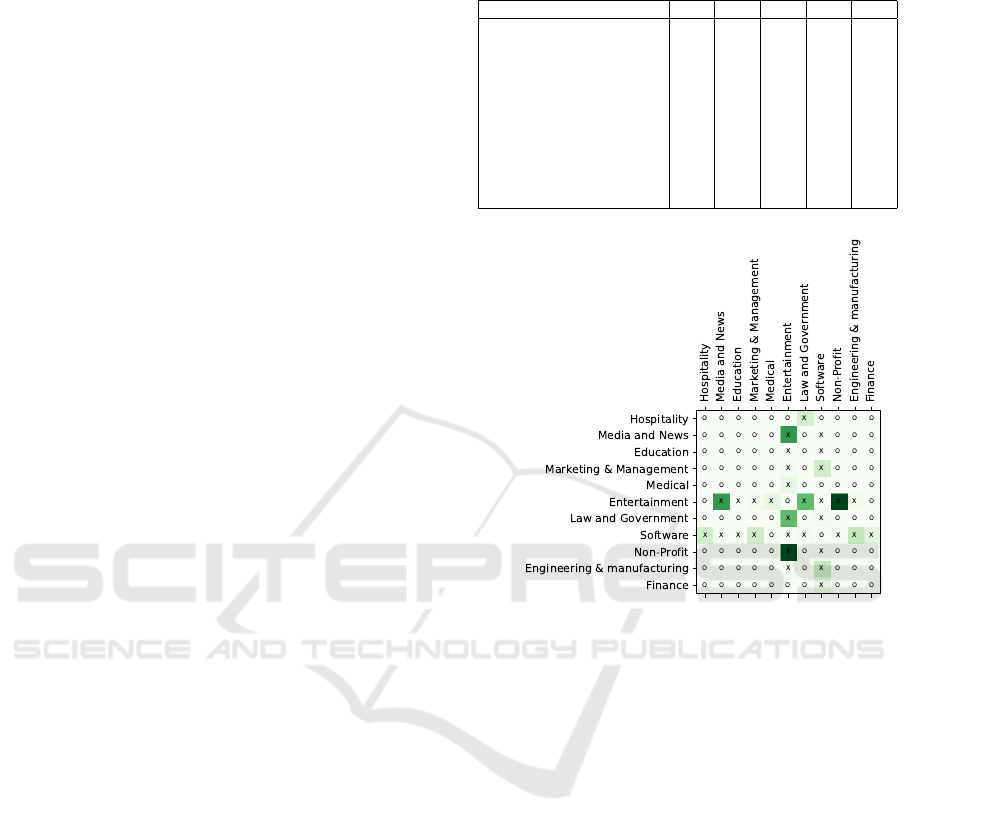
Figure 1: p values for Openness Trait for different indus-
tries.
a significant difference in the personality measure
based on industry for a specific trait ( in OCEAN
traits)
After running Mann–Whitney U test for all traits
for all industries, the results with p-values ≤0.05 are
shown in table9. Further, we show a graph for the
Openness trait exclusively in Fig(1). On inspection,
it is evident that Engineering and Manufacturing has
significant differences with multiple other industries
for AGR and NEU. Next, Law and Gov have signifi-
cant differences w.r.t shown industries for EXT, NEU,
and CON. The software industry shows a significant
difference from Med and Law for CON.
Further, in the case of OPN, there are multiple en-
tity pairs with significant differences. Software has
significant differences with almost every other indus-
try. Similarly, Entertainment has a significant differ-
ence with multiple other industries. Other notable en-
tity pairs with p values ≤0.05 are shown in Fig(1).
Thus we infer that there is a significant difference
in multiple industries in OCEAN traits. The dif-
ference is more pronounced in Engineering and
Manufacturing, Law and Gov, and Entertainment
Social Implications of OCEAN Personality: An Automated BERT-Based Approach
503

Table 9: p values for Industries.
Industry Trait P-value Industry Trait P-value
(Software, Med and New) CON 7.96e-11 (Med and New, Law and Gov) EXT 0.063
(Mark and Man,Law and Gov) CON 7.96e-11 (Edu, Law and Gov) EXT 0.037
(Eng and Man, Finance) NEU 0.044 (Edu, Eng and Man) NEU 0.035
(Eng and Man, Finance) NEU 0.044 (Edu, Eng and Man) NEU 0.035
(Eng and Man, Non-Pro) NEU 0.039 (Med and New, Eng and Man) AGR 0.030
(Eng and Man, Medical) AGR 0.018 (Edu, Eng and Man) AGR 0.002
(Eng and Man, Enter) AGR 0.006 (Edu, Law and Gov) AGR 0.008
(Eng and Man, Fin) AGR 0.035
and software industries respectively.
7.5 RQ4: Personality Variation with
Age
Theories on how people evolve with age, accord-
ing to research, is a period of significant changes
in objectives, resources, and coping(Cobb-Clark and
Schurer, 2012) Further, many academics who are in-
terested in personality characteristics and personality
evaluation are skeptical that personality changes in
significant and organized ways as people age. The
dataset also could be divided based on age. The
age categories were pre-defined by the authors of
the corpus. Additionally, Male and female bloggers
are equally represented in each age group. The age
groups are Teens(13-17), Young-Adults(23-27) and
Middle Adults(33-47).
In this section, we investigate with empirical
methods the evolution of personality with increasing
age. To reach a conclusion, the changes in all five
traits for three age groups were extensively compared
in this part.
RQ4: How does personality evolve with advancing
age?
OCEAN Value Analysis Based on Descriptive
Statistics: As aforementioned, after extracting
OCEAN traits for each individual, we proceed to
compute the average OCEAN values corresponding
to male and female genders. The descriptive statistics
are shown in table 7. On the first inspection, we come
up with the following observations:
• There is an evident difference in mean EXT, AGR
and CON between Teens and Young Adults
• Noticeable increment is shown from Young
Adults to Middle-aged Adults
• NEU remains relatively stable for all three age
groups.
Statistical Hypothesis Testing for Comparison of
Age Group Based Personality. As aforementioned,
we used the Mann–Whitney U test Test as our method
for assessing our hypotheses. If the value of p≤0.05,
Table 10: Average OCEAN values based on Age.
Age Brackets EXT AGR CON OPN NEU
Teens
(13-17)
0.895 0.699 0.436 0.687 0.239
Young-Adults (23-27) 0.853 0.549 0.490 0.662 0.238
Middle-Adults (33-47) 0.850 0.581 0.489 0.677 0.239
Table 11: p values for Age Groups.
age group pair Trait P-value
(Teens, Y-Adults) OPN 7.96e-11
(Teens, M-Adults ) OPN 0.028
(Y-Adults, M-Adults ) OPN 1.47e-12
we now declare that there is a significant difference
in the personality measure for a specific trait ( in
OCEAN traits) based on Age group category.
After running Mann–Whitney U test for all traits
for all age group pairs, the results with p-values ≤0.05
are shown in table 11. The p-value for every age
group pair for Openness are significantly different re-
spectively. This shows that there is drastic difference
in Openness as age progresses. All other traits show
p-values greater than 0.05.
Added to this, there is a clear dip in Extroversion
and Agreeableness from Teens to young adults. con-
scientiousness which typically grows with increasing
responsibility and age goes up from teens to young
adults as expected. Openness too slightly falls down
with age with significant differences in correlation for
each of the age groups. Thus we deduce that Ex-
troversion and Agreeableness notably reduce with
increasing age. Neuroticism remains relatively in-
variable. Openness significantly differs from teens
to Middle adults with decreases with age. Con-
scientiousness too notably increases from Teens to
young adults but remains stable after.
8 CONCLUSION
The paper aims the creation of a complete automa-
tion of personality detection with proficient perfor-
mance. We achieved the following superior results
on OCEAN personality prediction: Openness: 0.81,
Conscientiousness: 0.80, Extroversion: 0.75, Agree-
ICAART 2024 - 16th International Conference on Agents and Artificial Intelligence
504

ableness: 0.73, Neuroticism: 0.61.
Next, we perform an extensive comparative anal-
ysis of the social implications of personality with
prominent models and data. The results of the em-
pirical analysis is as follows:
• There is no significant difference in Openness,
Conscientiousness, and Extroversion personality
qualities based on zodiac signs.
• Openness is significantly difference between men
to women and there is an almost negligible differ-
ence in neuroticism.
• Personality variance in industries is more pro-
nounced for Engineering and Manufacturing, Law
and Government, and Entertainment and software
industries, respectively.
• Extroversion and Agreeableness decrease signif-
icantly with age. Neuroticism typically persists.
Teens through middle adults have dramatically
different openness, decreasing with age. Consci-
entiousness rises from teens to young adults but
stays consistent thereafter.
Further, the pipeline and code are made open
source adding to our objective of enhancing innova-
tion, improving social awareness, fostering commu-
nity, and providing cost-effectiveness. It is to be noted
that all the inferences in the research that involve
social implications are based entirely on predictions
and empirical evidence and are free of any biases or
stereotypes.
ACKNOWLEDGEMENTS
The authors gratefully acknowledge the computing
time provided on the high performance computing fa-
cility, Sharanga, at the Birla Institute of Technology
and Science - Pilani, Hyderabad Campus.
REFERENCES
Argamon, S., Koppel, M., Pennebaker, J. W., and Schler,
J. (2009). Automatically profiling the author of
an anonymous text. Communications of the ACM,
52(2):119–123.
Beltagy, I., Peters, M. E., and Cohan, A. (2020). Long-
former: The long-document transformer. arXiv
preprint arXiv:2004.05150.
Briggs Myers, I. (1998). Introduction to type. a guide to
understanding your results on the myers-briggs type
indicator. palo alto. California: Consulting Psychol-
ogists Press, Inc. Brown, Andrew (1998) Organisa-
tional Culture. Harlow: Pearson Buchanan, David
and Badham, Richard.(1999),’Politics and organiza-
tional change: the lived experience’, Human Rela-
tions, 52(5):609–629.
Cambria, E., Poria, S., Hazarika, D., and Kwok, K. (2018).
Senticnet 5: Discovering conceptual primitives for
sentiment analysis by means of context embeddings.
In Proceedings of the AAAI conference on artificial
intelligence, volume 32.
Cobb-Clark, D. A. and Schurer, S. (2012). The stabil-
ity of big-five personality traits. Economics Letters,
115(1):11–15.
Devlin, J., Chang, M.-W., Lee, K., and Toutanova, K.
(2019). Bert: Pre-training of deep bidirectional trans-
formers for language understanding.
Dhelim, S., Aung, N., Bouras, M. A., Ning, H., and Cam-
bria, E. (2022). A survey on personality-aware rec-
ommendation systems. Artificial Intelligence Review,
pages 1–46.
Furnham, A. (1996). The big five versus the big four: the
relationship between the myers-briggs type indicator
(mbti) and neo-pi five factor model of personality. Per-
sonality and individual differences, 21(2):303–307.
Gibby, R. E. and Zickar, M. J. (2008). A history of the
early days of personality testing in american industry:
An obsession with adjustment. History of psychology,
11(3):164.
Golbeck, J., Robles, C., Edmondson, M., and Turner, K.
(2011). Predicting personality from twitter. In 2011
IEEE third international conference on privacy, se-
curity, risk and trust and 2011 IEEE third interna-
tional conference on social computing, pages 149–
156. IEEE.
Goldberg, L. R. (1990). An alternative” description of per-
sonality”: the big-five factor structure. Journal of per-
sonality and social psychology, 59(6):1216.
Jolly, M. (2017). Myers-briggs personality type dataset.
Katare, G., Maurya, A., and Kumar, D. (2022). Personal-
ity prediction from text of social networking sites by
combining myers–briggs and big five models. In Pro-
ceedings of the International Conference on Cognitive
and Intelligent Computing: ICCIC 2021, Volume 1,
pages 363–372. Springer.
Kazameini, A., Fatehi, S., Mehta, Y., Eetemadi, S., and
Cambria, E. (2020). Personality trait detection us-
ing bagged svm over bert word embedding ensembles.
arXiv preprint arXiv:2010.01309.
Liu, X. and Zhu, T. (2016). Deep learning for construct-
ing microblog behavior representation to identify so-
cial media user’s personality. PeerJ Computer Sci-
ence, 2:e81.
Majumder, N., Poria, S., Gelbukh, A., and Cambria, E.
(2017). Deep learning-based document modeling for
personality detection from text. IEEE Intelligent Sys-
tems, 32(2):74–79.
McKnight, P. E. and Najab, J. (2010). Mann-whitney u test.
The Corsini encyclopedia of psychology, pages 1–1.
Mohammad, S. M. and Turney, P. D. (2013). Crowdsourc-
ing a word-emotion association lexicon. Computa-
tional Intelligence, 29(3):436–465.
Social Implications of OCEAN Personality: An Automated BERT-Based Approach
505

O’Malley, T., Bursztein, E., Long, J., Chollet, F., Jin, H.,
Invernizzi, L., et al. (2019). Kerastuner. https://github.
com/keras-team/keras-tuner.
Pennebaker, J. W. and King, L. A. (1999). Linguistic styles:
language use as an individual difference. Journal of
personality and social psychology, 77(6):1296.
Qin, X., Liu, Z., Liu, Y., Liu, S., Yang, B., Yin, L., Liu,
M., and Zheng, W. (2022). User ocean personality
model construction method using a bp neural network.
Electronics, 11(19):3022.
Saad, S. and Sackett, P. R. (2002). Investigating differen-
tial prediction by gender in employment-oriented per-
sonality measures. Journal of Applied Psychology,
87(4):667.
Schmitt, D. P., Long, A. E., McPhearson, A., O’Brien, K.,
Remmert, B., and Shah, S. H. (2017). Personality and
gender differences in global perspective. International
Journal of Psychology, 52:45–56.
Singer, J. L. and Singer, D. G. (1983). Psychologists look
at television: Cognitive, developmental, personality,
and social policy implications. American Psycholo-
gist, 38(7):826.
Stillwell, D. and Kosinski, M. (2015). mypersonality
project website.
Webster, M. M. and Ward, A. J. (2011). Personality and
social context. Biological reviews, 86(4):759–773.
ICAART 2024 - 16th International Conference on Agents and Artificial Intelligence
506
