
Antibiotic Prescriptions Before, During and after the Corona Pandemic
in Schleswig-Holstein with Prescription Data from 2017 till 2023
Reinhard Schuster
1
, Timo Emcke
2
, Vera Ries
3
, Eva von Arnstedt
4
and Mareike Burmester
4
1
Chair of Department of Health Economics, Epidemiology and Medical Informatics, Medical Advisory Board of Statutory
Health Insurance in Northern Germany (MD Nord), 23554 L
¨
ubeck, Germany
2
Chair of Department of Prescription Analysis, Association of Statutory Health Insurance Physicians, Germany
3
Medical Advisory Service Institution of the Statutory Health Insurance in North Rhine (MD Nordrhein), 40212 D
¨
usseldorf,
Germany
4
Medical Advisory Board of Statutory Health Insurance in Northern Germany (MD Nord), 23554 L
¨
ubeck, Germany
Keywords:
Corona Pandemic, Antibiotic Prescriptions, Big Routine Prescription Data, International ATC-Code.
Abstract:
The ongoing COVID-19 pandemic threatens the health of humans, causes great economic losses and may dis-
turb the stability of the societies and is a major challenge for physicians, politicians, scientists and many other
groups. The article focuses on patients with antibiotic prescriptions and considers their risks in comparison
to all patients. Time series are analyzed starting from the pre-Corona period till today. Mathematical analysis
can be used to understand aspects of the dynamics of epidemics and to improve strategies, i. e. regarding
effects of antibiotic stewardship programs or reaction to drug availability constraints.
1 INTRODUCTION
The Covid-19 pandemic is a major challenge for
physicians, politicians, scientists and many other
groups. Models help in the discussion of possible
scenarios, allow to monitor the consequences of in-
terventions and to generate more background knowl-
edge for the refinement of policy impact research,
cf. (Chinazzi et al., 2020), (Rosenbaum, 2020), (Pan
et al., 2020), (Behrens et al., 2020), (Tang et al.,
2020). The outbreak of the COVID-19 pandemic in
March 2020 led to significant changes in the burden
of disease and in the medication prescription patterns
in Germany. To turn up at work despite flu symp-
toms, even though it would be appropriate to report
sick, used to be daily occurrence, especially among
service employees. By contrast during the pandemic,
this had been viewed much more critically due to
the general risk of infection. Persons showing flu-
like symptoms were suspected as possible candidates
for SARS-CoV-2 virus infection. In most cases, they
were requested by the employer to stay at home to
prevent further spread of the illness. This effect as
well as the public pandemic-related infection protec-
tion measures starting in spring 2020 led to fewer res-
piratory infections and therefore fewer cases of inca-
pacity for work due to this diseases. The problem
of excessive use of reserve antibiotics has been dis-
cussed for a long time in the statutory health insur-
ance and changes during the pandemic are therefore
also relevant. Another problem are the delivery bot-
tlenecks, especially for antibiotics for children.
Nationwide antibiotic stewardship initiatives aim
to ban the inappropriately excessive use of antibiotics
and of reserve antibiotics for flu-like symptoms, so
changes during the pandemic are relevant to moni-
tor. Another relevant problem are pandemic-related
delivery bottlenecks, regarding unit dosage forms es-
pecially made for children, respectively.
2 MATERIAL AND METHODS
We analyse prescription and diagnostic data of the
most northern federal state of Germany (Schleswig-
Holstein) from quarters 1/2017 till 2/2023. The analy-
sis relates to patients, quarters and physicians. Count-
ing a patient as often as pairs of quarters and physi-
cians appear results in 153 million drug prescription
data records.
The C-related programming language awk is used
for the computations. The visualization is performed
using Mathematica by Wolfram Research and Mi-
crosoft Excel.
412
Schuster, R., Emcke, T., Ries, V., von Arnstedt, E. and Burmester, M.
Antibiotic Prescriptions Before, During and after the Corona Pandemic in Schleswig-Holstein with Prescription Data from 2017 till 2023.
DOI: 10.5220/0012361700003657
Paper published under CC license (CC BY-NC-ND 4.0)
In Proceedings of the 17th International Joint Conference on Biomedical Engineering Systems and Technologies (BIOSTEC 2024) - Volume 2, pages 412-419
ISBN: 978-989-758-688-0; ISSN: 2184-4305
Proceedings Copyright © 2024 by SCITEPRESS – Science and Technology Publications, Lda.
For the prescription analysis, the International
Anatomical Therapeutic Chemical classification sys-
tem (ATC) with specifications provided by the Ger-
man National Institute for Drugs and Medical Devices
(BfArM) is used with ATC code J01 as identifier for
antibiotic drugs, cf. (Fricke et al., 2009).
3 RESULTS
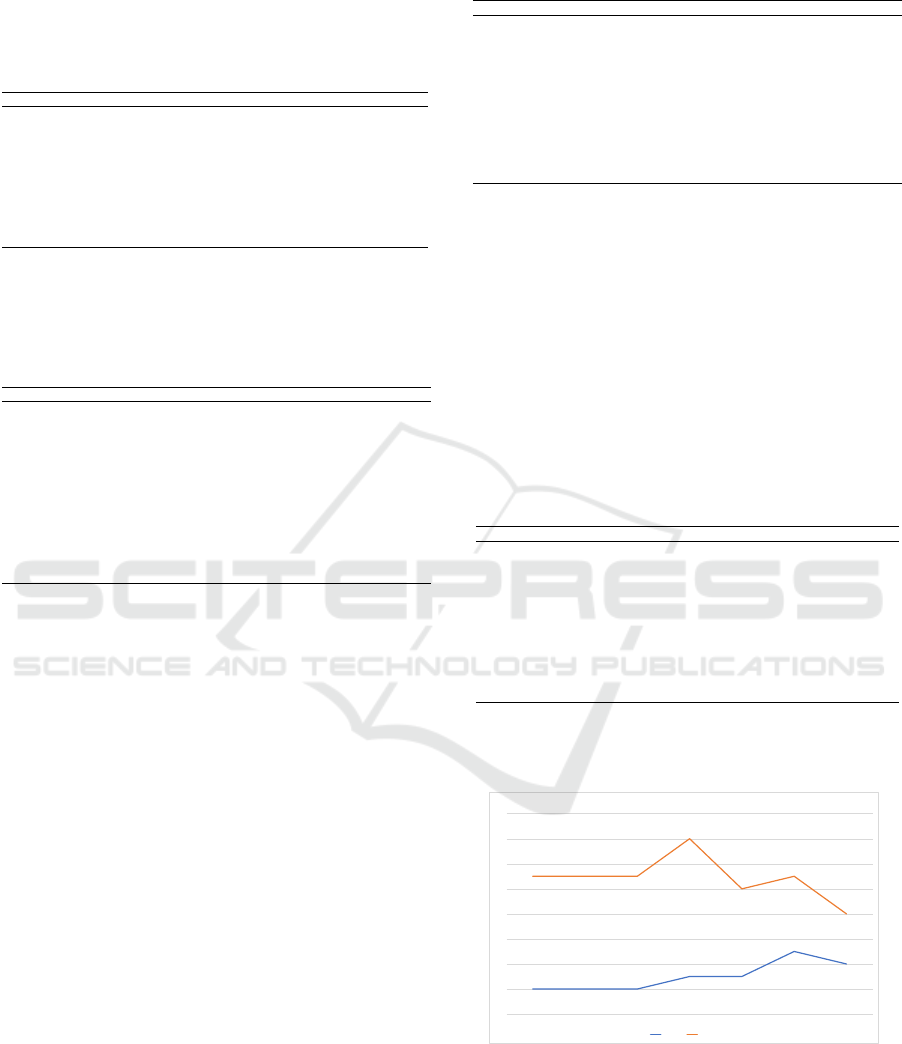
Comparing the total number of antibiotic prescrip-
tions per quarter in the period between the first quarter
of 2017 and the second quarter of 2023, there is both
a seasonal trend and a decrease per year in the pre-
Corona period from 2017 to 2020, cf . (Bornemann
and Tillmann, 2022). The decisive drop in the number
of prescriptions is observed following the pandemic
breakout in the second quarter of 2020 and continues
until the second quarter of 2021. The number of pre-
scriptions than rises again to reach the highest level
during the observation period in the first quarter of
2023, cf. (Kolbe, 2021), (Tarazi et al., 2021), (Patel
et al., 2021), (Olsen et al., 2020) and (Smits et al.,
2019). The reductions in the pre-Corona period were
overcompensated by the development after 2021, sug-
gesting that increased health risks are met in the pe-
riod after the Corona pandemic. The time series is
shown in Figure 1.
0
50.000
100.000
150.000
200.000
250.000
300.000
350.000
400.000
171 172 173 174 181 182 183 184 191 192 193 194 201 202 203 204 211 212 213 214 221 222 223 224 231 232
number of prescriptions
quarter
number of prescriptions per quarter
Figure 1: Time series of antibiotic prescriptions.
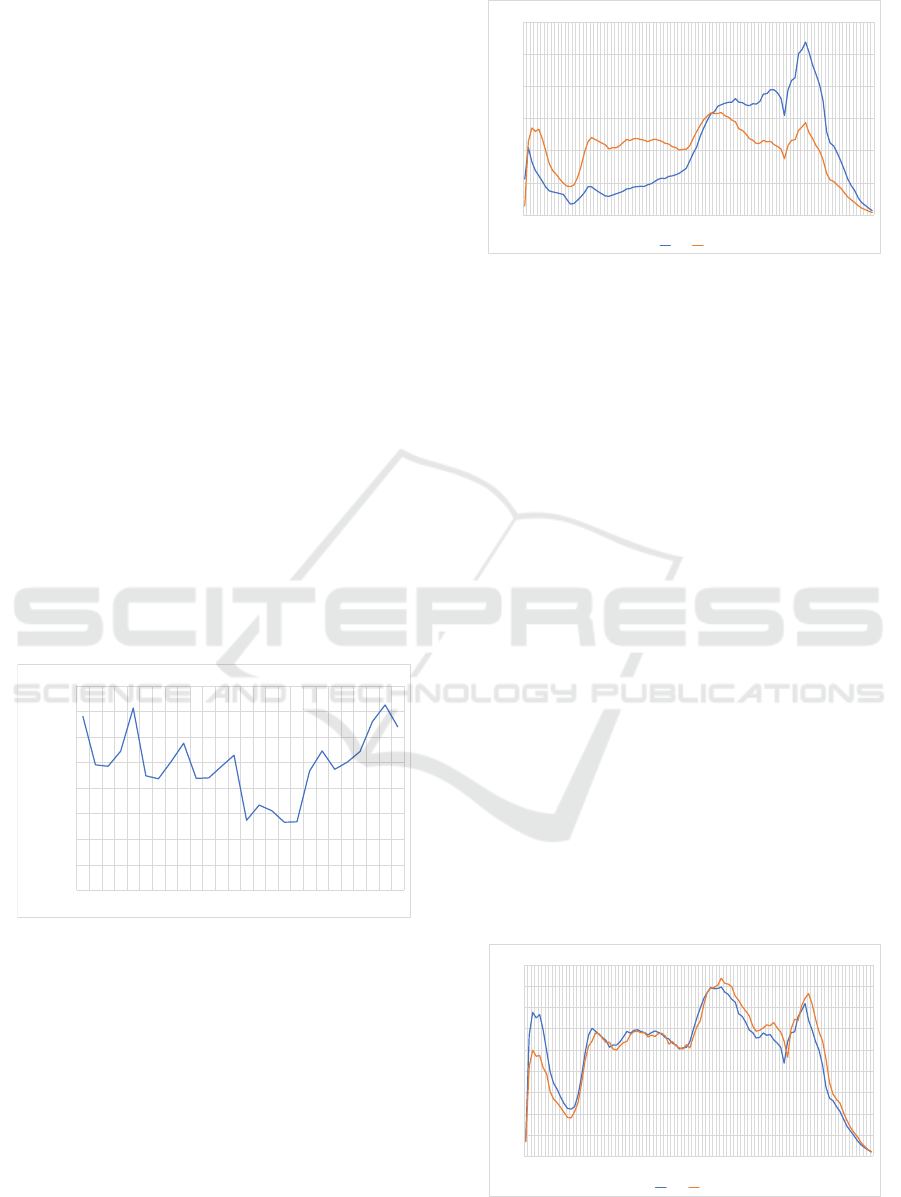
In order to consider the age distribution for all and
for antibiotic drugs in 2019, that means that the area
under the curve in Figure 2 is normed. The age dis-
tribution in 2020 is nearly the same, the differences
in the prescription numbers are almost completely
reduced by the normalization. Because aspects of
polypharmacy are included, it differs from the age
distribution of the related patients.
In contrast to all prescriptions, there is initially a
local maximum at the age of two to four years for
antibiotic prescriptions. This is followed by a rel-
ative minimum at the age of 13 for both observa-
0,0%
0,5%
1,0%
1,5%
2,0%
2,5%
3,0%
fraction
0 2 4 6 8 10 12 14 16 18 20 22 24 26 28 30 32 34 36 38 40 42 44 46 48 50 52 54 56 58 60 62 64 66 68 70 72 74 76 78 80 82 84 86 88 90 92 94 96 98
age
age distribution of drug prescriptions for all drugs and for antidiabetics
all drugs J01
Figure 2: Age distribution with respect to all drugs and for
antibiotic drugs.
tions. Again, there is another relative prescription
maximum for both observations at the age of 19 when
people start to assume working or studying. Consid-
ering antibiotic prescriptions, the absolute maximum
is reached between the ages of 53 and 56, while the
overall number of prescriptions continues to rise. At
the age of 54 years, there is an intersection of the nor-
malized curves. There is a narrow local minimum at
the end of the war in 1945, which corresponds to the
age of 74 in 2019. On one hand, the curves are char-
acterized by the slowly emerging baby boomer gen-
eration, on the other by the increased probability of
illness and death of older people. Both the choice of
antibiotics and the prescriptions as a whole peak at an
age of 80 (relatively for antibiotics, absolutely for all
prescriptions). Our age-related considerations of an-
tibiotic prescriptions in the pre-pandemic period and
during the pandemic are concordant with the findings
in (European Centre for Disease Prevention and Con-
trol, 2020), (Holstiege et al., 2019), (Augustin et al.,
2015), (Koller et al., 2013) and (Gillies et al., 2022).
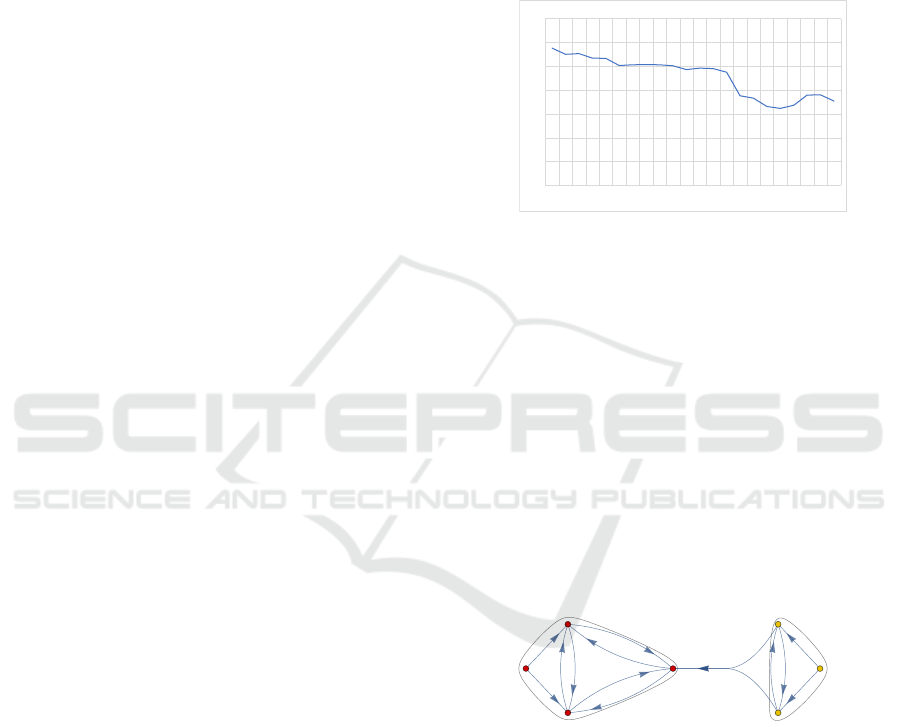
The age spectrum of antibiotic prescriptions in the
pre-Corona year 2019 and the year of the outbreak in
2020 barely differs, with a certain shift towards older
ages, Figure 3. This accounts for the generally higher
risk, but the insignificance of this effect is noteworthy.
0,0%
0,2%
0,4%
0,6%
0,8%
1,0%
1,2%
1,4%
1,6%
1,8%
0 2 4 6 8 10 12 14 16 18 20 22 24 26 28 30 32 34 36 38 40 42 44 46 48 50 52 54 56 58 60 62 64 66 68 70 72 74 76 78 80 82 84 86 88 90 92 94 96 98
fraction
age
Age distributions of antibiotic drugs 2019 and 2020
J 2019
J 2020
Figure 3: Age distributions for antibiotic drugs 2019 and
2020.
Antibiotic Prescriptions Before, During and after the Corona Pandemic in Schleswig-Holstein with Prescription Data from 2017 till 2023
413
We compare the prescription of antibiotics be-
tween 2019 and 2020 at different ATC levels and start
with the ATC 4 level, cf. Table 1.
Table 1: ATC 4 prescriptions 2019 and 2020.
ATC 4 nr. 2019 nr. 2020 diff.rel. drug group
J01C 301,672 218,899 -27.4 % beta-lactam antibacterials, peni-
cillins
J01D 205,392 151,232 -26.4 % other beta-lactam antibacterials
J01F 163,670 100,860 -38.4 % macrolides, lincosamides and
streptogramins
J01X 97,910 92,920 -5.1 % other antibacterials
J01E 72,058 58,767 -18.4 % sulfonamides and trimethoprim
J01M 78,787 57,409 -27.1 % quinolone antibacterials
J01A 48,368 42,672 -11.8 % tetracyclines
J01G 1,054 856 -18.8 % aminoglycoside antibacterials
Other changes appear considering the relative
fractions of prescriptions in the same context, cf. Ta-
ble 2.
Table 2: ATC 4 prescriptions 2019 and 2020.
ATC 4 frac. 2019 frac. 2020 diff.rel. drug group
J01C 31.1 % 30.3 % -2.8 % beta-lactam antibacterials,
penicillins
J01D 21.2 % 20.9 % -1.4 % other beta-lactam antibacte-
rials
J01F 16.9 % 13.9 % -17.5 % macrolides, lincosamides
and streptogramins
J01X 10.1 % 12.8 % 27.1 % other antibacterials
J01E 7.4 % 8.1 % 9.2 % sulfonamides and trimetho-
prim
J01M 8.1 % 7.9 % -2.4 % quinolone antibacterials
J01A 5.0 % 5.9 % 18.1 % tetracyclines
J01G 0.1 % 0.1 % 8.7 % aminoglycoside antibacteri-
als
The largest absolute decrease occurs at
”macrolides, lincosamides and streptogramins”
(J01F), followed by ”beta-lactam antibacterials,
penicillins” (J01C) and ”quinolone antibacterials”
(J01M). The largest increase of the relative fractions
occurs in the unspecific drug group ”other antibac-
terials” (J01X), followed by ”tetracyclines” (J01A)
and the smallest group with absolute prescriptions
numbers ”aminoglycoside antibacterials” (J01G).
The entropy e defined by e = −
∑
p
i
ln(p
i
) as a
measure of distribution differences increases slightly
from 0.772 to 0.785.
Prescription frequencies before the pandemic
(2019) and at the beginning of the Corona pandemic
(2020) are closely linked to the group of medical spe-
cialist prescribing. The largest decline in the num-
ber of prescriptions occurred among paediatricians (-
41.0%), followed by ENT doctors (-33.6%) and gen-
eral practitioners (-26.6%). There was a compara-
tively slight decline among gynaecologists (-3.2%),
followed by dermatologists (-3.8%), surgeons (-3.5%)
and urologists (-5.8%). Some ATC 4 drug groups
are primarily used in antibiotics by certain specialist
groups.
For the top 10 positions in terms of ATC 5 pre-
scription frequency in 2019, the changes from 2019
to 2020 are shown in Table 3.
Table 3: ATC 5 prescriptions 2019 and 2020.
ATC 5 nr. 2019 nr. 2020 diff.rel. drug group
J01CA 154,815 105,379 -31.9 % beta-lactam antibacterials, peni-
cillins
J01DC 152,422 101,789 -33.2 % other beta-lactam antibacterials
J01FA 139,762 79,163 -43.4 % macrolides, lincosamides and
streptogramins
J01CR 87,871 75,945 -13,6 % other antibacterials
J01MA 78,787 57,409 -27.1 % sulfonamides and trimethoprim
J01XX 77,724 73,215 -5.8 % quinolone antibacterials
J01EE 58,823 44,085 -25.1 % tetracyclines
J01CE 57,101 36,017 -36.9 % aminoglycoside antibacterials
J01AA 48,368 42,672 -11.8 % tetracyclines
J01DD 45,120 45456 0,7 % aminoglycoside antibacterials
The Drug group J01C (beta-lactam antibacteri-
als, penicillins) splits in subgroups: J01CA (beta-
lactam antibacterials, penicillins, -31.9%) and J01CE
(beta-lactam antibacterials, penicillins, -36.9%) whith
a marked decrease and J01CR (other antibacterials,
-13.6%) slowly decreasing. The drug group J01D
(other beta-lactam antibacterials, -26.4%) with de-
crease has the subgroup J01DD (aminoglycoside an-
tibacterials, +0.7%) with increased in drug prescrip-
tion numbers.
Next, we look at the ATC 7 drug level, cf. Table
4.
Table 4: ATC 7 prescriptions 2019 and 2020.
ATC 7 nr. 2019 nr. 2020 diff.rel. drug group
J01CA04 147,205 91,798 -37,6 % amoxicillin
J01DC02 112,231 77,543 -30,9 % cefuroxime
J01FA10 79,345 46,094 -41,9 % azithromycin
J01XX01 73,950 69,450 -6,1 % fosfomycin
J01EE01 58,823 44,085 -25,1 % sulfamethoxazole and trimetho-
prim
J01CR02 58,006 49,080 -15,4 % amoxicillin and beta-lactase in-
hibitors
J01MA02 54,980 40,859 -25,7 % ciprofloxacin
J01CE02 52,548 33,498 -36,3 % phenoxymethylpenicillin
J01DD13 43,531 44,146 1,4 % cefpodoxime
J01AA02 41,143 36,112 -12,2 % doxycycline
Using the ATC 7, we have again a more differen-
tiated picture on the level of active substances.
3,0
3,2
3,4
3,6
3,8
4,0
4,2
4,4
4,6
J 2017 J 2018 J 2019 J 2020 J 2021 J 2022 HJ 2023
polypharmacy for all patients and for patients with antibiotica
all drug plus J01
Figure 4: Time series for polypharmacy for all patients and
for patients with antibiotic drugs.
We consider the mean number of prescribed ac-
tive substances per patient at the ATC 7 level as a
measure of polypharmacy with a quarter as time refer-
ence. This is considered for all patients as well as for
HEALTHINF 2024 - 17th International Conference on Health Informatics
414
those who get an antibiotic prescription. Assuming
that the additional antibiotic prescription increases the
level of polypharmacy by one, instead does not nec-
essarily hold true, because patient groups may differ
in their morbidity.
In the pre-Corona period, the difference was only
slightly less than 1 at 0.9. At the beginning of the
pandemic in 2020, the polypharmacy value rose sig-
nificantly faster by 0.3 among antibiotic patients than
by 0.1 among all patients. In the following year 2022,
the polypharmacy value for all patients remains un-
changed compared to 2021, while the value for an-
tibiotic patients falls to 4.0, which is a lower value
than in the pre-Corona period. This trend intensifies
in the first half of 2023: There is an increase in all pa-
tients compared to 2021 and a reduction in antibiotic
patients, thus the difference is only 0.4.
Antimicrobial resistance (AMR) is a threat to
global health and development and it contributes to
millions of deaths worldwide each year, so the WHO
aims to improve the surveillance of antimicrobial re-
sistance through a global action plan on AMR in
order to reduce inappropriate antibiotic consump-
tion. The WHO Categories Access, Watch, Reserve
(AWaRe) provide concise, evidence-based guidance
on the choice of antibiotic, dose and route of ad-
ministration, cf. (World Health Organization, 2022b),
(World Health Organization, 2022a). As access an-
tibiotics show a narrow spectrum of activity, less side-
effects, a lower potential for the selection of antimi-
crobial resistance and lower cost, they are recom-
mended for the empiric treatment of most common
infections and should be widely available. Watch an-
tibiotics have a higher potential for the selection of
antimicrobial resistance, therefore, their use should
be restricted to sicker patients in hospital facility set-
tings carefully monitored to avoid overuse. Reserve
antibiotics are last-resort antibiotics that should only
be used to treat severe infections caused by multidrug-
resistant pathogens. The proportion of reserve antibi-
otics in our data is 0.17% for the entire period un-
der consideration, with no significant deviations. The
proportion of infections in the WHO ”watch” cate-
gory has fallen moderately since the beginning of our
analyses until quarter 2 of 2021, cf. Figure 5. This
will be related to extensive consultations with doc-
tors on this topic in the Germen region of Schleswig-
Holstein. Surprisingly, this trend remains almost the
same at the beginning of the pandemic. Only in the
third quarter of 2021, there is a significant change,
namely towards an even greater drop in the WHO
watch category fraction with a further moderate drop
until the second quarter of 2022. After a moderate
increase in the fourth quarter of 2022 and the first
quarter of 2023, the proportion falls moderately again
in the second quarter of 2023. In the middle part of
the pandemic and also when it expires, the proportion
of prescriptions in the WHO watch category showns
a positive trend already significantly reduced before
the pandemic. The extent to which this is caused by
prescription behavior or by changing disease states
should be investigated by further research.
0%
10%
20%
30%
40%
50%
60%
70%
181 182 183 184 191 192 193 194 201 202 203 204 211 212 213 214 221 222 223 224 231 232
fraction
quarter
fraction of antibiotic prescriptions in the WHO watch category
Figure 5: Prescription switch between drug groups within
an antibiotic therapy 2021 with clusters.
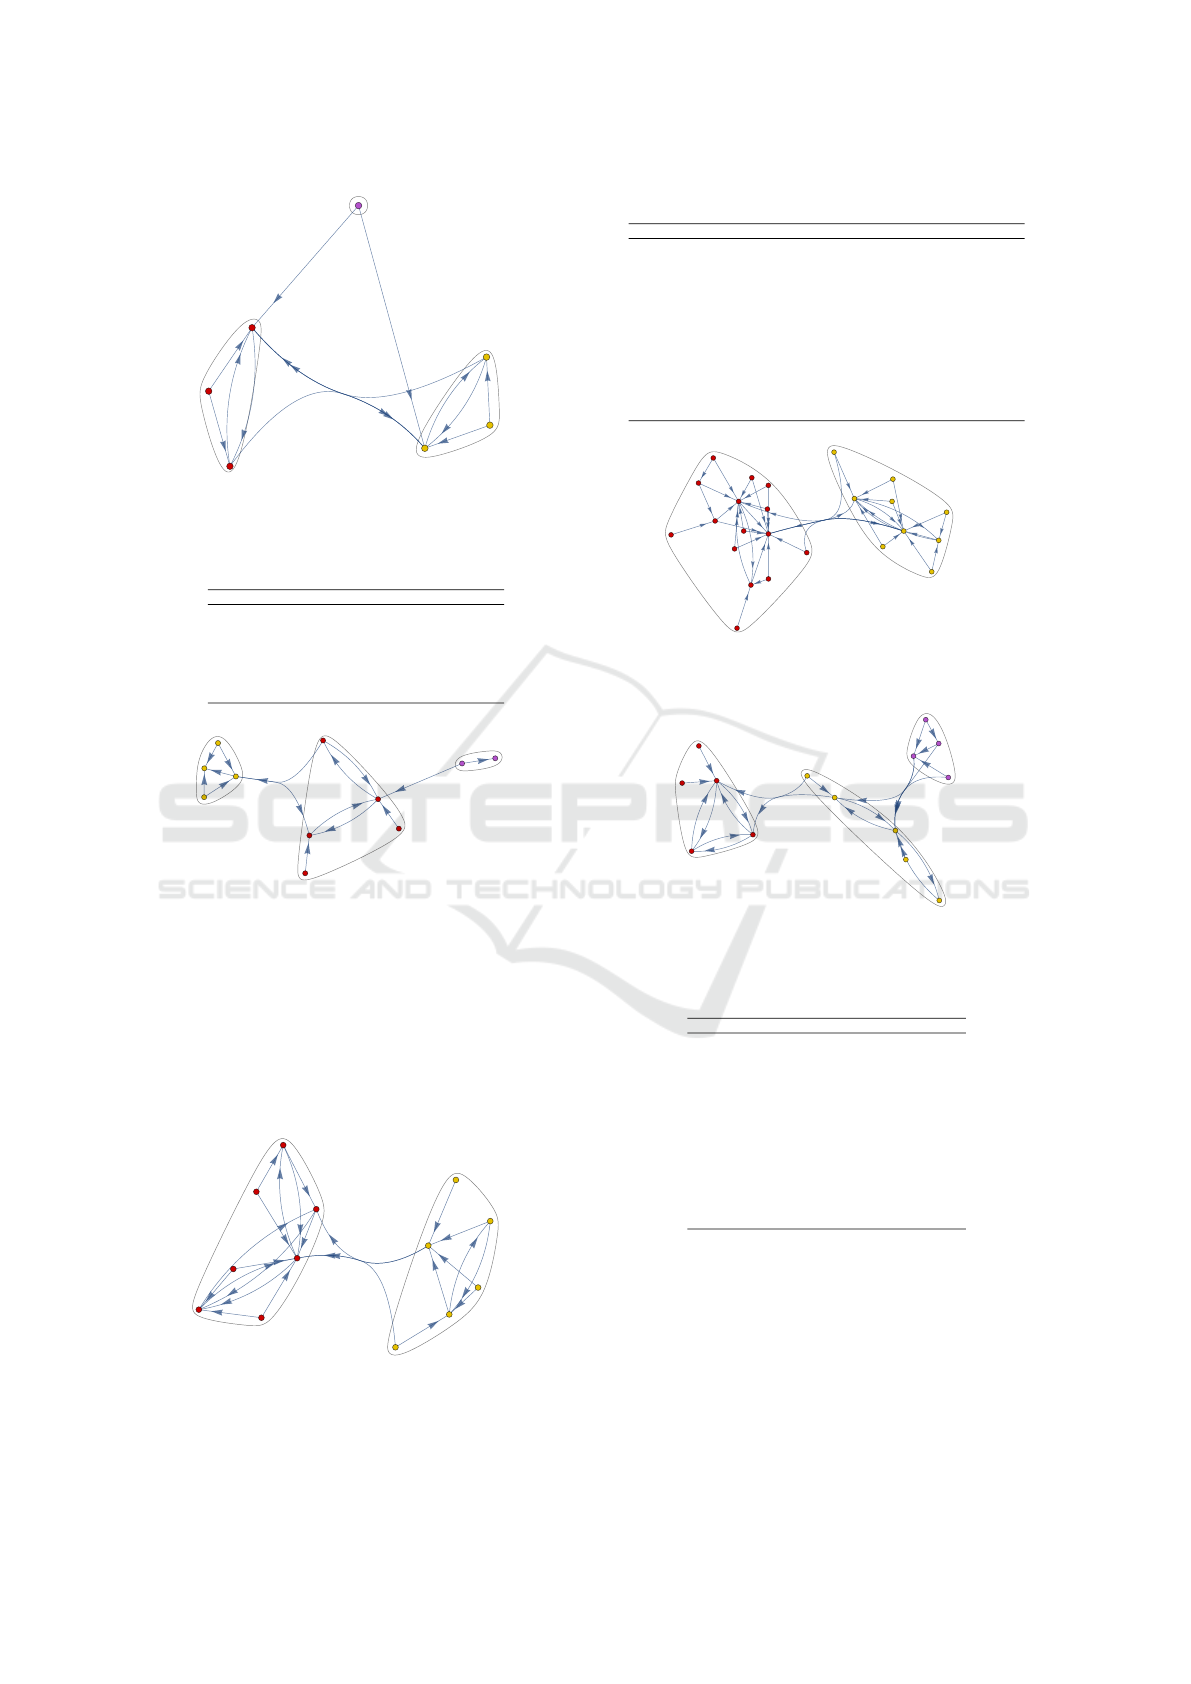
Next, we consider therapeutic replacements of
prescribed drug groups at different ATC-levels in
2018 before the pandemic and in 2021 during the
pandemic. For each drug group, we determine the
n = 2 other drug groups that it is most frequently re-
placed with, using at least 100 prescription changes as
a threshold to reduce graphical complexity. We con-
sider a graph visualisation with community clusters
performed with Mathematica by Wolfram Research.
The clusters are determined by minimizing the tran-
sitions between the clusters compared to the transi-
tions within the clusters; about graph theory methods,
see (Brooks, 1991), (Buser, 1978), (Chakrabarti and
Faloutsos, 2006), (Chung, 1997) and (Alon, 1998).
In[20]:=
atc = {{"J01A", "J01C"}, {"J01A", "J01F"}, {"J01C", "J01D"},
{"J01C", "J01F"}, {"J01D", "J01C"}, {"J01D", "J01F"}, {"J01E", "J01X"},
{"J01E", "J01M"}, {"J01F", "J01C"}, {"J01F", "J01D"}, {"J01M", "J01X"},
{"J01M", "J01D"}, {"J01X", "J01M"}, {"J01X", "J01D"}};
atcGraph =
Graph
Graph[
Tabelle
Table[atc[[i]][[1]] -> atc[[i]][[2]], {i, 1,
Länge
Length[atc]}],
Knotenbeschriftungen
VertexLabels → "Name"]
Out[20]=
J01A
J01C
J01F
J01D
J01E
J01X
J01M
In[21]:=
stelle Gemeinschaft graphisch dar
CommunityGraphPlot[atcGraph]
Out[21]=
J01A
J01C
J01F
J01D
J01E
J01X
J01M
Figure 6: Prescription switch between drug groups within
an antibiotic therapy 2018 with clusters.
The community cluster changed between 2018
(cf. Figure 6) and 2021 (cf. Figure 7) in J01M
(quinolone antibacterials) forming an own minimal
cluster in 2021 and J01D (other beta-lactam antibac-
terials) moving to the other primary cluster in 2018.
At ATC 5 level, there are major differences in
the community clusters, 2018 (cf. Figure 8) showing
three clusters and 2021 (cf. Figure 9) two cluster and
one more vertex. The drug group J01CA (penicillins
with extended spectrum) has one incoming edge in
2018 and five incoming edges in 2021, this drug group
Antibiotic Prescriptions Before, During and after the Corona Pandemic in Schleswig-Holstein with Prescription Data from 2017 till 2023
415
In[9]:=
stelle Gemeinschaft graphisch dar
CommunityGraphPlot[atcGraph]
Out[9]=
J01A
J01C
J01F
J01D
J01X
J01E
J01M
2
atc_4_2021.nb
Figure 7: Prescription switch between drug groups within
an antibiotic therapy 2021 with clusters.
Table 5: ATC 4 drug groups in transition graphs.
ATC 4 drug group
J01A tetracyclines
J01C beta-lactam antibacterials, penicillins
J01D other beta-lactam antibacterials
J01E sulfonamides and trimethoprim
J01F macrolides, lincosamides and streptogramins
J01M quinolone antibacterials
J01X other antibacterials
In[12]:=
stelle Gemeinschaft graphisch dar
CommunityGraphPlot[atcGraph]
Out[12]=
J01CA
J01FA
J01MA
J01CR
J01DC
J01AA
J01DD
J01EE
J01XX
J01FF
J01XE
2
atc_5_2018.nb
Figure 8: Prescription switch between drug groups within
an antibiotic therapy 2018 with clusters.
was changed to another more frequently than another
was changed to this group. Due to the extended spec-
trum of action of J01CA, the replacement may be mo-
tivated by theapeutic safety reasons, cf. (Holstiege
et al., 2022), (Langford et al., 2021), (Kern et al.,
2006) and (Filippini et al., 2006). Another possibil-
ity could be a change due to delivery difficulties.
In[ ]:=
Eigensystem
Eigensystem[ad2]
Out[]=
2., -1., - 1., - 1., 1., 1.11022 × 10
-16
, -5.55112 × 10
-17
, 0., 0., 0., 0., 0., 0.,
{0.285714, 0.285714, 0.285714, 0.285714, 0.285714, 0.285714,
0.285714, 0.285714, 0.142857, 0.285714, 0.285714, 0.285714, 0.285714},
{0.229416, 0.229416, -0.458831, 0.229416, 0.229416, 0.229416, 0.573539,
-0.114708, - 0.229416, 0.229416, -0.114708, 0.229416, - 0.114708},
{0.229416, 0.229416, -0.458831, 0.229416, 0.229416, 0.229416, 0.573539,
-0.114708, - 0.229416, 0.229416, -0.114708, 0.229416, - 0.114708},
{-0.229416, - 0.229416, 0.458831, -0.229416, - 0.229416, -0.229416,
-0.573539, 0.114708, 0.229416, - 0.229416, 0.114708, - 0.229416, 0.114708},
5.97306 × 10
-17
, -4.61881 × 10
-17
, 6.15841 × 10
-17
, -4.61881 × 10
-17
, 5.97306 × 10
-17
,
-4.61881 × 10
-17
, 0.5, 0.5, -4.65664 × 10
-17
, -4.61881 × 10
-17
, 0.5, 5.97306 × 10
-17
, 0.5,
1.84183 × 10
-16
, -3.70074 × 10
-17
, 3.70074 × 10
-17
, 3.70074 × 10
-17
,
1.84183 × 10
-16
, -3.70074 × 10
-17
, 0.666667, 3.70074 × 10
-17
, -0.333333,
-3.70074 × 10
-17
, 3.70074 × 10
-17
, 0.666667, -9.24072 × 10
-17
,
1.4457 × 10
-16
, 9.45405 × 10
-18
, -9.45405 × 10
-18
, -9.45405 × 10
-18
, 1.4457 × 10
-16
,
9.45405 × 10
-18
, -0.574192, 4.13281 × 10
-17
, 0.744501, -4.13281 × 10
-17
, 4.13281 × 10
-17
,
0.340618, 5.27262 × 10
-17
, {1., 0., 0., 0., 0., 0., 0., 0., 0., 0., 0., 0., 0.},
{0., 0., 0., 0., 1., 0., 0., 0., 0., 0., 0., 0., 0.},
{0., 0., 0., 0., 0., 0., 1., 0., 0., 0., 0., 0., 0.},
{0., 0., 0., 0., 0., 0., 0., 0., 1., 0., 0., 0., 0.},
{0., 0., 0., 0., 0., 0., 0., 0., 0., 0., 0., 1., 0.},
{0., 0., 0., 0., 0., 0., 0., 0., 0., 0., 0., 0., 1.}
In[14]:=
stelle Gemeinschaft graphisch dar
CommunityGraphPlot[atcGraph]
Out[14]=
J01AA
J01FA
J01CA
J01CR
J01CE
J01DC
J01DD
J01EE
J01EA
J01XX
J01MA
J01FF
J01XE
2
atc_5_2021.nb
Figure 9: Prescription switch between drug groups within
an antibiotic therapy 2021 with clusters.
Table 6: ATC 5 drug groups in transition graphs.
ATC 5 drug group
J01AA tetracyclines
J01CA penicillins with extended spectrum
J01CE beta-lactamase sensitive penicillins
J01CR combinations of penicillins, incl. beta-lactamase inhibitors
J01DC second-generation cephalosporins
J01DD third-generation cephalosporins
J01EA trimethoprim and derivatives
J01EE combinations of sulfonamides and trimethoprim, incl. derivatives
J01FA macrolides
J01FF lincosamides
J01MA fluoroquinolones
J01XE nitrofuran derivatives
J01XX other antibacterials
In[ ]:=
Eigensystem
Eigensystem[ad2]
Out[]=
{{2, -1, -1, -1, 1, 0, 0, 0, 0, 0, 0, 0, 0, 0, 0, 0, 0, 0, 0, 0, 0, 0, 0, 0},
{{2, 2, 2, 2, 2, 2, 2, 1, 2, 2, 2, 1, 2, 2, 2, 2, 2, 2, 2, 2, 2, 2, 2, 2},
{-1, 1, 0, -1, 0, 0, 0, 0, 0, -1, 1, 0, 1, 1, 1, 0, 0, 0, 0, 0, 0, 0, 1, 1},
{0, 0, 0, 0, 0, 0, 0, 0, 1, -1, 0, 0, -1, 0, 0, 0, 0, 0, 0, 1, 1, 1, 0, 0},
{-1, 0, 1, -1, 1, 1, 1, - 1, 0, 0, 0, -1, 1, 0, 0, 1, 1, 1, 1, 0, 0, 0, 0, 0},
{1, 0, 1, 1, 1, 1, 1, 1, 0, 0, 2, 1, 1, 0, 0, 3, 1, 1, 1, 0, 0, 0, 0, 0},
{0, 0, 0, 0, 0, 0, 0, 0, 0, 0, 0, 0, 0, 0, 0, 0, 0, 0, 0, 0, 0, 0, 0, 1},
{0, 0, 0, 0, 0, 0, 0, 0, 0, 0, 0, 0, 0, 0, 0, 0, 0, 0, 0, 0, 0, 0, 1, 0},
{0, 0, 0, 0, 0, 0, 0, 0, 0, 0, 0, 0, 0, 0, 0, 0, 0, 0, 0, 0, 0, 1, 0, 0},
{0, 0, 0, 0, 0, 0, 0, 0, 0, 0, 0, 0, 0, 0, 0, 0, 0, 0, 0, 0, 1, 0, 0, 0},
{0, 0, 0, 0, 0, 0, 0, 0, 0, 0, 0, 0, 0, 0, 0, 0, 0, 0, 0, 1, 0, 0, 0, 0},
{0, 0, 0, 0, 0, 0, 0, 0, 0, 0, 0, 0, 0, 0, 0, 0, 0, 0, 1, 0, 0, 0, 0, 0},
{0, 0, 0, 0, 0, 0, 0, 0, 0, 0, 0, 0, 0, 0, 0, 0, 0, 1, 0, 0, 0, 0, 0, 0},
{0, 0, 0, 0, 0, 0, 0, 0, 0, 0, 0, 0, 0, 0, 0, 0, 1, 0, 0, 0, 0, 0, 0, 0},
{0, 0, 0, 0, 0, 0, 0, 0, 0, 0, 0, 0, 0, 0, 0, 1, 0, 0, 0, 0, 0, 0, 0, 0},
{0, 0, 0, 0, 0, 0, 0, 0, 0, 0, 0, 0, 0, 1, 0, 0, 0, 0, 0, 0, 0, 0, 0, 0},
{0, 0, 0, 0, 0, 0, 0, 0, 0, 0, 0, 0, 1, 0, 0, 0, 0, 0, 0, 0, 0, 0, 0, 0},
{0, 0, 0, 0, 0, 0, 0, 0, 0, 0, 0, 1, 0, 0, 0, 0, 0, 0, 0, 0, 0, 0, 0, 0},
{0, 0, 0, 0, 0, 0, 0, 1, 0, 0, 0, 0, 0, 0, 0, 0, 0, 0, 0, 0, 0, 0, 0, 0},
{0, 0, 0, 0, 0, 0, 1, 0, 0, 0, 0, 0, 0, 0, 0, 0, 0, 0, 0, 0, 0, 0, 0, 0},
{0, 0, 0, 0, 0, 1, 0, 0, 0, 0, 0, 0, 0, 0, 0, 0, 0, 0, 0, 0, 0, 0, 0, 0},
{1, 0, 0, 0, 0, 0, 0, 0, 0, 0, 0, 0, 0, 0, 0, 0, 0, 0, 0, 0, 0, 0, 0, 0},
{0, 0, 0, 0, 0, 0, 0, 0, 0, 0, 0, 0, 0, 0, 0, 0, 0, 0, 0, 0, 0, 0, 0, 0},
{0, 0, 0, 0, 0, 0, 0, 0, 0, 0, 0, 0, 0, 0, 0, 0, 0, 0, 0, 0, 0, 0, 0, 0},
{0, 0, 0, 0, 0, 0, 0, 0, 0, 0, 0, 0, 0, 0, 0, 0, 0, 0, 0, 0, 0, 0, 0, 0}}}
In[16]:=
stelle Gemeinschaft graphisch dar
CommunityGraphPlot[atcGraph]
Out[16]=
J01AA02
J01DC02
J01FA10
J01CA04
J01CE02
J01CR02
J01CR04
J01DB05
J01MA02
J01XX01
J01DC04
J01DD08
J01DD13
J01EA01
J01EE01
J01FA01
J01FA06
J01FA09
J01FF01
J01MA01
J01MA06
J01MA12
J01XE01
J01XX07
2
atc_7_2018.nb
Figure 10: Prescription switch between drug groups within
an antibiotic therapy 2018 with clusters.
In[ ]:=
Eigensystem
Eigensystem[ad2]
Out[]=
2., -1.41421, 1.41421, -1., -1., 9.7795 × 10
-17
, 0., 0., 0., 0., 0., 0., 0., 0.,
{-0.389867, -0.389867, -0.389867, -0.0974668, - 0.194934, - 0.194934, -0.2924,
-0.194934, -0.2193, -0.243667, -0.0974668, - 0.341134, - 0.2193, -0.231484},
{0., 0., 0., 0.3668, -0.518733, 0., 0.3668, 0., 0.290833, 0.107433, 0.3668,
-0.259367, 0.290833, -0.281617}, {0., 0., 0., 0.196808, 0.278329, 0.,
0.196808, 0., 0.434377, 0.335973, 0.196808, 0.139165, 0.434377, 0.54472},
0.267261, 0.267261, - 0.534522, 0.267261, -0.267261, -0.267261, 2.33274 × 10
-16
,
-0.267261, 3.63406 × 10
-16
, 0.267261, 0.267261, - 0.267261, 3.63406 × 10
-16
, -0.267261,
0.261341, -0.34631, 0.0849695, -0.34631, 0.34631, - 0.261341, 4.77034 × 10
-17
,
-0.261341, 0., -0.34631, -0.34631, -0.261341, 0., 0.34631,
0., 0., 0., 9.35299 × 10
-49
, -1.19937 × 10
-64
, 0., - 9.35299 × 10
-49
, 0., - 9.7795 × 10
-17
,
-9.56387 × 10
-33
, -1.22642 × 10
-48
, -9.56387 × 10
-33
, -9.7795 × 10
-17
, -1.,
{0., 0., 0., 0., 0., 1., 0., 0., 0., 0., 0., 0., 0., 0.},
{0., 0., 0., 0., 0., 0., 0., 1., 0., 0., 0., 0., 0., 0.},
{0., 0., 0., 0., 0., 0., 0., 0., 0., 0., 1., 0., 0., 0.},
{0., 0., 0., 0., 0., 0., 0., 0., 0., 0., 0., 1., 0., 0.},
{0., 0., 0., 0., 0., 0., 0., 0., 0., 0., 0., 0., 1., 0.},
{0., 0., 0., 0., 0., 0., 0., 0., 0., 0., 0., 0., 0., 1.},
{0., 0., 0., 0., 0., 0., 0., 0., 0., 0., 0., 0., 0., 0.},
{0., 0., 0., 0., 0., 0., 0., 0., 0., 0., 0., 0., 0., 0.}
In[18]:=
stelle Gemeinschaft graphisch dar
CommunityGraphPlot[atcGraph]
Out[18]=
J01CA04
J01CR02
J01FF01
J01CA08
J01XX01
J01CE02
J01DC02
J01DC04
J01DD13
J01EE01
J01EA01
J01FA10
J01MA02
J01XE01
2
atc_7_2021.nb
Figure 11: Prescription switch between drug groups within
an antibiotic therapy 2021 with clusters.
Table 7: ATC 7 drug groups in transition graphs.
ATC 7 drug group
J01CA04 amoxicillin
J01CA08 pivmecillinam
J01CE02 phenoxymethylpenicillin
J01CR02 amoxicillin and beta-lactase inhibitors
J01DC02 cefuroxime
J01DC04 cefaclor
J01DD13 cefpodoxime
J01EA01 trimethoprim
J01EE01 sulfamethoxazole and trimethoprim
J01FA10 azithromycin
J01FF01 clindamycin
J01MA02 ciprofloxacin
J01XE01 nitrofurantoin
J01XX01 fosfomycin
In contrast to the ATC 4 and ATC 5 drug groups,
the graph for the active ingredients according to ATC
7 is divided into two community clusters in 2018 and
three in 2021. The active ingredients J01FF01 (clin-
damycin), J01CR02 (amoxicillin and beta-lactase in-
hibitors) and J01CA04 (amoxicillin) appear in pair-
wise and in both directions as the main versions of a
therapy change.
HEALTHINF 2024 - 17th International Conference on Health Informatics
416

4 DISCUSSION
The number of prescriptions for antibiotics in our data
has risen back to the level of 2017 in 2022 after a
sharp drop, particularly in 2020 being the first year
of the pandemic. The WHO declared the outbreak of
the novel coronavirus to be a public health emergency
of international concern on January 30th 2020. The
German parliament passed a first legal act on medical
drugs on March 25th 2020 easing the formerly very
restrictive regulations upon drug disposal, enabling
the dispensing pharmacists to change the medically
prescribed disposal variant and to exchange substitu-
tional substances on their own judgement. Delivery
bottlenecks for industrial produced antipyretic cough
syrups for children were avoided by allowing phar-
macists to supply individual preparations instead and
by suspension of reimbursement limits for children
preparations of drugs.
Since Germany rather met to a small part issues
for antibiotic drugs during the pandemic, the prescrip-
tion decrease observed may rather reflect a changed
health situation. Staying at home during the lock-
down in 2020 reduced the number of GP consultations
in Germany (Kolbe, 2021) and telemedicine appoint-
ments took a full flight, replacing face-to-face con-
tacts (Mangiapane et al., 2022), (Patel et al., 2021)
and (Tarazi et al., 2021). Prior to the pandemic, res-
piratory tract infections and the need for a sick leave
certificate were among the main reasons to consult a
GP. The lockdown as well as the mitigation strategies
such as mask wearing decreased the risk for coron-
avirus infection, but lowered the rate of influenza and
all other respiratory tract infections as well (Lepak
et al., 2021), (Olsen et al., 2020), (Nawrocki et al.,
2021). To prevent the spread of coronavirus during
the pandemic, legal restrictions have been relaxed to
allow doctors to issue sick notes upon request by tele-
phone. Employees presenting with respiratory tract
infections, with fever or feeling unwell were encour-
aged to stay in remote work depending on their own
judgement. In Belgium, respiratory tract infections
were found to be the main diagnosis for overprescrib-
ing of antibiotics by GPs (Colliers et al., 2019), (Smits
et al., 2019). As shown in Table 8, most of the drugs
prescribed in our study can contribute to antibiotic
drug resistance (Ventola, 2015). Antibiotic drug re-
sistance was described for the first time for penicilline
in 1940.
Affecting more and more substances, antibiotic
resistance represents a serious health threat world-
wide now (European Centre for Disease Prevention
and Control, 2020). The phenomenon of poly drug
resistance emerging in 2009 worsens this critical pub-
Table 8: Cross linking our data with the list by Ventola 2015
for reports upon antibiotic resistance in the U. S..
ATC Codes Our data ATC/ introduc-
tion/ drug
Resistance re-
ports
J01C Penicilline and beta-
lactam AB
J01CA04 amoxicilline J01C penicilline 1940 Staphylo-
coccus
J01CA08 piymecillinam 1965 Pneumo-
coccus
J01CR02 amoxicilline and
beta-lactamase inh.
J01CE02 phenoxymethylpenicillin
J01D Other beta-lactam
AB
J01DC02 cefuroxime (3rd gen) J01DD02 1985
ceftazidin 3rd gen
1987 Enter-
obacter
J01DC04 cefaclor (2nd gen) J01DD04 1982
ceftriaxon 3rd gen
2009 Neisseria
gon.
J01DD13 cefpodoxim (2nd gen) J01DI02 2010 cef-
taroline 5th gen
2011 Staphylo-
coccus
J01F Macrolide, lin-
cosamide, strep-
togramine
J01FA10 azithromycine J01CF03 1960 me-
thicilline
1962 Staphylo-
coccus
J01FF01 clindamycine J01FA01 1953 ery-
thromycin
1968 Strepto-
coccus
J01E Sulfonamide and
trimethoprime
J01EA01 trimethriprime J01XA01 1972
Vancomycin
1988 Entero-
coccus
J01EE01 sulfamethoxazole
trimethroprime
2002 Staphylo-
coccus
J01EE01 sulfamethoxazole
trimethroprime
2004 Acineto-
bacter
J01EE01 sulfamethoxazole
trimethroprime
2005
Pseudono-
mas
J01X Other AB
J01CE01 nitrofurantoine J01XX08 2000
linezolide
2001 Staphylo-
coccus
J01XX01 fosfomycine
J01M Quinolone AB
J01MA02 ciprofloxacine J01MA12 1996
Levofloxacin
1996 pneumo-
coccus
J01AA tetracycline
J01AA02 doxycycline J01AA 1950 tetra-
cycline
1959 Shigella
J01G Aminogycoside AB
J01GB03 J01GB03 1967
gentamicine
1979 Entereo-
coccus
lic health situation (Ventola, 2015). As there is only
limited financial interest in the market (Astrup et al.,
2017), we lack the development of new antibiotic
drugs and keep prescribing substances that entered
the market several decades ago. Previous exposure
to antibiotics is a key driver for antibiotics resistance
(Chatterjee et al., 2018). Inappropriate prescribing of
antibiotic drugs fuels antibiotic resistance, so it is cru-
cial to limit the treatment with watch (and reserve)
antibiotics to intensive care patients as a last resort.
Thanks to antibiotic stewardship programs, Germany
got off to a flying start ranking fifth among 30 Euro-
pean countries with one of the lowest amounts of out-
patient prescription of antibiotics at the begin of the
pandemic, (European Centre for Disease Prevention
and Control, 2020).
Nevertheless, the prescription pattern for all an-
tibiotics dropped again considerably with the onset
of the pandemic. Other countries, show an increased
prescription for the macrolide antibiotic azithromycin
Antibiotic Prescriptions Before, During and after the Corona Pandemic in Schleswig-Holstein with Prescription Data from 2017 till 2023
417

(J01FA10) at the beginning of the pandemic (Col-
liers et al., 2021). It remains unclear if it was ap-
plied to treat suspected opportunistic co-infections or
”just in case”. In the US, the empiric treatment with
antimicrobial drugs was explicitly repurposed, result-
ing in an increase in the general prescription of tetra-
cycline (J01AA) and an increased prescription pat-
tern in long-term care settings regarding azithromycin
(J01FA10), (Kolbe, 2021). Large-scale empirical pre-
scriptions carry the risk of new resistance develop-
ments, as previously described for both of these an-
tibiotics, refer to Table 8. Our data show a de-
crease of prescription for all antibiotic drugs in Ger-
many. In Belgium, after the short initial increase of
azithromycin had passed, the prescription of antibi-
otics decreased considerably, too. Instead, there was
no decrease for one of the first-choice antibiotic drugs
for urinary tract infections, nitrofurantoin (Colliers
et al., 2021). In our data, the prescription of nitro-
furantoin (J01CE01) showed no different prescription
pattern, decreasing in the same way as all other an-
tibiotic drugs did.
5 CONCLUSION
After a sharp drop in 2020, the first year of the pan-
demic, the number of prescriptions for antibiotics in
2022 equals the prescription level in 2017. This over-
all decline in prescription rates for all and especially
critical antibiotics observed in our data and in other
regional studies as well suggests an effective imple-
mentation of the antibiotic stewardship program in
Germany (Scholle et al., 2022).
Indeed, our data indicates an increase in the mean
age of all patients receiving pharmacotherapy, includ-
ing those receiving antibiotic therapy. This suggests
potential health issues for middle-aged and older pa-
tients that go beyond demographic changes. The con-
sequences of the COVID-19 pandemic continue to
pose a challenge to the healthcare system and will re-
main a focus of research.
REFERENCES
Alon, N. (1998). Spectral techniques in graph algorithms.
In Latin American Symposium on Theoretical Infor-
matics, pages 206–215. Springer.
Astrup, E., Blix, H., Eriksen-Volle, H.-M., Litleskare, I.,
and Elstrøm, P. (2017). Antibiotic resistance in nor-
way. Norwegian Institute of Public Health.
Augustin, J., Mangiapane, S., and Kern, W. V. (2015). A re-
gional analysis of outpatient antibiotic prescribing in
Germany in 2010. European Journal of Public Health,
25(3):397–399.
Behrens, G., Cossmann, and A. Stankov, M. V. e. (2020).
Perceived versus proven SARS-CoV-2-specific im-
mune responses in health-care professionals. Infec-
tion, pages 631–634.
Bornemann, R. and Tillmann, R. (2022). Development of
antibiotic prescriptions in outpatient pediatric care in
bielefeld 2015–2018: Use of statutory healthcare rou-
tine data as basis for antibiotic stewardship in outpa-
tient care. Monatsschrift Kinderheilkunde, pages 1–
10.
Brooks, R. (1991). The spectral geometry of k-regular
graphs. J. Anal. Math, 57:120–151.
Buser, P. (1978). Cubic graphs and the first eigenvalue of a
riemann surface. Mathematische Zeitschrift, 162:87–
99.
Chakrabarti, D. and Faloutsos, C. (2006). Graph mining:
Laws, generators, and algorithms. ACM computing
surveys (CSUR), 38(1):2–es.
Chatterjee, A., Modarai, M., Naylor, N. R., Boyd, S. E.,
Atun, R., Barlow, J., Holmes, A. H., Johnson, A., and
Robotham, J. V. (2018). Quantifying drivers of antibi-
otic resistance in humans: a systematic review. The
Lancet Infectious Diseases, 18(12):e368–e378.
Chinazzi, M., Davis, J., and Ajelli, M. e. a. (2020). The
effect of travel restrictions on the spread of the 2019
novel coronavirus (COVID-19) outbreak. Science,
368 (6489):395–400.
Chung, F. R. (1997). Spectral graph theory, regional con-
ference series in math. CBMS, Amer. Math. Soc.
Colliers, A., Adriaenssens, N., Anthierens, S.,
Bartholomeeusen, S., Philips, H., Remmen, R.,
and Coenen, S. (2019). Antibiotic prescribing quality
in out-of-hours primary care and critical appraisal
of disease-specific quality indicators. Antibiotics,
8(2):79.
Colliers, A., De Man, J., Adriaenssens, N., Verhoeven, V.,
Anthierens, S., De Loof, H., Philips, H., Coenen, S.,
and Morreel, S. (2021). Antibiotic prescribing trends
in belgian out-of-hours primary care during the covid-
19 pandemic: observational study using routinely col-
lected health data. Antibiotics, 10(12):1488.
European Centre for Disease Prevention and Control
(2020). Antimicrobial consumption in the eu/eea.
Filippini, M., Masiero, G., and Moschetti, K. (2006).
Socioeconomic determinants of regional differences
in outpatient antibiotic consumption: evidence from
switzerland. Health policy, 78(1):77–92.
Fricke, U., G
¨
unther, J., Zawinell, A., and Zeidan, R.
(2009). Anatomisch-therapeutisch-chemische klassi-
fikation mit tagesdosen f
¨
ur den deutschen arzneimit-
telmarkt. Methodik der ATC-Klassifikation und DDD-
Festlegung. Internet: http://wido. de/arz
atcddd-
klassifi. html.
Gillies, M. B., Burgner, D. P., Ivancic, L., Nassar, N.,
Miller, J. E., Sullivan, S. G., Todd, I. M., Pearson, S.-
A., Schaffer, A. L., and Zoega, H. (2022). Changes
in antibiotic prescribing following covid-19 restric-
tions: Lessons for post-pandemic antibiotic stew-
HEALTHINF 2024 - 17th International Conference on Health Informatics
418

ardship. British journal of clinical pharmacology,
88(3):1143–1151.
Holstiege, J., Akmatov, M., Steffen, A., and B
¨
atzing, J.
(2019). Outpatient use of systemic antibiotics in ger-
many from 2010 to 2018—a population-based study.
Central Research Institute for Ambulatory Health
Care in Germany (Zi): Berlin, Germany.
Holstiege, J., B
¨
atzing, J., Akmatov, M., Tillmann, R., Huf-
nagel, M., H
¨
ubner, J., Berner, R., and Simon, A.
(2022). Reduction of outpatient antibiotic prescrip-
tions for children and adolescents in germany 2010–
2019. regional development in the german statu-
tory health insurance regions. Monatsschrift Kinder-
heilkunde, pages 1–8.
Kern, W., De With, K., Nink, K., Steib-Bauert, M., and
Schr
¨
oder, H. (2006). Regional variation in outpatient
antibiotic prescribing in germany. Infection, 34:269–
273.
Kolbe, A. (2021). Trends in antimicrobial drug prescribing
during the covid-19 pandemic. Office of the Assistant
Secretary for Planning and Evaluation.
Koller, D., Hoffmann, F., Maier, W., Tholen, K., Windt, R.,
and Glaeske, G. (2013). Variation in antibiotic pre-
scriptions: is area deprivation an explanation? anal-
ysis of 1.2 million children in germany. Infection,
41:121–127.
Langford, B. J., So, M., Raybardhan, S., Leung, V., Soucy,
J.-P. R., Westwood, D., Daneman, N., and MacFad-
den, D. R. (2021). Antibiotic prescribing in patients
with covid-19: rapid review and meta-analysis. Clini-
cal microbiology and infection, 27(4):520–531.
Lepak, A. J., Taylor, L. N., Stone, C. A., Schulz, L. T., An-
derson, M. C., Fox, B. C., and Temte, J. L. (2021).
Association of changes in seasonal respiratory virus
activity and ambulatory antibiotic prescriptions with
the covid-19 pandemic. JAMA Internal Medicine,
181(10):1399–1402.
Mangiapane, S., Kretschmann, J., Czihal, T., and von Still-
fried, D. (2022). Veraenderung der vertragsaerztlichen
leistungsinanspruchnahme waehrend der covid-krise.
tabellarischer trendreport bis zum 1. halbjahr 2022.
Zentralinstitut f
¨
ur die kassen
¨
arztliche Versorgung in
Deutschland.
Nawrocki, J., Olin, K., Holdrege, M. C., Hartsell, J., Mey-
ers, L., Cox, C., Powell, M., Cook, C. V., Jones,
J., Robbins, T., et al. (2021). The effects of so-
cial distancing policies on non-sars-cov-2 respiratory
pathogens. In Open Forum Infectious Diseases, vol-
ume 8, page ofab133. Oxford University Press US.
Olsen, S. J., Azziz-Baumgartner, E., Budd, A. P., Bram-
mer, L., Sullivan, S., Pineda, R. F., Cohen, C., and
Fry, A. M. (2020). Decreased influenza activity dur-
ing the covid-19 pandemic—united states, australia,
chile, and south africa, 2020. American Journal of
Transplantation, 20(12):3681–3685.
Pan, A., Liu, L., and Wang, C. e. a. (2020). Association
of publichealth interventions with the epidemiology
of the COVID-19 outbreak in Wuhan, China. JAMA,
323:1–9.
Patel, S. Y., Mehrotra, A., Huskamp, H. A., Uscher-Pines,
L., Ganguli, I., and Barnett, M. L. (2021). Variation in
telemedicine use and outpatient care during the covid-
19 pandemic in the united states: study examines vari-
ation in total us outpatient visits and telemedicine use
across patient demographics, specialties, and condi-
tions during the covid-19 pandemic. Health Affairs,
40(2):349–358.
Rosenbaum, L. (2020). Facing Covid-19 in Italy - ethics,
logistics, and therapeutics on the epidemic’s frontline.
N Engl J Med., 382:1873–1875.
Scholle, O., Asendorf, M., Buck, C., Grill, S., Jones, C.,
Kollhorst, B., Riedel, O., Sch
¨
uz, B., and Haug, U.
(2022). Regional variations in outpatient antibiotic
prescribing in germany: a small area analysis based
on claims data. Antibiotics, 11(7):836.
Smits, M., Colliers, A., Jansen, T., Remmen, R.,
Bartholomeeusen, S., and Verheij, R. (2019). Examin-
ing differences in out-of-hours primary care use in bel-
gium and the netherlands: a cross-sectional study. Eu-
ropean Journal of Public Health, 29(6):1018–1024.
Tang, B., Wang, X., and Li, Q. e. a. (2020). Estimation of
the transmission risk of the 2019-ncov and its implica-
tion for public health interventions. Journal of clinical
medicine, 9 (2):462.
Tarazi, W., Ruhter, J., Bosworth, A., Sheingold, S., and
De Lew, N. (2021). The impact of the covid-
19 pandemic on medicare beneficiary utilization and
provider payments: Fee-for-service (ffs) data for
2020.
Ventola, C. L. (2015). The antibiotic resistance crisis: part
1: causes and threats. Pharmacy and therapeutics,
40(4):277.
World Health Organization (2022a). Aware classifica-
tion. https://www.who.int/publications/i/item/2021-
aware-classification.
World Health Organization (2022b). The who aware (ac-
cess, watch, reserve) antibiotic book - infograph-
ics. https://www.who.int/publications/i/item/WHO-
MHP-HPS-EML-2022.02.
Antibiotic Prescriptions Before, During and after the Corona Pandemic in Schleswig-Holstein with Prescription Data from 2017 till 2023
419
