
A Comparative Analysis of the Three-Alternative Forced Choice Method
and the Slider-Based Method in Subjective Experiments: A Case Study
on Contrast Preference Task
Olga Cherepkova, Seyed Ali Amirshahi and Marius Pedersen
Norwegian University of Science and Industry, Norway
Keywords:
3AFC, Three-Alternative Forced-Choice, Slider, Contrast, Preferences, Response Format.
Abstract:
When it comes to collecting subjective data in the field of image quality assessment, different approaches
have been proposed. Most datasets in the field ask observers to evaluate the quality of different test and
reference images. However, a number of datasets ask observers to make changes to one or more properties of
the image to enhance the image to its best possible quality. Among the methods used in the second approach
is the Three-Alternative Forced Choice (3AFC) and the slider-based methods. In this paper, we study and
compare the two mentioned methods in the case of collecting contrast preferences for natural images. Fifteen
observers participated in two experiments under controlled settings, incorporating 499 unique and 100 repeated
images. The reliability of the answers and the differences between the two methods were analyzed. The
results revealed a general lack of correlation in contrast preferences between the two methods. The slider-
based method generally yielded lower values in contrast preferences compared to 3AFC experiment. In the
case of repeated images, the slider-based method showed greater consistency in subjective scores given by
each observer. These results suggest that neither method can serve as a direct substitute for the other, as
they exhibited low correlation and statistically significant differences in results. The slider-based experiment
offered the advantage of significantly shorter completion times, contributing to higher observer satisfaction. In
contrast, the 3AFC task provided a more robust interface for collecting preferences. By comparing the results
obtained by the two methods, this study provides information on their respective strengths, limitations, and
suitability for use in similar preference acquisition tasks.
1 INTRODUCTION
Subjective experiments serve as the primary method
for collecting and evaluating human preferences. Re-
searchers use various methods to capture and quan-
tify subjective opinions related to different stimuli and
tasks, which are carefully selected according to their
needs and objectives. In this study, the focus is on
two commonly used methods: the Three-Alternative
Forced Choice (3AFC) method (Wetherill and Levitt,
1965) and the slider-based method (Hayes, 1921).
Like any other subjective experiment, the aforemen-
tioned methods have their advantages and limitations,
and in this work, their effectiveness in the context of a
subjective experiment for contrast preference is com-
pared.
The 3AFC method presents participants with three
choices simultaneously and requires them to select
one that best matches the specified criteria. This
method provides a discrete choice format, forcing par-
ticipants to make direct comparisons among the avail-
able options. Despite the higher complexity, due to
its effectiveness, stability, and precision, 3AFC is a
replacement for the commonly used Two-Alternative
Forced Choice (2AFC) method (Mantiuk et al., 2012,
Shelton and Scarrow, 1984). The 3AFC method com-
bined with the adaptive staircase method (Lu and
Dosher, 2013) can provide precise results in estimat-
ing observers’ preferences or stimuli threshold tasks
(Schlauch and Rose, 1990). By incorporating multi-
ple repetitions of the same task and gradual conver-
gence, this combination of methods ensures that ob-
servers do not take shortcuts to complete the given
task. However, one of the biggest limitations of this
method is the time it requires, which can lead to par-
ticipant fatigue and a limitation on the number of
tasks that can be performed without losing focus.
The slider-based method uses a continuous rating
approach, which is its most important distinction. In
this case, participants are presented with a single stim-
Cherepkova, O., Amirshahi, S. and Pedersen, M.
A Comparative Analysis of the Three-Alternative Forced Choice Method and the Slider-Based Method in Subjective Experiments: A Case Study on Contrast Preference Task.
DOI: 10.5220/0012360500003660
Paper published under CC license (CC BY-NC-ND 4.0)
In Proceedings of the 19th International Joint Conference on Computer Vision, Imaging and Computer Graphics Theory and Applications (VISIGRAPP 2024) - Volume 3: VISAPP, pages
425-435
ISBN: 978-989-758-679-8; ISSN: 2184-4321
Proceedings Copyright © 2024 by SCITEPRESS – Science and Technology Publications, Lda.
425

uli and use a slider to adjust their response on a con-
tinuous scale that represents the evaluated attribute
or dimension. In theory, this method allows partici-
pants to provide a more precise assessment (Chyung
et al., 2018), as they can freely adjust the position of
the slider to indicate their level of agreement, pref-
erence, or intensity. One of the major advantages of
this method is time efficiency which allows observers
to perform a higher number of tasks per hour com-
pared to 3AFC. However, one of the challenges of this
method is ensuring the precision of the responses pro-
vided, as participants may find it simpler to alter their
responses in this type of task.
Taking into account the advantages and disadvan-
tages of the two mentioned methods, the objective of
this study is to compare how similar the results of the
two methods are in the context of contrast preference.
In this study, contrast was selected based on previous
studies (Cherepkova et al., 2022b, Cherepkova et al.,
2022a) showing that it is one of the image attributes
that influences the significant variability in the pref-
erences of the observer when evaluating the quality
of an image. In other words, this study tries to an-
swer this question: do the 3AFC and the slider-based
methods produce similar results in terms of precision
and reliability? The objective is to examine the dif-
ferences between these methods in capturing partic-
ipant preferences for contrast levels for a dataset of
natural landscape images. This is done by compar-
ing the preferences of 15 observers, who evaluated
499 images with both methods and 100 repeated im-
ages, which were used for a reliability check. The
aim is to provide insight that will help researchers in
selecting the most appropriate method for conducting
preference-related or other similar subjective experi-
ments.
This paper is organized as follows. Section 2 pro-
vides a short discussion on similar studies that take
advantage of either of the two methods. Details of
the two subjective experiments carried out are pro-
vided in Section 3. This will include the experimen-
tal design and procedure, participant recruitment, and
implementation of both the 3AFC and slider-based
methods. Section 4 presents the results obtained from
the two methods and compares them in terms of time,
reliability, precision, and efficiency. Finally, Sec-
tion 5 summarizes the main findings and give a short
overview of the advantages and limitations of both
methods.
2 BACKGROUND
Both 3AFC and slider-based methods are widely used
in different research domains in signal detection, dis-
crimination, decision-making, and preferences (Ros-
ter et al., 2015,Wickens, 2001), including the contrast
preference task (Azimian et al., 2021). In (Wier et al.,
1976) authors compare the method of adjustment that
involves participants adjusting a stimulus parameter
until it matches a reference stimulus, with the forced-
choice method, which requires participants to choose
the stimulus that differs most from the reference stim-
ulus, in frequency discrimination tasks. To explore
the effects on discrimination thresholds and response
biases, they manipulated various factors, such as the
number of response alternatives, stimulus duration,
and stimulus intensity. The authors found that com-
pared to the method of adjustment, the forced-choice
method yielded more reliable discrimination thresh-
olds across different conditions. They attribute this
finding to the ability of the forced-choice methods in
reducing response biases and offer a more objective
measure of discrimination ability.
Various studies have compared category-based
and slider-based responses, which involve the use of
radio buttons and slider bars in web surveys. Jin and
Keelan designed a new slider-based method to im-
prove subjective image quality assessment (Jin and
Keelan, 2010). They validated the effectiveness of
their proposed method by comparing their slider-
based method with the absolute category rating and
pairwise comparison methods. They found that their
proposed method produces a higher correlation with
objective image quality metrics compared to other
methods while reducing the time spent per assessment
by two-fold. They concluded that the slider-based
method provides a more reliable and calibrated ap-
proach for image quality assessment.
In (Roster et al., 2015) study the slider-based re-
sponse format was compared with the category-based
response format. Their results show that the slider-
based response format provided more precise and
fine-grained measurements, particularly for subjec-
tive parameters such as satisfaction and preferences.
However, no statistically significant differences were
found with respect to data quality and completion
time between response formats. The same study
(Roster et al., 2015) also found that slider bars yielded
lower mean scores compared to radio buttons. Simi-
larly, Bosch et al. (Bosch et al., 2019) concluded that
slider bars provide responses similar in quality to ra-
dio buttons. Their research suggests that the slider-
based method can be used without losing the quality
of the collected data.
VISAPP 2024 - 19th International Conference on Computer Vision Theory and Applications
426

Figure 1: Sample images from the dataset.
The study (Toepoel and Funke, 2018) showcases
the explored impact of different response formats and
scales, specifically sliders, visual analogue scales, and
buttons, on survey responses collected via mobile and
desktop devices. In contrast to (Roster et al., 2015)
and (Bosch et al., 2019), they found that the slider per-
formed worse than other types of scales. In general,
the slider bars were harder to use and more prone to
observer bias. As in (Roster et al., 2015), they found
lower mean scores produced by the use of slider bars.
A comprehensive survey of the use of continu-
ous rating scales was introduced in (Chyung et al.,
2018). The authors addressed the advantages and dis-
advantages of continuous compared to discrete-rating
scales. They discussed the benefits of continuous
scales in terms of increased sensitivity, reduced cog-
nitive burden, improved measurement precision, and
enhanced engagement by the respondents, as well as
potential concerns, such as response style biases and
measurement validity. They concluded that based on
evidence research, no design format is significantly
better than another, and selection should depend on
researcher needs, keeping in mind the drawbacks of
using sliders, which might outweigh their advantages.
3 SUBJECTIVE EXPERIMENT
In this Section, information about the experimental
design and procedure, the dataset we used, the algo-
rithms used in each experiment, and the participants
recruited for the task is provided.
3.1 Dataset
To avoid content bias, our dataset contains 499 orig-
inal images with similar content. Images with the
search tag “mountain” were downloaded from Pix-
abay (Pixabay, 2023). Original images with HD reso-
lution of 1920x1080 pixels were cropped to 600x600
pixels around the salient regions in the image to en-
sure that three images fit in a row on a full HD mon-
itor with a resolution of 1920x1080. The selection of
images was also manually controlled to ensure their
quality and to avoid complex scenes with multiple ob-
jects of interest to focus on.
For the experiment, the dataset was divided into
five subsets, each consisting of 120 images: 100 orig-
inal images (with the exception of the subset contain-
ing 99 images) and 20 repeated images allowing for
the evaluation of intra-observer reliability. Within the
20 images, 10 were repeated locally, while the re-
maining 10 images were repeated in all five subsets
(locally and globally repeated images, respectively).
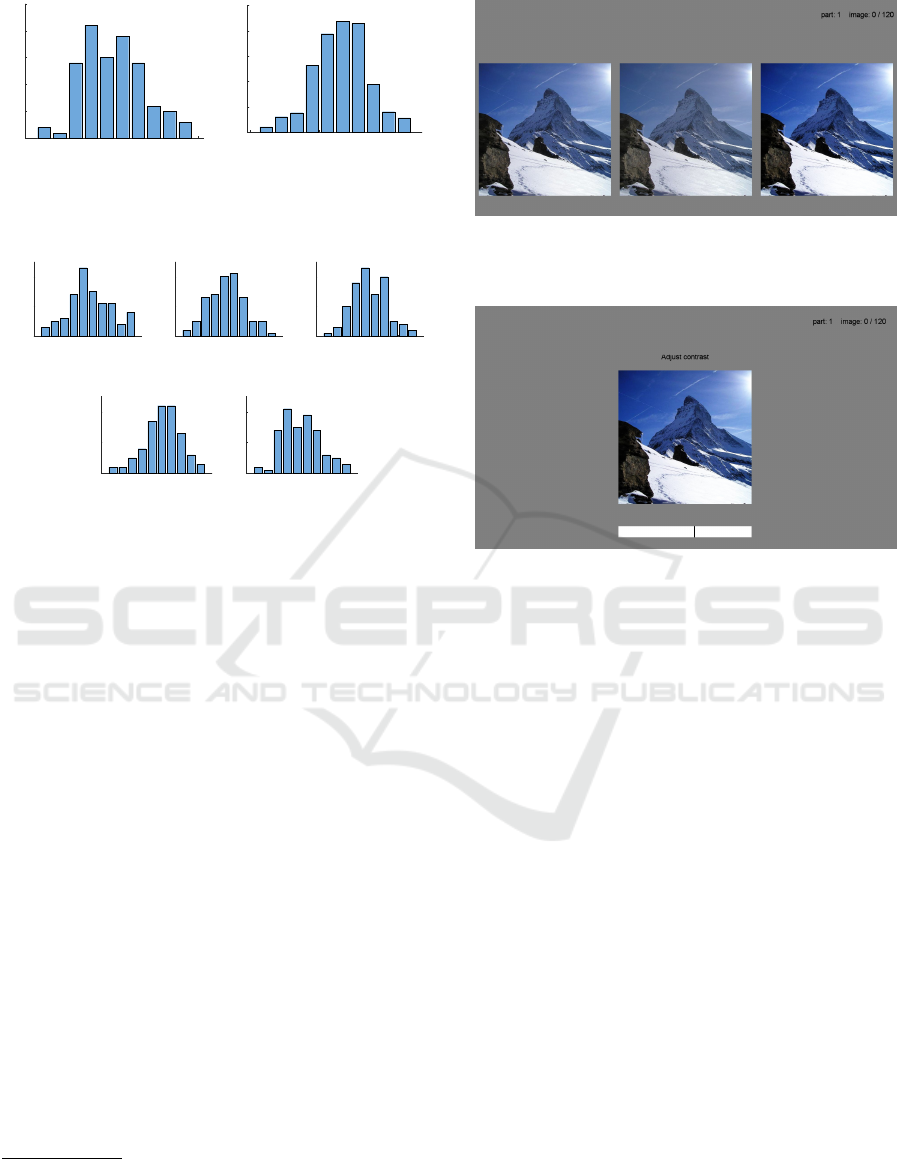
Figure 1 represents sample images showcasing the
most diverse content within the dataset.
To ensure that the dataset is balanced, the distri-
bution of original contrast and lightness was checked
for all the images in the dataset and each of the sub-
sets. To calculate the contrast, we checked how much
pixels vary from the mean luminance. In our calcula-
tions the Root Mean Square (RMS) contrast equation
1 was used. The RMS contrast equation is defined as:
RMS Contrast =
v
u
u
t
1
MN
N−1
∑
i=0
M−1
∑
j=0
(I
i j
−
¯
I)
2
(1)
where I
i j
: intensity of i
th
and j
th
pixel,
¯
I: mean in-
tensity of all pixels, M and N: total number of im-
age pixels. The pixel intensities are normalized in the
range of [0, 1]. The distributions are shown in Figure
2. Figure 3 demonstrates that five subsets contain-
ing randomly assigned images are also balanced, i.e.
the contrast of the images are approximately normally
distributed.
A Comparative Analysis of the Three-Alternative Forced Choice Method and the Slider-Based Method in Subjective Experiments: A Case
Study on Contrast Preference Task
427
0.1 0.15 0.2 0.25 0.3 0.35
Values
0
5
10
15
20
25
Frequency (%)
(a) Contrast
0 20 40 60 80
Values
0
5
10
15
20
25
Frequency (%)
(b) Lightness
Figure 2: Original RMS contrast and lightness distribution
accross the dataset.
0.1 0.2 0.3
Values
0
10
20
Frequency (%)
(a) subset 1
0.1 0.2 0.3
Values
0
10
20
Frequency (%)
(b) subset 2
0.1 0.2 0.3
Values
0
10
20
Frequency (%)
(c) subset 3
0.1 0.2 0.3
Values
0
10
20
Frequency (%)
(d) subset 4
0.1 0.2 0.3
Values
0
10
20
Frequency (%)
(e) subset 5
Figure 3: Original RMS contrast distribution in each of the
five subsets.
3.2 Experimental Design
Two experiments were conducted to collect the con-
trast preferences of observers: first using the 3AFC
method and then using the slider-based method. In
the 3AFC experiment, participants are presented with
three images simultaneously, each representing one of
the low, medium, and high levels of contrast. Ob-
servers were asked to “choose the image you prefer”.
This will force participants to make a direct choice
among the available options. The contrast values can
change in the range from -1 to 1. For changing the
contrast of the images the same algorithm used in
the Kadid-10K dataset (Lin et al., 2019)
1
was used.
The algorithm was chosen due to the results of pre-
vious studies (Cherepkova et al., 2022b, Cherepkova
et al., 2022a), where changes in contrast with this
algorithm produced one of the most variable results
among observers, suggesting individual differences in
contrast preferences. This algorithm entails modify-
ing the tonal curve of the RGB image, affecting the
luminance and color of both the bright and dark re-
gions. Elevating contrast intensifies the brightness in
bright areas and enhances the darkness in dark areas,
1
The Matlab source code for changing contrast
in the image can be downloaded from the KADID-
10k IQA dataset webpage: http://dataset.mmsp-kn.de/
kadid-10k-dataset.html using the function “imcontrastc.m”
Figure 4: 3AFC experiment design, a set of images, illus-
trating the initial difference between low, medium, and high
contrast images.
Figure 5: Slider-based experiment design.
whereas decreasing contrast minimizes the distinction
between the darkest and brightest areas of the image.
In the first experiment (3AFC), for the first triplet
of images, a medium contrast value was chosen from
a normally distributed probability of contrast values
in the range [-1;1] (Figure 6). This choice was made
to avoid the influence of the same starting point. The
use of a normal distribution helped to avoid extreme
values in the beginning of the experiment. Low and
high contrast levels were created by adding -0.25
and +0.25 contrast changes to see noticeable differ-
ences without being overly intrusive. The next triplet
was derived based on previous responses, where each
step (the difference between low, medium, and high
contrast levels) was decreased after each choice of
medium contrast and increased after two consecutive
choices of high or low contrast to give the observer
the opportunity to change their mind. When high or
low contrast was chosen, it became the new triplet
medium contrast value, while the step remained the
same. The adaptive staircase algorithm for this spe-
cific task was modified to gradually come to an op-
timal point of contrast preference for each observer.
The optimal point was considered to be found when
the difference between the four last answers was less
than one JND, indicating that the observer cannot see
a difference, which were calculated using the delta
E2000 difference (Sharma et al., 2005). Based on the
VISAPP 2024 - 19th International Conference on Computer Vision Theory and Applications
428

CIE standard (Karma, 2020) the assumption is that
the delta E2000 should be less than 1 for the stopping
rule to be satisfied. The number of trials for each im-
age was not greater than 30 and not less than 10. The
minimum number of trials ensures that the algorithm
will not mistakenly stop at a local minimum, while
an observer might continue selecting the same im-
age if their preference lies close to the starting point.
The maximum number stops the algorithm in case one
JND is unreachable for any reason. The left, central,
and right positions of the images were randomly se-
lected. An example is shown in Figure 4. The contrast
preference for each image in this task was calculated
as an average of the four last answers given (with JND
less than one), which provides a more precise result
and minimizes the noise.
In the second (slider-based method) experiment,
participants were presented with a single image and
instructed to use a slider to adjust and indicate their
subjective preference for the level of contrast. Partic-
ipants can freely move the slider along a continuous
scale from -1 to 1 to reflect their preference of con-
trast, allowing fine-grade precision. There were no
marks on the slider to avoid preference or anchoring
to any particular number. The design is shown in Fig-
ure 5. In this task, observers were asked to “adjust
the contrast with the slider using the mouse until you
are satisfied with the result”. In this case instructions
were changed from the previous experiment due to
the nature of the setup. Contrast values were obtained
from the slider location after the observer confirmed
their choice with a press of a button. The slider po-
sition was kept in the previously chosen place for the
next image. In the case of the slider-based method,
the use of a random starting point could potentially in-
troduce confusion into the results, as observers might
“cheat” by repeatedly choosing the value of the start-
ing point. This behavior would naturally not accu-
rately reflect their actual choice and would be chal-
lenging to control. Therefore, keeping the previous
position for the slider will provide an additional pa-
rameter for inclusion in the reliability assessment.
3.3 Experimental Procedure
The experiments were conducted in a controlled lab-
oratory environment. Lighting conditions were ad-
justed to a dimmed level of 20 lux, and the partici-
pants maintained a viewing distance of 50 cm. Before
the experiments, the participants underwent an Ishi-
hara color blindness test and a Snellen visual acuity
test, which they passed successfully. They were pro-
vided with detailed instructions and, as a trial, com-
pleted the process for a test image to familiarize them-
(a) Contrast = -1 (b) Contrast = 0 (c) Contrast = 1
(d) Contrast = -1 (e) Contrast = 0 (f) Contrast = 1
Figure 6: Example of two images with the minimum con-
trast value of (-1) (a) and (d), zero (b) and (e), and maximum
contrast value (one) (c) and (f).
selves with the techniques.
The experiments were divided into five parts, each
part containing 120 (in one set 119) images that al-
lowed the observers to start and finish the experiment
in a reasonable time. Nevertheless, observers could
stop after any number of images and continue the ex-
periment from where they left later on. The order of
the images was individually randomized in both ex-
periments. The data collection phase for the first ex-
periment (3AFC) lasted about three months, while for
the second experiment (slider) it took around a month.
It is important to mention that the time to complete
one subset of images (120 images) in the 3AFC ex-
periment was around 1.5 hours (excluding the time
for rest, which observers could take whenever they
wanted). For the slider-based experiment, the aver-
age time to complete one subset was around 8 min-
utes, which is a big advantage of this method. The
3AFC experiment was completed by all observers be-
fore they started the slider experiment. The time be-
tween the two experiments varied for observers, rang-
ing from a few weeks to a few days for some.
In total, 19 participants (11 men and 8 women) of
an average age of 27 completed both experiments and
evaluated 599 images, out of which 100 images were
repeated for a reliability check. 11 observers had a
background in image processing or photography. In
total, 9481 preference values were collected in each
experiment, of which 2850 values were used for a re-
liability check.
A Comparative Analysis of the Three-Alternative Forced Choice Method and the Slider-Based Method in Subjective Experiments: A Case
Study on Contrast Preference Task
429
1 2 3 4 5 6 7 8 9 10
images
1
2
3
4
6
7
8
9
10
11
13
15
16
17
19
observers
0
0.05
0.1
0.15
0.2
0.25
0.3
1
2
3
4
6
7
8
9
10
11
13
15
16
17
19
3AFC Slider
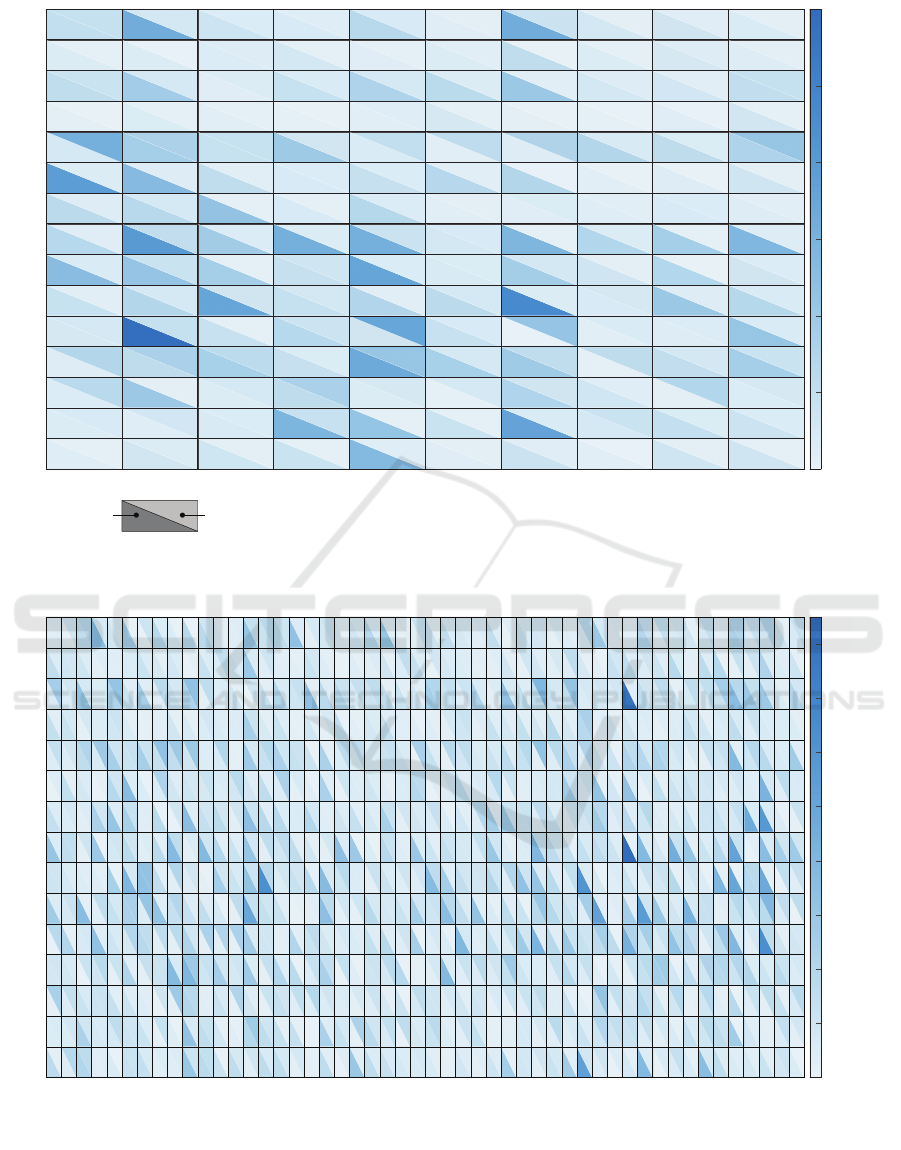
Figure 7: Comparison of preferences variances for 10 globally repeated images between the 3AFC and slider-based methods.
The bottom-left triangle corresponds to the 3AFC method, top-right corresponds to the slider-based method.
1
2
3
4
5
6
7
8
9
10
11
12
13
14
15
16
17
18
19
20
21
22
23
24
25
26
27
28
29
30
31
32
33
34
35
36
37
38
39
40
41
42
43
44
45
46
47
48
49
50
images
1
2
3
4
6
7
8
9
10
11
13
15
16
17
19
observers
0
0.2
0.4
0.6
0.8
1
1.2
1.4
1.6
1
2
3
4
5
6
7
8
9
10
11
12
13
14
15
16
17
18
19
20
21
22
23
24
25
26
27
28
29
30
31
32
33
34
35
36
37
38
39
40
41
42
43
44
45
46
47
48
49
50
1
2
3
4
6
7
8
9
10
11
13
15
16
17
19
Figure 8: Comparison of preferences absolute differences for 50 locally repeated images between the 3AFC and slider-based
methods. The bottom-left triangle corresponds to the 3AFC method, top-right corresponds to the slider-based method.
VISAPP 2024 - 19th International Conference on Computer Vision Theory and Applications
430
1 2 3 4 5 6 7 8 9 10 11 12 13 14 15
observers
-0.5
0
0.5
1
ICC values (A-k)
3AFC local
slider local
(a) ICC for locally repeated images
1 2 3 4 5 6 7 8 9 10 11 12 13 14 15
observers
-0.5
0
0.5
1
ICC values (A-k)
3AFC global
slider global
(b) ICC for globally repeated images
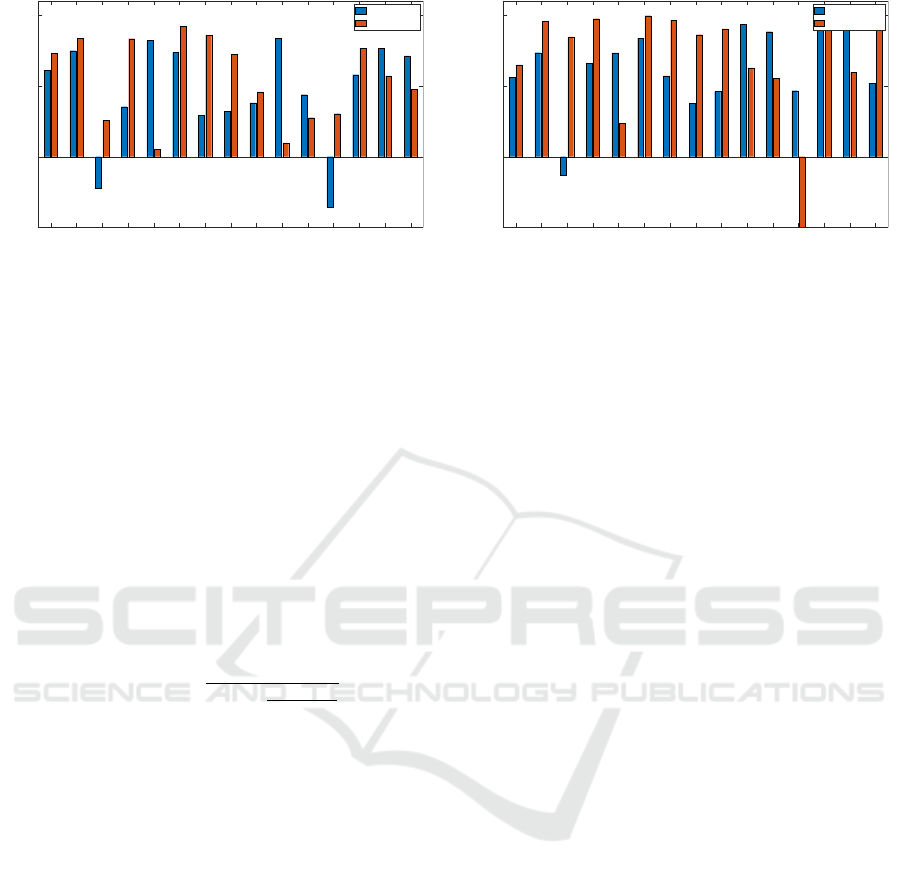
Figure 9: Bar graphs represent intra-observer reliability with ICC values. A higher ICC value indicates better reliability.
Locally repeated images.
4 RESULTS ANALYSIS AND
DISCUSSION
4.1 Removing Outliers
Before analyzing the differences between the 3AFC
and slider-based experiments, the reliability of the ob-
servers was evaluated. For this aim Cohen’s kappa
(Landis and Koch, 1977), standard deviation, mean
squared error, and Intraclass Correlation Coefficient
(ICC) (McGraw and Wong, 1996, Salarian, 2023)
ICC(A − k) =
MS
R
− MS
E
MS
R
+
MS
C
−MS
E
n
(2)
indicators were used. In Eq. (2) MS
R
corresponds
to the Mean Square for the observers (variance be-
tween observers). MS
E
represents the Mean Square
Error (variance within images, representing random
error), and MS
C
corresponds to the Mean Square for
Cases (variance between images). The number of im-
ages is represented by n , while k corresponds to the
number of trials (two for local, five for global). For
ICC, the mean-rating, absolute-agreement, and the 2-
way mixed-effects (A-k) model were used which all
have been suggested in (Koo and Li, 2016). The for-
mula calculates the ICC by comparing the variance
due to observers (MS
R
- MS
E
) with the variance due
to images (MS
C
- MS
E
), while considering the sam-
ple size (n). ICC is suitable for continuous values,
which aligns with our data, while Cohen’s kappa is
designed for categorical data. Therefore, to apply Co-
hen’s kappa to our continuous data, which ranged in
[-1; 1], were discretized into 20 categories with a step
size of 0.1. In addition, the average time it took an ob-
server to make a choice was checked. For the slider-
based experiment, in addition to the same indicators
and decision time, the number of images in which
the slider was not moved at all was checked, indicat-
ing that the image was skipped (in average, 6 images
per observer out of 599). After analyzing the results,
based on the indicators mentioned and reaction time
(which was significantly lower) in the 3AFC exper-
iment, observers 14 and 18 were excluded. Based
on the indicators in the slider-based experiment, ob-
servers 5 and 12 were also excluded from the final
analyses, resulting in a total of 15 observers for fur-
ther analysis.
To answer the question whether the 3AFC and
slider-based methods produce similar results, the reli-
ability of both methods was initially evaluated. For
this, the differences between the responses for re-
peated images in both methods for each observer were
evaluated. The absolute differences for locally (twice)
repeated images and variance for globally (five times)
repeated images were calculated. Greater differences
correspond to lower reliability of the method. For
convenience, heatmaps were used that provide a vi-
sual representation of these differences (Figures 7-
8). The results show that the differences in prefer-
ences for both globally and locally repeated images
in the 3AFC experiment are greater, suggesting that
the slider-based method yielded more reliable results.
There could be several reasons for this observation.
First, the shorter time that participants spent in the
slider-based experiment may have contributed to sim-
ilarities, as they may have remembered the values
they selected earlier. Second, the nature of the experi-
ments itself may have played a role, as randomization
of the starting contrast level in the 3AFC experiment
made it more challenging for participants to end up in
the same position as before, while the slider position
was easier to remember and replicate. Furthermore,
unlike in the 3AFC experiment, observers had access
to the entire range of possible variations in the slider-
A Comparative Analysis of the Three-Alternative Forced Choice Method and the Slider-Based Method in Subjective Experiments: A Case
Study on Contrast Preference Task
431
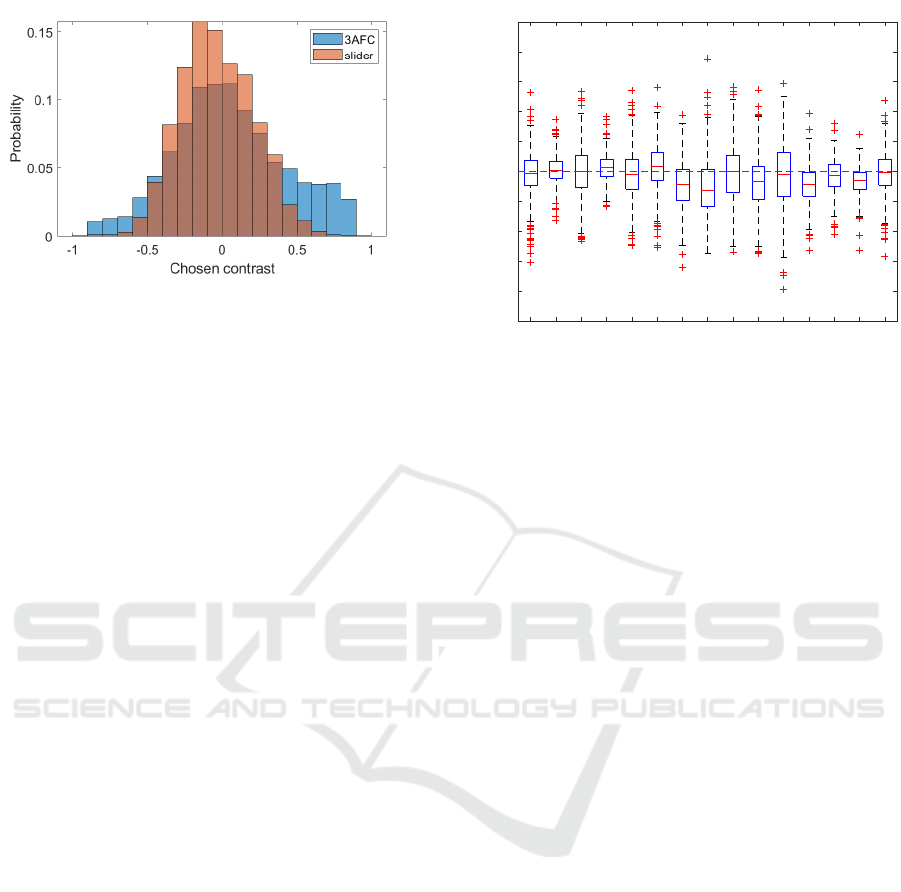
Figure 10: The overall preferences distribution in the 3AFC
and slider-based experiments.
based experiment.
The intra-observer reliability in each experiment
using ICC indicators can be compared for both lo-
cally and globally repeated images. The results in
Figure 9 from the 3AFC and the slider-based meth-
ods show that the slider method provides higher re-
liability for each observer. The results show that for
nine out of 15 observers, both ICC indicators for lo-
cally and globally repeated images show better reli-
ability in the case of the slider method used. These
results are closely related to the previous Figures 7-8
and can be explained in a similar manner. Another ob-
servation from the ICC reliability check is related to
higher ICC values for globally repeated images com-
pared to locally repeated images. This is attributed
to the higher absolute differences observed for locally
repeated images compared to the mean absolute dif-
ferences for the five globally repeated images, leading
to smaller MS
E
and therefore a larger ICC. Despite
the longer time intervals between the evaluations of
the globally repeated images, the fact that they were
assessed multiple times could result in better recall
and more consistent responses.
4.2 Comparison of the Results for both
Experiments
In addition, we studied the differences in preferences
for all images between the two methods in general
(Figure 10) and for each observer (Figure 11) inde-
pendently. The overall distributions in Figure 10 show
that the preference distribution in the slider-based ex-
periment has a higher kurtosis. Observers were more
likely to choose images with more natural contrast (µ
0.03, σ 0.35), while in 3AFC experiments observers
were more likely to choose images with higher con-
trast (µ -0.04, σ 0.25). When performing a signif-
icance test to compare the two distributions using
the Kolmogorov-Smirnov test (Massey Jr, 1951), we
1 2 3 4 6 7 8 9 10 11 13 15 16 17 19
observer
-100
-80
-60
-40
-20
0
20
40
60
80
100
difference in %
Figure 11: The differences between 3AFC and slider-based
experiments in chosen contrast values in %, where 100%
corresponds to maximal difference equal 2. The boxplots
represent the range of differences. A negative difference
means that observers chose lower contrast in the slider-
based experiment compared to the 3AFC experiment.
found that the two distributions are significantly dif-
ferent, meaning that the two experiments do not yield
the same results in responses.
The results in Figure 11 indicate that, on aver-
age, the difference for most observers hovers around
0. However, for certain observers, this difference can
range from 0 to 60%. We checked the significance of
the differences with the Wilcoxon Signed-Rank Test
(Litchfield and Wilcoxon, 1949) and found that for
most observers (12 out of 15) there is a significant dif-
ference between the distributions of the chosen values
in the two experiments. It should be emphasized that
as the number of evaluations per image increases, the
average differences between the mean values of the
chosen contrast level in the two experiments decrease.
For example, when comparing the mean contrast val-
ues for two locally repeated images, instead of con-
sidering only the first subjective score given by an ob-
server, the average difference decreased from 0.26 to
0.22. Similarly, for globally repeated images, when
comparing the mean of five responses given by ob-
servers instead of only the first, the average differ-
ences between the two experiments decreased from
0.27 to 0.2. Therefore, we can improve consistency
by increasing the number of repetitions per image and
considering the mean of observations.
To determine if the two methods yield signifi-
cantly different results, we compared the differences
in preferences obtained with them. However, re-
sponses provided for non-repeating images can be
affected by many factors and are not as consistent
as comparing the mean values of repeated images.
To find if the differences between the two methods
VISAPP 2024 - 19th International Conference on Computer Vision Theory and Applications
432

Table 1: Comparison of preferences between two experiments. Pearson correlation, the results of the sign test indicating
significant differences in medians of observers’ responses, the number of images (in %) with higher contrast chosen in slider-
based experiment compared to the 3AFC.
Observer 1 2 3 4 6 7 8 9 10 11 13 15 16 17 19
Pearson correlation 0.06 0.44 0.22 0.45 0.46 0.34 0.30 0.18 0.01 0.19 0.15 0.18 0.35 0.41 0.13
Sign test, p-value 0.11 0.04 0.59 0 0.01 0 0 0 0.93 0 0.15 0 0 0 0.37
higher contrast (%) 46.3 54.7 51.3 63.7 44.1 59.7 28.3 26.5 50.3 30.9 46.7 24.6 40.7 23.0 47.9
are significantly different, we decided to run a sta-
tistical analysis on globally repeated images. We
compared the mean values of the two groups with
a Wilcoxon Signed-Rank Test. The first group con-
sists of observers’ preferences given in the first exper-
iment, while the second group comprises preferences
from the second experiment. We chose the Wilcoxon
test over the t-test because our data is not normally
distributed. The test resulted in a p-value of 0.7695,
indicating that we cannot reject the null hypothesis
with 95% confidence, suggesting that there is no sig-
nificant difference between the results obtained from
the two methods.
To further explore the differences between the two
methods, we checked the correlation between the re-
sults for each observer (Table 1). From the correlation
values we cannot conclude that the answers are well
correlated. Several observers (2, 4, 6, and 17) show
more consistent results, while others do not have an
obvious correlation between the contrast preference
values in the two experiments. This suggests that ob-
servers do not consistently reach the same conclusion
in the two methods. One reason for this is the ran-
domized starting point in the 3AFC experiment and
the absence of it in the slider-based experiment, which
could potentially impact the results, although verify-
ing this would require a significantly larger dataset.
Another possible reason for this difference is that
since we are comparing only one value per image,
there may be other factors that influence the choice,
unlike when comparing averaged values for repeated
images.
In addition, we examined whether observers con-
sistently choose higher or lower values with a slider
method compared to the 3AFC method. We per-
formed the sign test for each observer to see if there
are consistent differences between the results for all
499 images. Results (Table 1) show that with 95%
confidence level there is a significant difference be-
tween the median of the results of the two experi-
ments for most observers, with p-values below 0.05.
A low p-value also indicates that the majority of the
preferences are higher or lower in the slider-based
experiment compared to the 3AFC. To check if the
preferences are higher or lower in the slider-based ex-
periment, we compared the mean values of the con-
trast chosen between the experiments. We found that
the average preferred contrast level of -0.0355 in the
slider-based experiment was slightly lower compared
to 0.0137 in the 3AFC experiment, which corresponds
to the findings in (Roster et al., 2015, Toepoel and
Funke, 2018). We also compared the number of im-
ages in which observers preferred lower contrast in
the slider-based experiment, and confirmed that the
majority of observers indeed preferred images with
lower contrast in this experiment (Table 1).
4.3 Discussion
We checked the reliability of two tests, comparing
variances for globally repeated images, absolute dif-
ferences for locally repeated images, and ICC val-
ues. The results suggest that the slider-based method
yielded results with a higher consistency for each in-
dividual observer compared to the 3AFC procedure
(Figures 7-8 and 9). The disparity in the results may
be influenced by factors such as starting point, varia-
tions in observers’ tolerance to different levels of con-
trast, shifts in attention to different regions of the im-
age after repeated viewings, observer fatigue, impa-
tience, and other individual factors.
While comparing the preferences obtained by the
two experiments, we found that observers’ answers
in the slider-based and the 3AFC experiments do not
correlate well (Table 1, row 1). The absolute differ-
ences between the two experiments were as high as
60% for some images (Figure 11). However, when
comparing the mean contrast values for all observers
for globally repeated images with the Wilcoxon test,
there was no significant difference between the re-
sults. We found an improvement in the consistency
of the answers as we averaged the result for multi-
ple assessments for images. We also found that most
observers consistently preferred images with a lower
contrast level in the slider-based experiment com-
pared to the 3AFC experiment (Table 1, second and
third rows).
Naturally, both methods have their own limita-
tions and advantages. The design of the 3AFC ex-
periment provided certain advantages such as reduc-
ing observer bias and preventing shortcuts. However,
a longer completion time and repetition of trials in
the 3AFC experiment may have led to observer fa-
tigue, resulting in reduced concentration and lower
A Comparative Analysis of the Three-Alternative Forced Choice Method and the Slider-Based Method in Subjective Experiments: A Case
Study on Contrast Preference Task
433

reliability. The strict stopping rule in the experiment
also led to a greater number of trials, in which ob-
servers viewed each image a high number of times,
which could have caused annoyance and decreased
participant satisfaction. In the case of the slider-based
method, a shorter completion time and viewing the
image only once increased the interest and concen-
tration of the observer, leading to greater consistency
in given answers. However, the simplicity of the
test also made it more susceptible to shortcuts, which
could introduce bias and rely more on the honesty of
the observer.
5 CONCLUSION
In this study, we conducted a comparison between
3AFC and slider-based methods to determine contrast
preference. We compared the reliability of the data
obtained from both methods for locally and globally
repeated images using statistical analysis and visual
comparisons to assess the differences between the re-
sponses. We found variations in the results while an-
alyzing individual observers. However, on average,
the differences between the experiments were con-
sistent, with slightly lower mean contrast preferences
observed in the slider-based experiment.
Results suggest that neither method could be sub-
stituted for the other, as they did not correlate well
and results were significantly different. However, in-
creasing the number of repetitions could stabilize the
results and improve precision and reliability. In cases
where time is crucial and a large number of samples
need to be processed, a slider-based test could be a
better option. To achieve the compromise between
time and reliability, the images can be repeated at
least twice to gather the mean of preferences, while
using the slider-based interface. However, when deal-
ing with a smaller number of samples where reliabil-
ity is crucial, the 3AFC test can be considered. Ulti-
mately, the choice of the most suitable method should
always be made in accordance with the specific re-
search objectives. Factors such as time constraints,
sample size, and desired reliability should be care-
fully considered. Further improvements can be made
to both methods by addressing the bias in the starting
point and ensuring an optimal duration of the experi-
ment to prevent observer fatigue.
REFERENCES
Azimian, S., Torkamani-Azar, F., and Amirshahi, S. A.
(2021). How good is too good? a subjective study
on over enhancement of images. Color and Imaging
Conference (CIC), pages 83–88.
Bosch, O. J., Revilla, M., DeCastellarnau, A., and We-
ber, W. (2019). Measurement reliability, validity, and
quality of slider versus radio button scales in an on-
line probability-based panel in norway. Social Science
Computer Review, 37(1):119–132.
Cherepkova, O., Amirshahi, S. A., and Pedersen, M.
(2022a). Analysis of individual quality scores of dif-
ferent image distortions. Color and Imaging Confer-
ence (CIC), pages 124–129.
Cherepkova, O., Amirshahi, S. A., and Pedersen, M.
(2022b). Analyzing the variability of subjective im-
age quality ratings for different distortions. In 2022
Eleventh International Conference on Image Process-
ing Theory, Tools and Applications (IPTA), pages 1–6.
Chyung, S. Y., Swanson, I., Roberts, K., and Hankinson,
A. (2018). Evidence-based survey design: The use
of continuous rating scales in surveys. Performance
Improvement, 57(5):38–48.
Hayes, M. (1921). Experimental development of the
graphic rating method. Psychological Bulletin, 18:98–
99.
Jin, E. W. and Keelan, B. W. (2010). Slider-adjusted
softcopy ruler for calibrated image quality assess-
ment. Journal of Electronic Imaging, 19(1):011009–
011009.
Karma, I. G. M. (2020). Determination and measurement
of color dissimilarity. International Journal of Engi-
neering and Emerging Technology, 5:67.
Koo, T. K. and Li, M. Y. (2016). A guideline of selecting
and reporting intraclass correlation coefficients for re-
liability research. Journal of chiropractic medicine,
15(2):155–163.
Landis, J. R. and Koch, G. G. (1977). The measurement of
observer agreement for categorical data. biometrics,
pages 159–174.
Lin, H., Hosu, V., and Saupe, D. (2019). Kadid-10k: A
large-scale artificially distorted iqa database. In 2019
Eleventh International Conference on Quality of Mul-
timedia Experience (QoMEX), pages 1–3. IEEE.
Litchfield, J. j. and Wilcoxon, F. (1949). A simplified
method of evaluating dose-effect experiments. Jour-
nal of pharmacology and experimental therapeutics,
96(2):99–113.
Lu, Z.-L. and Dosher, B. (2013). Adaptive psychophysical
procedures. In Visual psychophysics: From laboratory
to theory, chapter 11, pages 351–384. MIT Press.
Mantiuk, R. K., Tomaszewska, A., and Mantiuk, R. (2012).
Comparison of four subjective methods for image
quality assessment. In Computer graphics forum, vol-
ume 31, pages 2478–2491. Wiley Online Library.
Massey Jr, F. J. (1951). The kolmogorov-smirnov test for
goodness of fit. Journal of the American statistical
Association, 46(253):68–78.
McGraw, K. O. and Wong, S. P. (1996). Forming inferences
about some intraclass correlation coefficients. Psycho-
logical methods, 1(1):30.
Pixabay (2023). https://pixabay.com, last visited:
13.10.2023.
VISAPP 2024 - 19th International Conference on Computer Vision Theory and Applications
434

Roster, C. A., Lucianetti, L., and Albaum, G. (2015).
Exploring slider vs. categorical response formats in
web-based surveys. Journal of Research Practice,
11(1):D1–D1.
Salarian, A. (2023). Intraclass correla-
tion coefficient (icc). https://www.
mathworks.com/matlabcentral/fileexchange/
22099-intraclass-correlation-coefficient-icc.
Schlauch, R. S. and Rose, R. M. (1990). Two-, three-, and
four-interval forced-choice staircase procedures: Esti-
mator bias and efficiency. The Journal of the Acousti-
cal Society of America, 88(2):732–740.
Sharma, G., Wu, W., and Dalal, E. N. (2005). The
ciede2000 color-difference formula: Implementation
notes, supplementary test data, and mathematical ob-
servations. Color Research & Application: Endorsed
by Inter-Society Color Council, 30(1):21–30.
Shelton, B. and Scarrow, I. (1984). Two-alternative versus
three-alternative procedures for threshold estimation.
Perception & Psychophysics, 35:385–392.
Toepoel, V. and Funke, F. (2018). Sliders, visual analogue
scales, or buttons: Influence of formats and scales in
mobile and desktop surveys. Mathematical Popula-
tion Studies, 25(2):112–122.
Wetherill, G. and Levitt, H. (1965). Sequential estimation
of points on a psychometric function. British Journal
of Mathematical and Statistical Psychology, 18(1):1–
10.
Wickens, T. D. (2001). Elementary signal detection theory.
Oxford university press.
Wier, C. C., Jesteadt, W., and Green, D. M. (1976). A com-
parison of method-of-adjustment and forced-choice
procedures in frequency discrimination. Perception &
Psychophysics, 19:75–79.
A Comparative Analysis of the Three-Alternative Forced Choice Method and the Slider-Based Method in Subjective Experiments: A Case
Study on Contrast Preference Task
435
