
Supporting CAN Bus Anomaly Detection with Correlation Data
Beatrix Koltai
a
, Andr
´
as Gazdag
b
and Gergely
´
Acs
c
Laboratory of Cryptography and System Security (CrySyS Lab), Department of Networked Systems and Services,
Budapest University of Technology and Economics, Budapest, Hungary
Keywords:
CAN, Anomaly Detection, TCN, Correlation.
Abstract:
Communication on the Controller Area Network (CAN) in vehicles is notably lacking in security measures,
rendering it susceptible to remote attacks. These cyberattacks can potentially compromise safety-critical ve-
hicle subsystems, and therefore endanger passengers and others around them. Identifying these intrusions
could be done by monitoring the CAN traffic and detecting abnormalities in sensor measurements. To achieve
this, we propose integrating time-series forecasting and signal correlation analysis to improve the detection
accuracy of an onboard intrusion detection system (IDS). We predict sets of correlated signals collectively
and report anomaly if their combined prediction error surpasses a predefined threshold. We show that this
integrated approach enables the identification of a broader spectrum of attacks and significantly outperforms
existing state-of-the-art solutions.
1 INTRODUCTION
Securing vehicular communication networks is be-
coming crucial as the automotive industry rapidly
evolves and increasingly adopts connectivity. Apply-
ing Intrusion Detection Systems (IDS) in specific do-
mains is becoming essential for identifying and mit-
igating threats to vehicular networks. One such do-
main is the vehicles’ inner communication on the
Controller Area Network (CAN).
The CAN bus is a complex network of Elec-
tronic Control Units (ECUs) that collaborate to pro-
vide the necessary functions of the vehicle. Cyber
attacks targeting these ECUs can have dire conse-
quences for safety-critical subsystems such as brakes,
the engine, or the steering wheel. A malfunction-
ing vehicle not only endangers passengers and oth-
ers around it but also impacts the VANET (Vehicu-
lar Ad-hoc Network). Compromising data used in
Vehicle-to-Everything (V2X) communication, an at-
tacker could spread malicious information and alter
the behavior of others, which could cause congestion
or severe accidents in an urban environment. An at-
tacker can have financial motivation besides deterio-
rating reliability and driving safety. Gaining control
over the vehicle could allow theft, stealing sensitive
a
https://orcid.org/0009-0006-5506-7626
b
https://orcid.org/0000-0002-4481-3308
c
https://orcid.org/0000-0003-4437-0110
data, and sabotaging the system.
Since the CAN protocol does not implement any
security measures (Bozdal et al., 2020), an attacker
can potentially attack the ECUs by making commu-
nication inaccessible, injecting new malicious mes-
sages, or even modifying valid messages. DoS
(Denial-of-Service) attacks disable the benign CAN
communication by flooding the network with the
highest priority messages. However, this attack can
be easily detected because the network load is signifi-
cantly increased during the attack. Message injection
can also affect specific vehicle functions, but these at-
tacks are also easy to detect, with simple statistical
methods, as injected messages cause a recognizable
change in the regular arrival times.
The most challenging issue is message modifica-
tion attacks that do not introduce new messages to the
network, only the data contents are changed. This at-
tack is the hardest to detect due to the variability in
traffic patterns, lack of authentication or encryption,
the existence of stealthy attack techniques, and the
lack of attack signatures. In general, only the continu-
ously changing message data can be used for identify-
ing anomalies that requires general, accurate methods
to differentiate between normal and malicious behav-
ior.
After extracting signals from the messages, the
detection of malicious message modifications fol-
low two main approaches: time-series forecasting
Koltai, B., Gazdag, A. and Ács, G.
Supporting CAN Bus Anomaly Detection with Correlation Data.
DOI: 10.5220/0012360400003648
Paper published under CC license (CC BY-NC-ND 4.0)
In Proceedings of the 10th International Conference on Information Systems Security and Privacy (ICISSP 2024), pages 285-296
ISBN: 978-989-758-683-5; ISSN: 2184-4356
Proceedings Copyright © 2024 by SCITEPRESS – Science and Technology Publications, Lda.
285

(Hanselmann et al., 2020), (Kukkala et al., 2020),
(Chiscop et al., 2021) and signal correlation analy-
sis (Gazdag et al., 2021), (Moriano et al., 2022). In
time-series forecasting, a machine learning model is
trained per signal that predicts the next, expected sig-
nal value. Anomaly is reported when there is a sub-
stantial deviation between the prediction and the ac-
tual value. Unfortunately, this method is incapable
of identifying modifications that fall within the usual,
non-anomalous range of signal values, even if they
constitute an attack. For instance, this limitation is
evident when the speed value is modified, causing it
to marginally fall below the speed limit. To over-
come this shortcoming, the deviation of the correla-
tion between each pair of signals is checked, where
correlation is calculated based on the most recent few
minutes’ worth of signal data (Gazdag et al., 2021),
(Moriano et al., 2022). Indeed, increasing the speed
should naturally result in a corresponding increase in
the RPM signal; otherwise their correlation would ap-
pear anomalous, as Figure 1 shows. Consequently,
to evade detection, an attacker would need to main-
tain the original correlation intact and simultaneously
modify all correlated signals, which could be pro-
hibitively expensive in practice. Nonetheless, unlike
time-series forecasting, this purely correlation-driven
approach is unable to identify malicious alterations in
signals that lack any correlation between them.
Our proposal combines the merits of both time-
series forecasting and correlation analysis, as shown
in Figure 2. We simultaneously forecast multiple cor-
related signals and flag an anomaly if the cumulative
difference between the predicted values and the ac-
tual values of all correlated signals exceeds a speci-
fied threshold. The underlying idea is that, as a sin-
gle model forecasts multiple highly correlated sig-
nals, any alteration in one signal will inevitably influ-
ence the predictions of all other correlated signals. In
other words, we leverage signal correlation not only
for more accurate prediction, but also to induce de-
tectable deviation of the predicted signals from the
actual ones even if only one of them is maliciously
modified. For example, the larger the speed the larger
the RPM value, which means that increased speed
with constant RPM is likely to produce a noticeable
cumulative prediction loss over both signals if they
are predicted jointly by a single model. Furthermore,
unlike pure correlation-based approaches, our method
is capable of identifying malicious alterations in sig-
nals, even those that lack correlation, when their pre-
dicted values deviate significantly from their actual
values. Additionally, it can detect attacks in which the
attacker modifies correlated signals simultaneously
without altering their correlation, yet still induces ab-
Figure 1: Example benign CAN signal (S-1-4).
normal behavior.
Our contributions in this work are as follows:
• We employ a combination of time-series fore-
casting and signal correlation analysis to identify
anomalies in the vehicular CAN bus. Our unsu-
pervised method relies solely on unlabeled CAN
traces for training and calibration prior to deploy-
ment. It operates by simultaneously predicting
correlated signals that allows a more accurate de-
tection of abnormal behaviour.
• We assess the effectiveness of our approach using
a dataset comprising eight distinct message mod-
ification attack types. Our results demonstrate
a substantial performance improvement over the
state-of-the-art: we achieve a detection rate of
95% (compared to 68%) with a precision of 80%
(versus 30%). Additionally, our method exhibits a
minimal average detection delay of just 0.38 sec-
onds.
The rest of the paper is organized as follows:
Section 2 briefly covers prior research and develop-
ments in anomaly detection in Controller Area Net-
works. Section 3 summarizes the relevant background
of the CAN bus and vehicular intrusion detection so-
lutions. The attacker model is introduced in Section 4.
Section 5 describes the proposed anomaly detection
mechanism, the training process, and the detection
process. Section 6 evaluates the performance of the
method on real-world CAN data. Finally, in Section 7
we conclude our paper.
2 RELATED WORK
Intrusion detection systems used in in-vehicle net-
works differ from those used on the Internet because
there are limited known attack signatures. Most re-
search results are based on unsupervised learning, as
ICISSP 2024 - 10th International Conference on Information Systems Security and Privacy
286
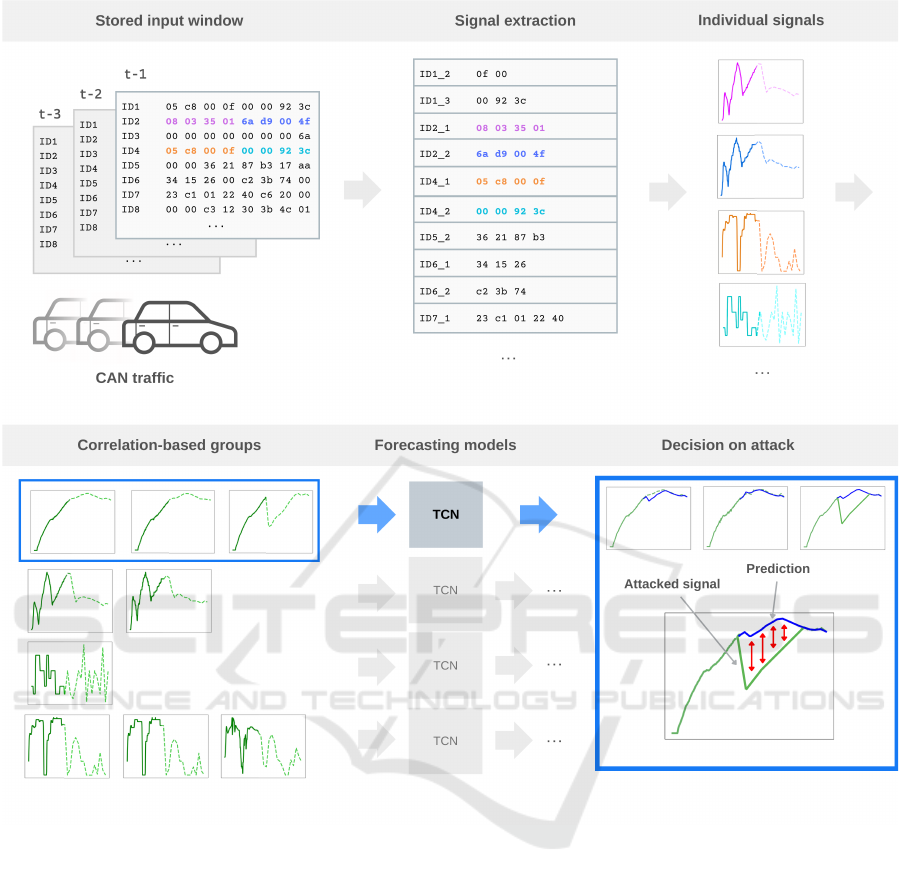
Figure 2: High-level layout of our correlation-based approach.
the available data can only be used appropriately to
describe the benign state of the systems. Following
this approach, papers have been published on detect-
ing message injection and modification attacks.
IDS systems often rely on measuring and monitor-
ing the timestamp of message arrivals to detect injec-
tion attacks. Due to the periodical timing of CAN data
messages in a benign state, timing-based detection
methods can effectively detect message insertions and
drops (Song et al., 2016; Gazdag et al., 2018). Young
et al. showed that the constant nature of the inter-
arrival times can also change for short periods of time
during transitions of vehicle state (Young et al., 2019).
They propose analyzing the message arrival times in
the frequency domain to build a robust detection al-
gorithm even for state transitions. In their research,
M
¨
uter et al. proposed measuring the message entropy
for anomaly detection (M
¨
uter and Asaj, 2011). While
this approach successfully detected injection attacks,
they also demonstrated the shortcomings of their ap-
proach in short-duration attack scenarios. Machine
learning has also been used for the detection of in-
jection attacks. Guidry et al. have proposed using a
one-class classification method (Guidry et al., 2023).
Features of their model included inter-arrival times,
the transmission frequencies, and the deviations from
the typical inter-frame times. They measured the ef-
fectiveness of different one-class classification-based
approaches and concluded that the S-SVDD method
performs the best with an average of 85% detection
rate.
Attackers, however, cannot only inject messages
into the bus, but it is also possible for them to modify
messages, as described in Section 4.
In (Lee et al., 2022), the proposed method can de-
tect these modification attacks by utilizing the tran-
Supporting CAN Bus Anomaly Detection with Correlation Data
287

sient state at the beginning of a modification attack.
For a short time missing messages could indicate a
suspension attack as a preparation step for a modifi-
cation attack. However, if this phase is not detected in
time, the rest of the attack will be successful.
In recent years, many papers have been published
on identifying modification attacks based only on the
message data contents. Among others, researchers
tackled the problem by continuously measuring the
relationship between data fields, forecasting future
data values and later identifying deviations between
the predictions and actual values.
CAN signal correlation analysis is proposed in
(Gazdag et al., 2021) to identify modification attacks.
Even though this approach is robust against attacks
that target highly correlated signals, its effectiveness
is generally limited. The proposed solution calculates
correlations between signals regularly in two differ-
ent time windows to identify ongoing anomalies. In
(Moriano et al., 2022), the authors extend correlation
analysis with hierarchical clustering. Their results are
demonstrated on a dataset, but it is not compared to
other baseline results. As the presented framework
can only handle entire traffic logs, it is not applicable
as a real-time detector for the CAN bus but only as a
forensics tool.
Time series forecasting is also used to predict fu-
ture values in CAN communication, either on mes-
sage or signal level. These predictive methods can
identify possible modification attacks by measuring
deviations between predicted and actual measured
values.
Using a neural network for anomaly detection has
been proposed in CANet (Hanselmann et al., 2020).
The authors used independent LSTM models for each
message ID to capture the corresponding signal’s tem-
poral dynamics and forecast its future values. The
output of all models is then fed into a fully connected
autoencoder layer, allowing the network to consider
the interdependencies of signals. Although this ap-
proach exploits relations between signals for detec-
tion, this information is not directly used in the net-
work structure. In (Kukkala et al., 2020), the IN-
DRA framework was proposed, which analyzes tem-
poral patterns and behavior of messages using Gated
Recurrent Unit (GRU) based recurrent autoencoders.
One such autoencoder was trained for each message
ID to reconstruct signals within the message. The au-
thors show that INDRA outperforms CANet in accu-
racy and false positive rate. In (Chiscop et al., 2021),
the authors introduce a Temporal Convolutional Net-
work based detection system. Their approach sep-
arates CAN signals and builds individual predictor
models for each signal, similar to CANet and INDRA.
However, as TCN networks are smaller and faster
than previous neural networks, such as LSTMs, their
solution outperforms all previous results. In this pa-
per, we improve on the TCN-based approach by intro-
ducing signal clustering to improve detection results
while reducing the mechanism’s footprint.
3 BACKGROUND
This section provides an overview of the CAN net-
work’s operation within vehicles, outlines the typical
methods used to build an Intrusion Detection System,
and introduces the application of Temporal Convolu-
tional Neural Networks (TCNs) along with signal cor-
relation analysis as part of our proposed anomaly de-
tection approach.
3.1 CAN
Modern-day vehicles have a complex internal control
system comprised of ECUs, each assigned to manage
a specific function. These ECUs are interconnected
via networks, the most important being the Controller
Area Network. While this system has proven reli-
able over the years, external interfaces have exposed
it to potential attacks (Checkoway et al., 2011; Avate-
fipour and Malik, 2018).
Figure 3: Structure of a CAN frame (Kukkala et al., 2020).
On the CAN bus information is transmitted in
frames. A CAN frame is shown in Figure 3, contain-
ing header, payload, and trailer segments. The header
contains the start of the frame signal for synchroniza-
tion, the message identifier (ID), and the data length
code (DLC), which specifies the payload’s length.
The actual data to be transmitted is in the payload
segment. The trailer segment is mainly used for er-
ror checking at the receiver’s end. The cyclic re-
dundancy check (CRC) is used for the data integrity
check, while the acknowledgment (ACK) is used to
confirm reception.
Messages sent over the CAN network have an
ID, either 11 bits or 29 bits long. A typical passen-
ger vehicle uses an 11 bit identifier. The data sec-
tion can range from 0 to 8 bytes of data. Within the
data part, various digital and analog signals are en-
coded. Manufacturers do not disclose how the sig-
ICISSP 2024 - 10th International Conference on Information Systems Security and Privacy
288

nals are encoded, but they can be reverse-engineered
using methods previously proposed in the literature
(Marchetti and Stabili, 2019; Verma et al., 2021;
Markovitz and Wool, 2017).
3.2 Intrusion Detection Systems
In order to detect attacks, Intrusion Detection Systems
(IDS) mainly utilize two methods: signature-based
and anomaly-based detection (Axelsson, 2000).
Signature-based detection systems search for spe-
cific attack features in the examined traffic. While
they have a low false positive rate, they require knowl-
edge of the attacks to detect them accurately. Any at-
tacks that are not modeled in the signature database
will not be detected by the system.
An anomaly detection system relies on learning
the system’s normal behavior and identifying any
messages that indicate a deviation from this benign
state. This approach is beneficial in situation where it
is not possible to describe the attacks in advance.
Vehicular networks show large variations, as man-
ufacturers significantly change the built-in features
between vehicle types. In this complex landscape, at-
tacks are also customized for each target. Thus, cre-
ating a comprehensive database of every attack is not
feasible, therefore vehicular attack detection systems
are mostly anomaly-based.
Our detection model is based on an unlabeled data
model, built from benign network traffic of a test ve-
hicle, that implements an anomaly-based IDS system.
Although the dataset we use includes real attacked
CAN data, it will only be used for testing and evalua-
tion purposes as it is not representative of all possible
attack types.
3.3 Temporal Convolutional Networks
Convolutional Neural Networks (CNNs) and Tempo-
ral Convolutional Networks (TCNs) are deep learn-
ing architectures widely used for various tasks, in-
cluding image recognition and natural language pro-
cessing. They offer significant benefits when applied
to time series data, making them suitable for detect-
ing anomalies in the Controller Area Network (CAN)
(Chiscop et al., 2021).
CNNs are designed to process grid-like data, such
as images, by applying convolutional filters to extract
spatial features. In the case of time series data, 1-
dimensional causal convolutions can be used to iden-
tify local patterns and dependencies within the data.
A TCN is a type of deep learning architecture
designed explicitly for sequential data, such as time
series. To process sequences in parallel, TCNs use
Figure 4: Structure of a stack of dilated causal convolutional
layers in TCN (Remy, 2020).
dilated convolutions, which enable them to capture
long-range dependencies efficiently, as shown in Fig-
ure 4. This ability is critical in identifying anoma-
lies that may occur over extended periods or exhibit
complex temporal behaviors. Additionally, TCNs
stack multiple layers for hierarchical feature extrac-
tion. They also employ causal padding, ensuring only
past and present information is used. Due to these
features, TCNs are suitable for various applications,
including time series forecasting and anomaly detec-
tion.
TCNs can handle large volumes of data, making
them suitable for analyzing extensive CAN message
traffic. This architecture can be optimized for real-
time processing, allowing immediate anomaly detec-
tion and response in safety-critical CAN systems.
4 ATTACKER MODEL
This section discusses the attacker model and the at-
tack surface of a CAN network. We describe the ca-
pabilities and goals of an attacker and classify the po-
tential attacks that an attacker may perform on CAN
messages.
We assume that the attacker can gain access to
the vehicle using the most common attack vectors
(Checkoway et al., 2011). The goal of the attacker
is to send forged data to an ECU, forcing it into a
corrupt state. This could cause problems anywhere
between showing invalid values on the dashboard to
making the vehicle completely unusable or stealing
it
1
, depending on the target ECU.
This goal can be achieved in multiple ways. An at-
tacker with physical access to the vehicle can add new
devices to the CAN network. Vehicles with wireless
interfaces, such as Bluetooth, WiFi, or a 3G/4G/5G
connection, can also be attacked remotely. After ex-
ploiting a vulnerability in the communicating ECU,
similar CAN transmission capabilities can be gained.
This is the first necessary step of any attack against
the CAN bus.
1
https://arstechnica.com/information-
technology/2023/04/crooks-are-stealing-cars-using-
previously-unknown-keyless-can-injection-attacks
Supporting CAN Bus Anomaly Detection with Correlation Data
289

The CAN network operates reliably under normal
conditions; however, due to the absence of security
provisions within its specification, it remains suscep-
tible to potential attacks. Once an attacker has the ca-
pability to interact with the CAN bus, there are multi-
ple possible attack strategies, including DoS, message
injection, and message modification. The latter two
are also referred to as a fabrication and a masquerade
attack.
We focus only on the most challenging problem,
which is the message modification attack. During
these attacks the repetition times of the messages are
unchanged, as there are no new messages introduced
to the network. Hence, messages arrive at their ex-
pected time but with a modified data content. Carry-
ing out such an attack requires strong technical skills,
nevertheless, its feasibility has already been demon-
strated in (Cho and Shin, 2016). A practical imple-
mentation of such an attack exploits the error han-
dling mechanism of the CAN protocol. If a device
detects an error during transmission, an error signal
bit can be used to inform the sender about the prob-
lem. Repeated error signals can force an ECU into
an error state. In this state all further message trans-
missions are suspended, allowing an attacker to take
the place of the ECU in the communication and send
modified messages. Therefore, identifying modifica-
tion attacks based only on meta-data (e.g., the number
or timing of CAN messages) is not possible. In this
paper, we present a novel anomaly detection mecha-
nism, designed to detect such attacks.
5 PROPOSED SOLUTION
Our solution has three main components: after ex-
tracting signals from the raw CAN traffic, (1) cor-
related signals are grouped together using clustering,
(2) a separate and independent supervised forecast-
ing model per group predicts the next value of all
correlated signals within a group, and finally (3) an
anomaly is reported if at least one of the forecast-
ing model’s predictions deviate significantly from the
true, observed values of the predicated signals. We
detail the operation of each component as follows.
5.1 Preprocessing of CAN Traffic
All signals from the available CAN messages are
extracted using the manufacturer’s specification or
any state-of-the-art automatic extraction tool (Nolan
et al., 2018; Marchetti and Stabili, 2019; Verma et al.,
2021). As not all extracted signals are equally useful
for anomaly detection, a subset K of all extracted sig-
nals are retained while the rest are dropped. Indeed,
useless signals are extracted from unused parts of the
CAN messages (i.e., there is no device in the vehicle
that uses that part of the message), or carry constant
values with no predictive power. This filtering pro-
cess also helps minimize the size of the forecasting
model detailed in Section 5.3. Finally, all retained
signals are normalized by dividing each signal value
by their theoretical maximum that is either specified
by the manufacturer, or computed as ⌈2
s
⌉ where s is
the number bits used to store the signal in the CAN
message.
5.2 Grouping of Correlated Signals
All retained K signals are clustered into C groups
based on their pairwise correlation value. Specifi-
cally, each signal is first assigned to a separate cluster
and then the closest clusters are iteratively merged un-
til the number of clusters attains K, where the close-
ness of two clusters is measured by a chosen corre-
lation metric of their respective centroids. Our ap-
proach is not restricted to any specific similarity mea-
sure or clustering technique. Still, as we show in Sec-
tion 6, linear correlation with hierarchical clustering
is already effective in practice.
5.3 Signal Forecasting
We train C supervised models on the clustered CAN
data in order to predict the next upcoming signal
value: all retained K signals are divided into equally-
sized overlapping segments using a sliding window
with size w, and each segment serves as input to the
forecasting model to predict the subsequent signal
value immediately following the segment.
More precisely, let a signal with ID s be rep-
resented as a time series (T
s
1
,.. .,T
s
n
) after pre-
processing, and M
G
= [(T
g
j
1
,T
g
j
2
,..., T
g
j
n
)] ∈ R
|G|×n
denotes the time series of all correlated signals
in group G, where G = {g
1
,..., g
|G|
} are the set
of signal IDs belonging to G. For any signal
group G, a forecasting model f
G
simultaneously pre-
dicts the next element of each signal of the group:
given the most recent w signal values M
G
t−w:t
=
[(T
g
j
t−w
,T
g
j
t−w+1
,..., T
g
j
t−1
)] ∈ R
|G|×w
as input, the fore-
casting model predicts the next value M
G
t:t+1
=
(T
g
1
t
,T
g
2
t
,..., T
g
|G|
t
)
⊤
∈ R
|G|
of every signal in G. Be-
fore deployment, all forecasting models are trained on
CAN data that comes from the same or sufficiently
similar distribution as the actual CAN traffic after de-
ployment.
ICISSP 2024 - 10th International Conference on Information Systems Security and Privacy
290

5.4 Decision
We compare the prediction made by every forecasting
model with the actual, observed values of the signals,
and report anomaly if the deviation of the prediction
is too large for any group.
More precisely, let O
G
t:t+1
denote the actual, ob-
served value of the signals at time t in group G after
performing the pre-processing steps detailed in Sec-
tion 5.1. The prediction error for group G at time t is
defined as
err
G
(t) =
1
|G|
|| f
G
(O
G
t−w:t
) − O
G
t:t+1
||
2
2
(1)
which measures the mean squared error (MSE) be-
tween the actual signal values and the values predi-
cated by f
G
from the last w observed values of the
signal. Note that O denotes the true value of the sig-
nal that is observed on-line after the deployment of
the trained forecasting model f
G
.
A naive method of detection is to directly com-
pare the prediction error with a threshold τ, and report
anomaly if err
G
(t) ≥ τ for any group G. However,
since the variance of err
G
(t) can be large depending
on the accuracy of the forecasting model f
G
, this ap-
proach can yield large detection error: any value of
τ would induce either too many false positives (for
smaller τ) or false negatives (for larger τ). To mitigate
such effect of forecasting inaccuracy, we rather com-
pare the mean of the last ℓ error values with the thresh-
old, that is, report anomaly if (1/ℓ)
∑
t−1
i=t−ℓ
err
G
(i) ≥ τ
for any group G. This approach also more reliably
detects stealthier attacks that span multiple time slots
and involve insignificant modification of the signal
value per slot, but surpass the threshold when aggre-
gated.
To adjust τ, we follow the standard three-sigma
rule and set τ to three times the standard deviation of
(1/ℓ)
∑
t−1
i=t−ℓ
err
G
(i) plus its expected value on normal
(attack-free) traffic (Dani et al., 2015). The underly-
ing assumption is that, without adversarial manipula-
tion, the cumulative prediction error lies within three
standard deviations of its mean that has a probability
of 0.9973 if it is normally distributed (which is the
case if ℓ is sufficiently large). The three-sigma rule is
applicable even without access to attacked traffic be-
fore deployment, otherwise an optimal calibration of
τ follows from the Neyman-Pearson lemma.
As we discussed in this section, we applied a
threshold to the difference between predicted and ob-
served values in our modeling. Depending on the con-
text, a manufacturer may prioritize minimizing false
positives to quickly detect and respond to attacks or
investigate all suspicious cases. However, the chosen
threshold may result in some low-intensity and short-
duration attacks going undetected.
5.5 Discussion
5.5.1 Why Grouping Correlated Signals?
The joint forecasting of correlated signals offers sev-
eral advantages for anomaly detection. First, it al-
lows a single model per group to leverage the inher-
ent interdependencies among group members, result-
ing in more accurate forecasts for each signal within
the group. Second, any malicious modification of a
signal is likely to impact the predictions of all group
members, thereby increasing the cumulative predic-
tion error as described in Eq. (1). This enhances the
detectability of attacks compared to prior methods in
the literature, as demonstrated in Section 6. Finally,
instead of creating a stand-alone model for each in-
dividual signal as in (Chiscop et al., 2021), our ap-
proach requires the construction of only K forecast-
ing models, rendering it a more appealing choice in
resource-constrained environments.
5.5.2 Cost Analysis
The cost of our approach is dominated by that of
the forecasting models. Apart from the C forecasting
models, K · w signal values are stored for forecasting
and K · ℓ error values for decision purposes. The fore-
casting models are trained off-line in parallel, and the
trained models are deployed in the vehicle. Therefore,
the computational cost is dominated by the inference
time of the forecasting models, where the inference
processes of models are parallelizable.
6 EVALUATION
6.1 Dataset
We use two CAN datasets for evaluation: Dataset-1
introduced in (Chiscop et al., 2021), and Dataset-2
introduced in (Gazdag et al., 2023).
Dataset-1 contains seven short (<1 minute) traces
of specific driving and traffic scenarios, and a longer
trace (∼25 minutes). Dataset-2 contains nine short
traces and eleven longer traces.
As the datasets originate from the same vehicle
type, both have 20 message IDs and 1-6 signals per
ID. Similarly, both datasets contain message injection
and message modification attacks. As our objective is
to detect modification attacks, we only use the corre-
sponding traces.
Supporting CAN Bus Anomaly Detection with Correlation Data
291
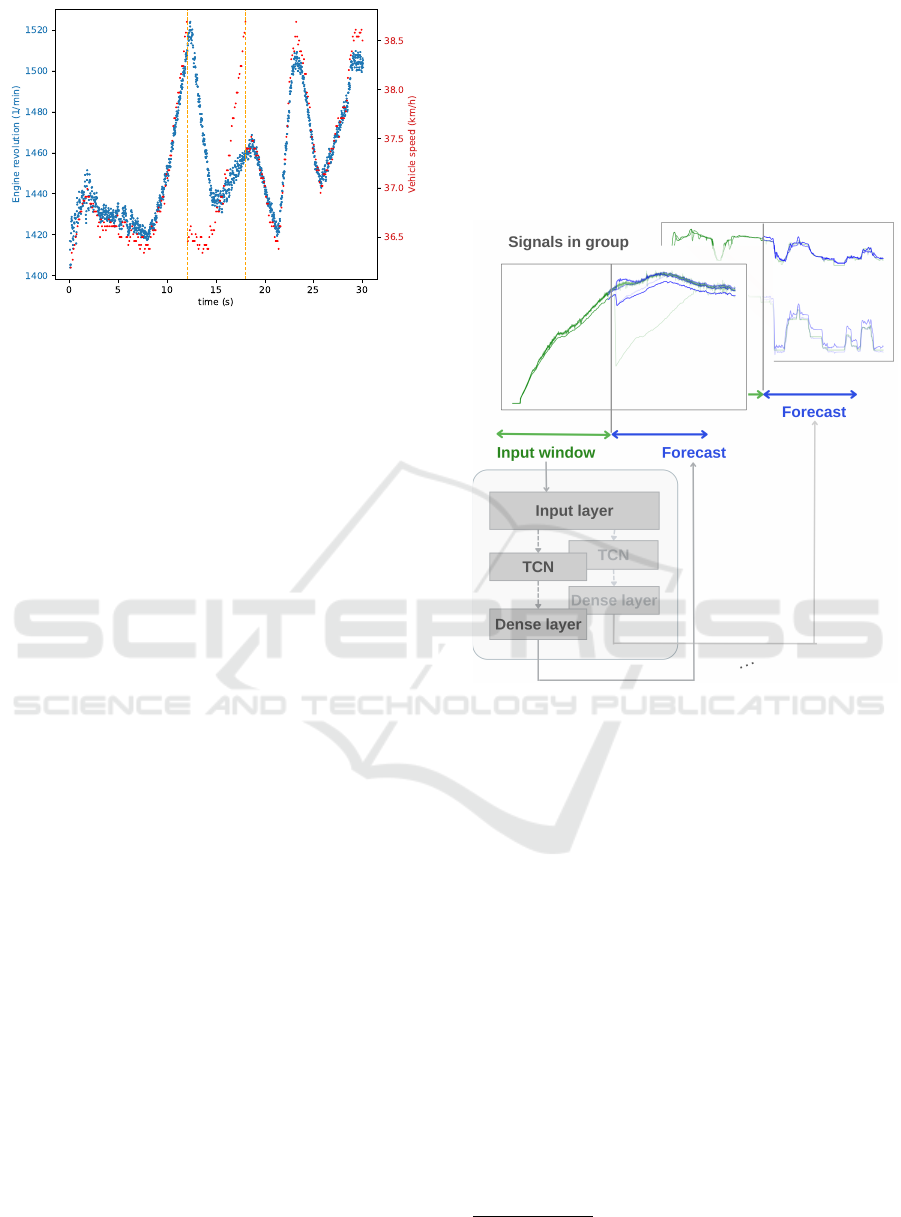
Figure 5: REPLAY attack, shown between the vertical lines,
targeting messages with ID 0410, modifying speed signals
(Gazdag et al., 2023).
We evaluate our mechanism on Dataset-1 to com-
pare its performance to the chosen baseline described
in Section 6.3. Since the two datasets are based on
very similar CAN traffic from the same vehicle type,
and most attacks follow the same strategy (only the
RANDOM and DELTA attacks are not included in
both), we present only the joint results.
The attacks have been performed using 6 different
signal modification strategies:
• ADD-DECR. Modify with decrement value: a de-
crease per message is subtracted from the original
value.
• ADD-INCR. Modify with increment: increases
the original value by one increment per message.
• CONST. Change to constant: constant value re-
places the original value.
• NEG-OFFSET. Modify with delta: a given value
is subtracted from the original data value.
• POS-OFFSET. Modify with delta: a given value
is added to the original data value.
• REPLAY. Replace the original data value with a
previous value.
• DELTA. An attacker chosen value is added to the
original value.
• RANDOM. The original value is replaced by a
new random value in every attacked message.
For illustration, an example for a REPLAY modi-
fication attack is depicted in Figure 5.
6.2 Model Architecture and Parameters
For evaluation, we instantiate our proposal described
in Section 5. We create two datasets for training and
testing purposes. A total number of 3.2 million CAN
messages were used to create a training dataset for
signal forecasting and calibrating all parameters of
our approach (i.e., K, C, w, ℓ). Our calibrated model is
tested on 1.3 million benign and malicious test mes-
sages (67 attacked traces and 9 benign traces), each
containing one attacked signal. Both datasets undergo
the same pre-processing steps with the same parame-
ters that were computed exclusively on the training
data.
Figure 6: Visualization of the forecasting module.
Pre-Processing. We use a signal mask based on the
bit flip rate to extract relevant signals. We retain
K = 20 of the N = 77 extracted signals that describe
the state of the vehicle and likely to have sufficient
predictive power for signal forecasting
2
. The retained
signals are normalized as described in Section 5.1.
Signal Grouping. We conduct a correlation analy-
sis on the signals and identify groups of correlated
signals. We utilize hierarchical clustering with Pear-
son correlation as a similarity measure, and group
linearly dependent signals together accordingly. We
identify C = 9 clusters of the 20 signals in our dataset.
Signal Forecasting. For forecasting, we use multi-
channel Temporal Convolutional Networks (TCN).
We apply an input sliding window of size w = 1750,
equivalent to roughly 3 seconds, and each TCN has
a receptive field with the same size w. Each channel
2
Note that this information is already known to a car
manufacturer
ICISSP 2024 - 10th International Conference on Information Systems Security and Privacy
292

of the multi-channel model corresponds to an individ-
ual signal in the group. The output of the TCN lay-
ers is then forwarded to a fully connected linear layer
which generates the prediction of the upcoming signal
values. Each multichannel TCN layer has four dilata-
tion layers with a logarithmic offset of 2 (1,2, 4,8).
The kernel size is fixed at 16. We train each forecast-
ing model with Adam optimizer and MSE loss using
early stopping. This forecasting module is illustrated
in Figure 6.
The total size of all forecasting models, capable
of handling all message IDs together in groups, is ap-
proximately 15 MB and contains 4.157 million pa-
rameters.
Figure 7: Visualization of the decision module.
Decision. We average the last ℓ = 200 prediction
error values of our forecasting models and compare
with threshold τ which is calibrated according to the
three-sigma rule on the training data as described in
Section 5.4. In other words, we do not use the at-
tacked traces in our dataset to adjust τ because it is
unlikely to have sufficiently representative data about
all possible attacks in practice. The decision module
is illustrated in Figure 7.
6.3 Comparison with Baselines
The most relevant related works are CANet (Hansel-
mann et al., 2020), INDRA (Kukkala et al., 2020),
and the single TCN (S-TCN) anomaly detector archi-
tecture from (Chiscop et al., 2021). To avoid confu-
sion, from now on, we will refer to the Single TCN
method (S-TCN), and refer to our proposed solution
described in Section 6.2 as Correlation-based TCN
(C-TCN).
The INDRA framework has been shown to out-
perform other relevant unsupervised approaches in-
cluding CANet regarding false positives and detection
accuracy. Moreover, according to numerical experi-
ments on two datasets, the SynCAN dataset (Hansel-
mann et al., 2020) and Dataset-1, the S-TCN ap-
proach has larger accuracy with a significantly lower
false positive rate than INDRA. Therefore, it is suf-
ficient to show that our solution outperforms the S-
TCN approach, because it has demonstrated superior
performance compared to CANet and INDRA (Chis-
cop et al., 2021).
To properly compare the two results, we adapt the
S-TCN approach by training one TCN model per sig-
nal but keeping the rest of the process, i.e., the data
pre-processing, the same as our C-TCN solution. As
expected, this adapted approach can reconstruct the
expected behavior of CAN signals individually.
6.4 Evaluation Metrics
We evaluate both the baseline S-TCN and our pro-
posed C-TCN method using standard performance
metrics: accuracy, false positive rate, precision, and
recall.
Accuracy =
T P + T N
T P + T N + FP + FN
(2)
Precision =
T P
T P + FP
(3)
Recall =
T P
T P + FN
(4)
FPR =
FP
FP + T N
(5)
Metrics are calculated according to Equations 2,
3, 4, 5, where TP means the number of true positive
detections, FP the number of false positives, TN the
true negatives and FN the false negatives.
Precision and recall are particularly important
metrics in this context, since the testing dataset is
often imbalanced; attacks on the CAN bus are of-
ten short, which means that the number of benign in-
stances significantly exceeds the number of attack in-
stances.
In addition, we also measure the time it takes to
detect attacks (denoted by T
D
), and the fraction of at-
tacked traces that are successfully detected (denoted
by R
D
):
T
D
=
∑
N
t
n=1
(t
detection
−t
attack
)
N
t
(6)
Supporting CAN Bus Anomaly Detection with Correlation Data
293
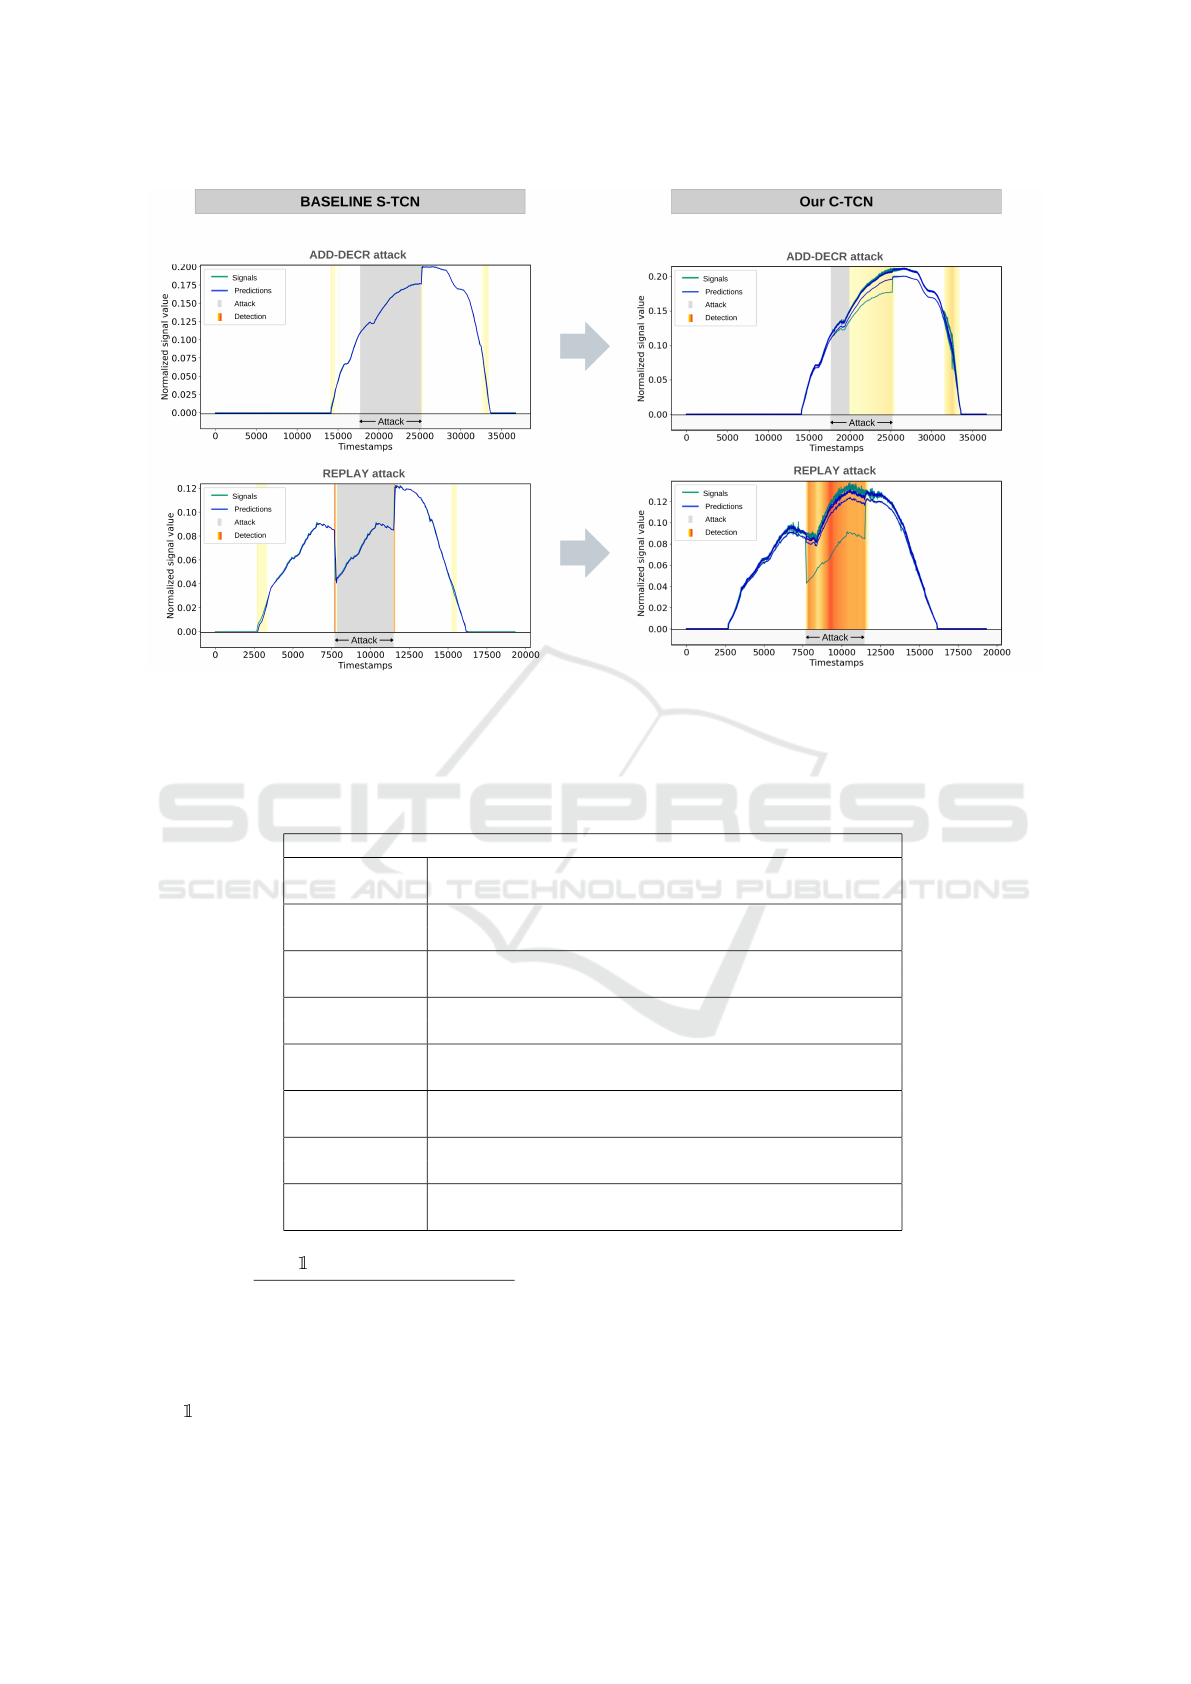
Figure 8: Comparative evaluation of S-TCN vs. C-TCN on two attacked traces. ADD-DECR (add decrement value) attack
(first row of each column) and a REPLAY attack (second row of each column) are shown. The figure shows the attacked region
marked by grey vertical lines and detections marked by yellow to red vertical lines, with the magnitude of the cumulative
prediction error indicated by the darkness of the color.
Table 1: Comparing detailed results of evaluating the baseline S-TCN and the proposed correlation-based C-TCN on each
attack types from both dataset.
Model Accuracy FPR Precision Recall R
D
ADD-DECR
S-TCN 0.93 0.06 0.35 0.34 0.45
C-TCN 0.97 0.05 0.78 0.73 0.95
ADD-INCR
S-TCN 0.91 0.05 0.28 0.13 0.43
C-TCN 0.97 0.04 0.79 0.71 0.96
CONST
S-TCN 0.91 0.04 0.09 0.01 0.0
C-TCN 0.97 0.04 0.64 0.62 0.8
NEG-OFFSET
S-TCN 0.94 0.02 0.18 0.04 1.00
C-TCN 0.98 0.02 0.75 1.00 1.00
POS-OFFSET
S-TCN 0.94 0.02 0.18 0.04 1.00
C-TCN 0.98 0.02 0.76 1.00 1.00
REPLAY
S-TCN 0.93 0.03 0.08 0.03 0.55
C-TCN 0.96 0.02 0.80 0.65 1.00
DELTA
S-TCN 0.9 0.03 0.05 0.01 1.00
C-TCN 0.99 0.06 0.86 0.87 0.88
RANDOM
S-TCN 0.97 0.11 0.84 0.99 1.00
C-TCN 0.99 0.06 0.92 1.00 1.00
R
D
=
∑
N
t
n=1
{trace n is detected as anomalous}
N
t
(7)
where N
t
is the number of attacked traces, t
detection
is
the time of detection (time of the first message whose
signal values trigger anomaly), t
attack
is the starting
time of the attack (time of first attacked message)
and is the indicator function. Note that, while re-
call in Eq. (2) measures the detection performance on
individual messages, detection rate measures the re-
call with respect to the traces. Indeed, both datasets
used for evaluation includes short driving scenarios
affected by various types of attacks, as described in
Section 6.1, and an attacked trace is successfully de-
tected if at least one message belonging to the at-
tacked section of the trace triggers detection.
ICISSP 2024 - 10th International Conference on Information Systems Security and Privacy
294

6.5 Results
All experiments were done using the TCN implemen-
tation in Keras (Remy, 2020).
Table 2 shows the accuracy and false positive rate
for benign and malicious test sets, as well as the pre-
cision, recall, detection rate, and detection delay for
attacked traces. These metrics are calculated across
multiple traces and averaged to provide the overall re-
sults displayed in the table.
All metrics are also calculated for each attack type
individually to determine the effectiveness against
each type. The results in Table 1 show that both our
solution and the baseline solution can easily detect at-
tacks like NEG-OFFSET, POS-OFFSET, RANDOM,
DELTA and some REPLAY attack. The baseline S-
TCN performs poorly against the stealthier ADD-
DECR, ADD-INCR and CONST attacks, while our
results are 95%, 96%, and 80% respectively.
After experimenting, we conclude that
correlation-based C-TCN can effectively detect
attacks on CAN bus data. Our major findings are as
follows:
1. Grouping of CAN signals based on correlation
improves the detection performance from 68%
to 95% which means that our proposed C-TCN
method can detect 95% of all the attack scenarios.
These attacks are detected with a delay of 0.38
seconds on average.
2. Correlation-based C-TCN significantly outper-
forms S-TCN on all evaluated metrics, espe-
cially regarding precision and recall, where C-
TCN achieves 80-83% average performance.
3. Table 1 shows that our C-TCN can detect even
stealthier attacks that do not significantly mod-
ify signals (i.e. ADD-DECR, ADD-INCR and
CONST attacks). Figure 8 presents an example
of this improvement over the S-TCN baseline.
As Figure 8 shows, S-TCN fails to detect the
stealthier ADD-DECR attack, which slowly modifies
the original signal message-by-message. It is only de-
tected when the attack abruptly stops, and the signal
Table 2: Comparing overall results of evaluating the base-
line S-TCN and the proposed correlation-based C-TCN on
benign and malicious test traces from both dataset.
BENIGN MALICIOUS
S-TCN C-TCN S-TCN C-TCN
Accuracy 0.98 0.99 0.93 0.98
FPR 0.03 0.02 0.05 0.04
Precision - - 0.30 0.80
Recall - - 0.24 0.83
R
D
- - 0.68 0.95
returns to its original value. In contrast, our C-TCN
model can detect the attack earlier when the modi-
fication induces a detectable change in the cumula-
tive prediction error. Similarly, while both models
can detect the start of a replay attack, the baseline
S-TCN cannot detect it throughout the entire attack
span, whereas our C-TCN can.
7 CONCLUSION
This paper presented a novel approach to intrusion
detection on the CAN bus. We aimed at detecting
message modification attacks, the most complex at-
tack type possible on the CAN bus. We showed that a
correlation-based TCN model can efficiently predict
the subsequent values of the vehicle signals, which
can be used for anomaly detection. Finally, we also
presented measurements demonstrating that our ap-
proach outperforms the state-of-the-art.
Our main contribution is to combine correlation
analysis with time-series forecasting to improve de-
tection accuracy. By grouping signals first based on
their correlation, we create models that can predict
future values with a high accuracy. During an attack,
the forecasting of a group of correlated signals is sig-
nificantly less accurate, allowing the detection of the
anomaly. Furthermore, by grouping the signals, we
can use fewer models resulting in a smaller footprint,
which is an important factor for embedded systems.
In case an attacker knows which signals are clus-
tered together and understands how the signals usu-
ally behave, it may be able to modify all the signals
in the group without being detected. This requires
maintaining the normal signal behavior including the
inter-dependencies between different signals. How-
ever, it is unlikely that the attacker have all these ca-
pabilities in practice, especially if the groups are suf-
ficiently large and the device running our integrated
solution is adequately protected.
In our future work, we plan to evaluate the perfor-
mance of our mechanism for detecting message in-
jection attacks, aiming to have only a single anomaly
detection system in vehicles.
ACKNOWLEDGEMENTS
Support by the the European Union project RRF-
2.3.1-21-2022-00004 within the framework of the Ar-
tificial Intelligence National Laboratory.
Supporting CAN Bus Anomaly Detection with Correlation Data
295

REFERENCES
Avatefipour, O. and Malik, H. (2018). State-of-the-art sur-
vey on in-vehicle network communication (can-bus)
security and vulnerabilities.
Axelsson, S. (2000). Intrusion detection systems: A survey
and taxonomy. Technical report, Stockholm Univer-
sity.
Bozdal, M., Samie, M., Aslam, S., and Jennions, I. (2020).
Evaluation of can bus security challenges. Sensors,
20(8).
Checkoway, S., McCoy, D., Kantor, B., Anderson, D.,
Shacham, H., Savage, S., Koscher, K., Czeskis, A.,
Roesner, F., and Kohno, T. (2011). Comprehensive
experimental analyses of automotive attack surfaces.
In 20th USENIX Security Symposium (USENIX Secu-
rity 11), San Francisco, CA. USENIX Association.
Chiscop, I., Gazdag, A., Bosman, J., and Bicz
´
ok, G. (2021).
Detecting message modification attacks on the CAN
bus with temporal convolutional networks. In Pro-
ceedings of the 7th International Conference on Vehi-
cle Technology and Intelligent Transport Systems.
Cho, K.-T. and Shin, K. G. (2016). Fingerprinting elec-
tronic control units for vehicle intrusion detection. In
Proceedings of the 25th USENIX Security Symposium,
pages 911–927. USENIX Association.
Dani, M.-C., Jollois, F.-X., Nadif, M., and Freixo, C.
(2015). Adaptive threshold for anomaly detection us-
ing time series segmentation. In Arik, S., Huang,
T., Lai, W. K., and Liu, Q., editors, Neural Informa-
tion Processing, pages 82–89, Cham. Springer Inter-
national Publishing.
Gazdag, A., Ferenc, R., and Butty
´
an, L. (2023). Crysys
dataset of can traffic logs containing fabrication and
masquerade attacks. Scientific Data.
Gazdag, A., Lupt
´
ak, G., and Butty
´
an, L. (2021).
Correlation-based anomaly detection for the can bus.
In Euro-CYBERSEC, Nice, France.
Gazdag, A., Neubrandt, D., Butty
´
an, L., and Szalay, Z.
(2018). Detection of injection attacks in compressed
can traffic logs. In International Workshop on Cyber
Security for Intelligent Transportation Systems, Held
in Conjunction with ESORICS 2018. Springer.
Guidry, J., Sohrab, F., Gottumukkala, R., Katragadda, S.,
and Gabbouj, M. (2023). One-class classification for
intrusion detection on vehicular networks.
Hanselmann, M., Strauss, T., Dormann, K., and Ulmer, H.
(2020). Canet: An unsupervised intrusion detection
system for high dimensional can bus data. IEEE Ac-
cess, 8:58194–58205.
Kukkala, V. K., Thiruloga, S. V., and Pasricha, S. (2020).
Indra: Intrusion detection using recurrent autoen-
coders in automotive embedded systems.
Lee, S., Jo, H. J., Cho, A., Lee, D. H., and Choi, W.
(2022). Ttids: Transmission-resuming time-based in-
trusion detection system for controller area network
(can). IEEE Access, 10:52139–52153.
Marchetti, M. and Stabili, D. (2019). Read: Reverse engi-
neering of automotive data frames. IEEE Transactions
on Information Forensics and Security, 14(4):1083–
1097.
Markovitz, M. and Wool, A. (2017). Field classification,
modeling and anomaly detection in unknown can bus
networks. Vehicular Communications, 9.
Moriano, P., Bridges, R. A., and Iannacone, M. D. (2022).
Detecting can masquerade attacks with signal cluster-
ing similarity. ArXiv, abs/2201.02665.
M
¨
uter, M. and Asaj, N. (2011). Entropy-based anomaly de-
tection for in-vehicle networks. 2011 IEEE Intelligent
Vehicles Symposium (IV), pages 1110–1115.
Nolan, B. C., Graham, S., Mullins, B., and Kabban, C. S.
(2018). Unsupervised time series extraction from
controller area network payloads. In Proceedings of
the 2018 IEEE 88th Vehicular Technology Conference
(VTC-Fall), pages 1–5. IEEE.
Remy, P. (2020). Temporal convolutional networks for
keras. https://github.com/philipperemy/keras-tcn.
Song, H. M., Kim, H. R., and Kim, H. K. (2016). Intrusion
detection system based on the analysis of time inter-
vals of can messages for in-vehicle network. 2016
International Conference on Information Networking
(ICOIN), pages 63–68.
Verma, M. E., Bridges, R. A., Sosnowski, J. J., Hollifield,
S. C., and Iannacone, M. D. (2021). Can-d: A mod-
ular four-step pipeline for comprehensively decoding
controller area network data. IEEE Transactions on
Vehicular Technology, 70:9685–9700.
Young, C., Olufowobi, H., Bloom, G., and Zambreno, J.
(2019). Automotive intrusion detection based on con-
stant can message frequencies across vehicle driving
modes. In AutoSec ’19: Proceedings of the ACM
Workshop on Automotive Cybersecurity, pages 9–14.
ICISSP 2024 - 10th International Conference on Information Systems Security and Privacy
296
