
A Comprehensive Analysis of Parkinson’s Disease Detection Through
Inertial Signal Processing
Manuel Gil-Martín, Sergio Esteban-Romero, Fernando Fernández-Martínez
and Rubén San-Segundo
Grupo de Tecnología del Habla y Aprendizaje Automático (T.H.A.U. Group), Information Processing and
Telecommunications Center, E.T.S.I. de Telecomunicación, Universidad Politécnica de Madrid, Madrid, Spain
Keywords: Parkinson’s Disease Detection, Inertial Signals, Fast Fourier Transform, Tremor Detection,
Convolutional Neural Networks, Window Size.
Abstract: When developing deep learning systems for Parkinson's Disease (PD) detection using inertial sensors, a
comprehensive analysis of some key factors, including data distribution, signal processing domain, number
of sensors, and analysis window size, is imperative to refine tremor detection methodologies. Leveraging
the PD-BioStampRC21 dataset with accelerometer recordings, our state-of-the-art deep learning architecture
extracts a PD biomarker. Applying Fast Fourier Transform (FFT) magnitude coefficients as a preprocessing
step improves PD detection in Leave-One-Subject-Out Cross-Validation (LOSO CV), achieving 66.90%
accuracy with a single sensor and 6.4-second windows, compared to 60.33% using raw samples. Integrating
information from all five sensors boosts performance to 75.10%. Window size analysis shows that 3.2-
second windows of FFT coefficients from all sensors outperform shorter or longer windows, with a
window-level accuracy of 80.49% and a user-level accuracy of 93.55% in a LOSO scenario.
1 INTRODUCTION
Research on biometrics has experienced notable
growth in recent years, witnessing a surge in various
applications, particularly in the field of healthcare.
The term healthcare biometrics is not only confined
to biometric applications for controlling access to
electronic medical records and patient identification
but also includes medical decision support tools for
patient care. These tools extract biomarkers that
define patient health and aid in illness detection,
medication response analysis, and the management
of chronic conditions such as Parkinson's Disease
(PD). PD is a neurodegenerative disorder
characterized by motor impairments like tremor,
bradykinesia, rigidity, and postural instability
(Jankovic, 2008). These impairments affect various
motor functions, including planning, programming,
sequencing, movement initiation, and execution.
Deep learning algorithms have being applied on
human motion recognition to model the evolution of
physical activities using wearables or cameras
(Manuel Gil-Martin, San-Segundo, Fernandez-
Martinez, & Ferreiros-Lopez, 2020, 2021; Gil-
Martín, San-Segundo, Fernández-Martínez, & de
Córdoba, 2020; Zhang et al., 2017). This way, the
tremor movement related to PD could be also model
by these technologies.
This work proposes a PD detection system based
on a deep learning architecture that allows analyzing
different important aspects to consider when using
tremor to distinguish between healthy people and PD
patients. The primary contributions of this research
are as follows:
Analysis of the inertial signal domain for PD
detection.
Assessment of different sensors to detect PD.
Study of the window length on PD detection.
This paper is organized as follows. Section 2
reviews the literature of PD detection using inertial
sensors. Section 3 reviews the material and methods,
including a description of the dataset, the signal
processing, the deep neural network, and the
evaluation methodology. Section 4 describes the
experiments and the obtained results and section 5
summarizes the main conclusions of the paper.
462
Gil-Martín, M., Esteban-Romero, S., Fernández-Martínez, F. and San-Segundo, R.
A Comprehensive Analysis of Parkinson’s Disease Detection Through Inertial Signal Processing.
DOI: 10.5220/0012360100003636
Paper published under CC license (CC BY-NC-ND 4.0)
In Proceedings of the 16th International Conference on Agents and Artificial Intelligence (ICAART 2024) - Volume 3, pages 462-469
ISBN: 978-989-758-680-4; ISSN: 2184-433X
Proceedings Copyright © 2024 by SCITEPRESS – Science and Technology Publications, Lda.

2 RELATED WORKS
Many researchers have explored the use of machine
learning to detect motor symptoms of Parkinson's
disease using wearable sensors (Channa, Ifrim,
Popescu, & Popescu, 2021; Iakovakis et al., 2020;
Kubota, Chen, & Little, 2016). Some of these works
address the simultaneous detection of multiple
symptoms (Lang et al., 2019). Despite this
significant interest, there are still several aspects that
need improvement, such as overall accuracy in real-
world settings, the acquisition of clinically
significant metrics, and robust detection in patients
for whom there is no training data.
Regarding the extraction of features from inertial
signals, many feature sets have been proposed in the
literature for Parkinson's disease detection based on
tremor. The vast majority of these are based on
measurements in the time domain (such as mean,
range, or cross-correlation), in the frequency domain
(such as dominant frequency, energy content in a
particular band, or signal entropy) (Rigas et al.,
2012), or a combination of the two (Dai, Zhang, &
Lueth, 2015). Some authors have demonstrated that
features traditionally used for speech processing
(e.g., frequency analysis using the Mel scale,
cepstral coefficients) are also effective in classifying
human motion from accelerometer data (San-
Segundo, Manuel Montero, Barra-Chicote,
Fernandez, & Manuel Pardo, 2016; San-Segundo,
Navarro-Hellin, Torres-Sanchez, Hodgins, & De la
Torre, 2019; Vanrell, Milone, & Rufiner, 2018).
As for tremor classification or detection
algorithms, researchers have experimented with a
wide variety of machine learning algorithms, such as
decision trees (Garcia-Magarino, Medrano, Plaza, &
Olivan, 2016), random forests (Arora et al., 2015),
hidden Markov models (Rigas et al., 2012), and
neural networks (Cole, Roy, De Luca, Nawab, &
Ieee, 2010). For example a previous work (Hathaliya
et al., 2022) used a deep learning architecture to
model tremor obtaining a 92.4% of accuracy using
6.4-second windows of raw samples using a single
sensor on the left anterior forearm. However, the
data distribution used in this work seems to simulate
a too optimistic scenario since data from the same
subjects were included in both training and testing
subsets. In addition, there exists a lack of a deep
study of window sizes to select the most appropriate
one to predict the tremor.
This work proposes the use of a deep network for
both feature learning and tremor detection in a
realistic scenario and deeply analyse different
aspects that could affect the final performance, such
as the data distribution, the input signal domain, the
sensors used to feed the system and the size of the
analysis windows. Some of these aspects have been
analysed in activity recognition (Gil-Martín et al.,
2020) but not in PD detection.
3 MATERIALS AND METHODS
This section describes the dataset, the signal
processing, the deep neural network used for the PD
detection and the followed evaluation methodology.
3.1 Dataset
The PD-BioStampRC21 dataset (Adams et al., 2021)
includes tri-axial accelerometer obtained from five
wearable sensors, involving both PD and healthy
control participants. Lightweight MC 10 BioStamp
RC sensors were used to collect the data, with each
participant wearing five sensors attached to specific
body parts, including the chest, left anterior thigh,
right anterior thigh, left anterior forearm, and right
anterior forearm as observed in Figure 1. The
samples were obtained at a sampling rate of 31.25
Hz. Moreover, the dataset contains information
about the participants' medication status and the
Unified Parkinson’s Disease Rating Scale (UPDRS)
but they were not used in this work. The dataset
contains recordings from 34 subjects: 17 healthy
control and 17 PD participants. However, after
analysing the available dataset, it was found that
some sensors from control participants with IDs 007,
014, and 060 had missing data, so they were
removed from the study.
Figure 1: A study participant wearing the sensors at five
different locations on the chest and each limb (Adams et
al., 2021).
3.2 Signal Processing
In this work, two input formats of the inertial signals
were evaluated to feed a deep neural network: Raw
data and Fast Fourier Transform (FFT) magnitude
coefficients. As in the baseline system (Hathaliya et
al., 2022) we used 30,000 readings (16.13 minutes)
for each participant along with their status in order
A Comprehensive Analysis of Parkinson’s Disease Detection Through Inertial Signal Processing
463

to feed the classification system and analyse the
effect of particular aspects instead of using the
whole dataset (Igene, Alim, Imtiaz, & Schuckers,
2023).
First, we divided the recordings into overlapped
windows (a shift equivalent to half the window size
between consecutive windows). The system
classifies each window to healthy control or PD. All
the windows from each participant were labelled as
healthy control or PD depending on the participant’s
health status. In this work, we evaluated the
classification performance when considering
different window sizes of 0.8, 1.6, 3.2, 6.4, 12.8 and
16 seconds corresponding to 25, 50, 100, 200, 300
and 400 time samples, respectively.
Second, for each window size, we analysed both
time and frequency domain signals as inputs to a
deep neural network, considering two different
preprocessing steps depending on the signal domain.
In the first case, no preprocessing was done to the
original signal and the inputs to the deep neural
network were directly the time samples included in
each window (Raw data). In the second case, the
inputs were the coefficients of the FFT magnitude.
These coefficients were precomputed for each
analysis window and represented the spectrum from
0 Hz to half of the sampling frequency, 15.625 Hz
for the PD-BioStampRC21 dataset. As the energy in
tremor motion mostly concentrates in low
frequencies (M. Gil-Martin, Montero, & San-
Segundo, 2019), the obtained spectrogram could be
useful for the PD detection. This paper analyses and
compares both alternatives for the tremor modelling.
3.3 Deep Learning Architecture
The deep learning architecture used in this work was
a state-of-the-art Convolutional Neural Network
(CNN) composed of two main parts: a feature
learning subnet and a classification subnet. The first
subnet learnt features from the raw data or FFT
magnitude coefficients from the inertial signals
using two convolutional layers (32 kernels of (1, 5)
dimensions) and two max-pooling layers (kernels of
(1, 2) dimensions). The second subnet used fully
connected layers to classify the learned features as a
predicted class: healthy person (0) or PD patient (1).
The architecture included dropout layers (0.3) after
max-pooling and fully connected layers to avoid
overfitting during training. The last layer used a
SoftMax activation function to offer the predictions
of each class for every analysis frame, while
intermediate layers used ReLU for reducing the
impact of gradient vanishing effect. We used
categorical cross-entropy as loss metric and the
Adaptive Moment Estimation (Adam) optimizer,
which adaptively adjusts the learning rate
throughout training. We adjusted the epochs and
batch size of the deep learning structure to 30 and
100, respectively. Figure 2 represents the
architecture used in this work to model and classify
the analysis windows to healthy person or PD
patient. This architecture was implemented using the
Keras library and Python programming language.
As observed in the figure, the inputs of the CNN
were organized in a 2D matrix with N x M
dimensions. N corresponds to the number of input
signals: 3 when using a single sensor (X, Y and Z
signals) or 15 when using the five available sensors
in the dataset (3 x 5). M is the number of analyzed
samples from each sensor signal. This number
depends on the size of the analysis window and the
signal domain used in each experiment. M is equal
to the size of the analysis window when using raw
data as input data. Nevertheless, in the frequency
domain, M is the number of FFT coefficients
obtained from each window, and it is equal to the
half of the window size.
3.4 Evaluation Methodology
In this work, different data distributions have been
used to compare to a baseline system and highlight
the importance of correctly train and test a PD
detection system.
The first data distribution, called TrainTest,
consists of using an 80% of data for training and
20% of data for testing. This data distribution was
used by the baseline system (Hathaliya et al., 2022).
When randomly distribute overlapped windows, it is
possible to train and test the system with examples
that share information, which leads to a very
optimistic performance. In addition, examples from
the same subjects can be used for training and
testing. However, one of the main problems of this
data distribution is that the system is only evaluated
over a particular subset of the whole dataset.
To evaluate the system using the whole dataset,
it is possible to create a Cross-Validation (CV)
alternative for this data distribution: TrainTest_CV.
In this K-fold CV methodology, the given data are
divided into k groups or folds to train and test a
system with different data. This process is repeated
changing the training and testing folds and the
results are the average of the partial results obtained
for all repetitions.
ICAART 2024 - 16th International Conference on Agents and Artificial Intelligence
464
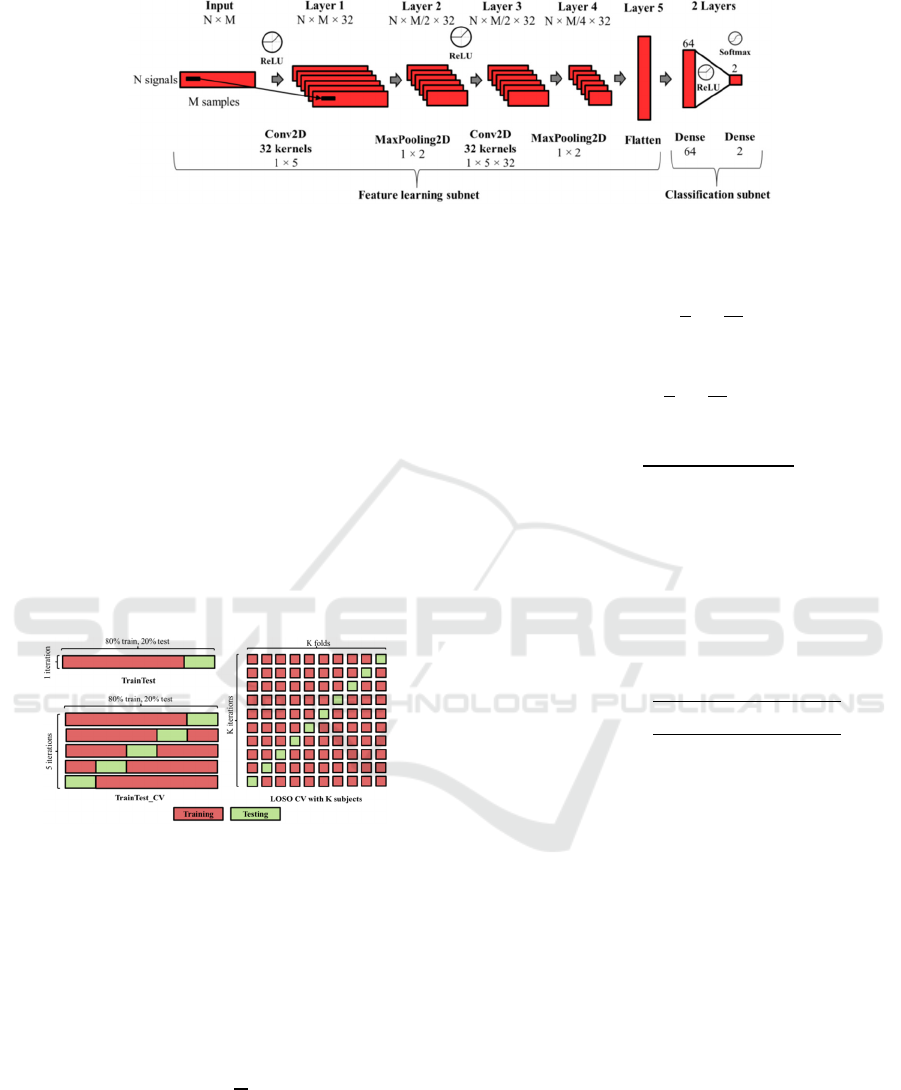
Figure 2: Convolutional Neural Network Architecture used in this work for PD detection where N denotes the number of
input signals and M denotes the number of samples for each analysis window or example.
However, to avoid recordings from the same
subjects in both training and testing subsets (a more
realistic scenario), we decided to consider a Leave-
One-Subject-Out (LOSO) CV, which is a specific
type of K-fold CV where the system is evaluated
with the data from one subject and is trained with
the data from the rest of the subjects. In this case, the
process is repeated several times leaving a different
subject for testing and the results are also the
average of the partial results obtained for all
repetitions. This methodology simulates a more
difficult and realistic scenario where the system is
evaluated with recordings from subjects different to
those used for training. Figure 3 shows examples for
the data distributions described above.
Figure 3: Data distributions for TrainTest, TrainTest_CV
and LOSO CV methodologies.
As evaluation metrics, we used accuracy, which
is defined as the ratio between the number of
correctly classified samples and the number of total
samples. This way, for a classification problem with
N testing examples and C classes, accuracy is
defined in Equation (1).
Accurac
y
1
N
P
(1)
Considering Ri as the sum of all examples in a
column of the confusion matrix, and Si as the sum of
all examples in a row, precision (Equation (2)),
recall (Equation (3)) and F1score (Equation (4))
metrics are defined as follows:
precision
1
C
P
R
(2)
recall
1
C
P
S
(3)
F1score2
precision recall
p
recision recall
(4)
To show statistical significance values, we used
confidence intervals, which include plausible values
for a specific metric. We will assure that there exists
a significant difference between results of two
experiments when their confidence intervals do not
overlap. Equation (5) represents the computation of
confidence intervals attached to a specific metric
value and N samples for 95% confidence level.
CI
95%
1.96
metric 100 metric
N
(5)
In this work, we modelled the tremor at window-
level since the examples used to feed the deep neural
architecture were windows. However, we also
provided a performance at user-level, considering
the mode of the predictions for all the windows from
a subject as the user prediction. This way, it is
possible to integrate the information from all the
windows in a single prediction, which is useful from
a comprehensive medical perspective. This approach
provides overall health trends instead of focusing
exclusively on the presence or absence of tremors
during brief time intervals that could potentially lead
to incomplete or incorrect assessments.
4 RESULTS AND DISCUSSION
This section contains details about the experiments
performed in this work, including results and
discussion about the data distribution, the signal
A Comprehensive Analysis of Parkinson’s Disease Detection Through Inertial Signal Processing
465
domain, the sensors used to feed the system and the
window size of the examples.
4.1 Data Distribution
The first experiments that we performed consists of
using only the three signals from the left anterior
forearm and a window size of 6.4 seconds (200
samples) in order to compare to the baseline system
(Hathaliya et al., 2022). This previous work only
states that they split the dataset into training (80%)
and test (20%). They did not specify any aspect of
considering the subject distributions to avoid mixing
data from the same subject in training and testing
subsets and did not mention any CV approach. This
data distribution (TrainTest) leads to a very
optimistic scenario where the system is trained and
tested with examples from the same subjects that
could share information since the windows are
overlapped. This previous work obtained a 92.4% of
accuracy. Simulating this scenario setup, our
proposed system could easily reach the maximum
performance (100% of accuracy) because the
isolated experiment results would depend on the
final testing examples. In order to obtain a more
general performance evaluating the whole dataset, a
CV approach of this scenario (TrainTest_CV)
obtained 72.42 ± 0.91 % test accuracy.
Despite of this experiment, we considered a more
realistic approach through a LOSO CV. With this
scenario, the system obtained a test accuracy of
60.33 ± 1.0 %.
Table 1 summarizes the results for the different
CV data distributions using Raw data 6.4-second
windows. These approaches evaluated the same
number of examples but simulate very different
scenarios, where LOSO CV approach is a more
realistic scenario because data from testing subjects
were not included in the training process. For this
reason, the performance of the LOSO CV approach
decreased compared to the rest experiments.
To simulate a more realistic scenario, we decided
to keep the LOSO CV approach for the rest of
experiments of this study.
4.2 Signal Domain Analysis
Regarding the signal domain of the inputs, we
decided to compare Raw data windows against using
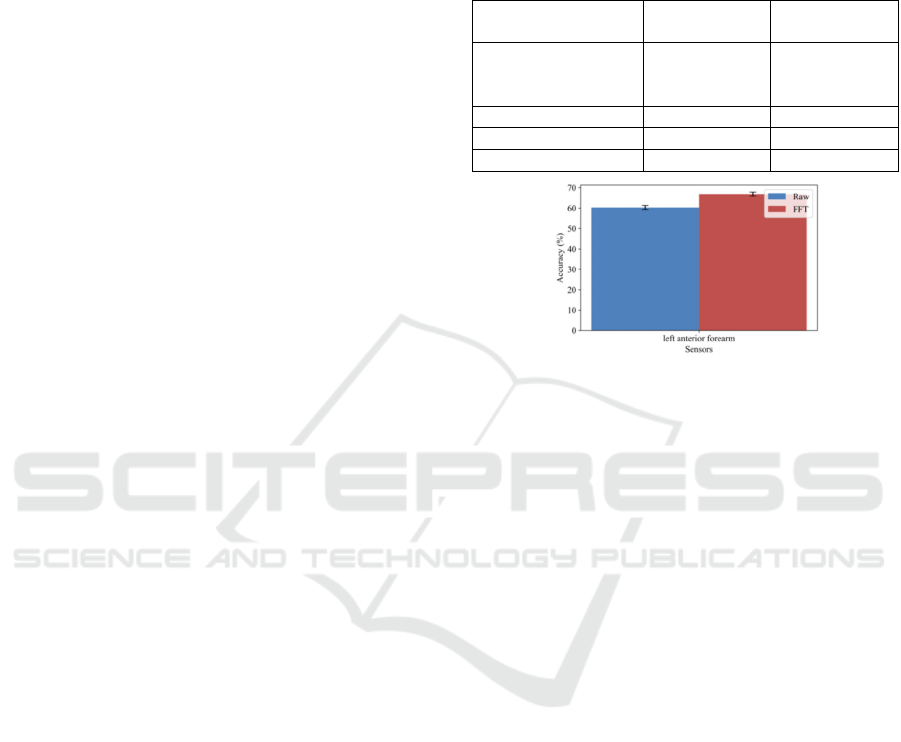
the FFT magnitude coefficients. Figure 4 shows a
comparison of performance at window-level when
using Raw data (60.33 ± 1.0 %) and FFT data (66.90
± 0.96 %) of 6.4-second windows and left anterior
forearm sensor. We observed a significant increment
of performance when using signals in the frequency
domain.
Table 1: Evaluation metrics for different CV data
distributions using Raw data 6.4-second windows and left
anterior forearm sensor.
Data distribution
Test Accuracy
(
%
)
Test F1-score
(
%
)
TrainTest
(Hathaliya et al.,
2022
)
92.40 -
TrainTest 100.00 100.00
TrainTest_CV 72.42 ± 0.91 71.56 ± 0.92
LOSO CV 60.33 ± 1.00 59.20 ± 1.00
Figure 4: Accuracy at window-level using 6.4-second
windows and left anterior forearm sensor depending on the
input signal domain.
One of the possible reasons of this increment
could be that PD tremor becomes more visible in the
frequency domain: information of energy
corresponding to the tremor frequency (between 3–9
Hz (Deuschl, Fietzek, Klebe, & Volkmann, 2003;
M. Gil-Martin et al., 2019)) and its harmonics can be
seen in the spectrum of the X, Y and Z signals of the
inertial sensor. This way, the use of a CNN with
FFT magnitude coefficients as inputs allowed
obtaining better results compared to using raw data
samples directly.
4.3 Sensors Analysis
Since the available dataset provides information
from several sensors distributed over different
locations in the body, we decided to analyse which
sensor provide more valuable information regarding
the tremor motion and combine the information from
all of them. Figure 5 shows the accuracy at window-
level using 6.4-second windows depending on the
input signal domain (Raw or FFT) and sensors used
to feed the deep learning architecture.
It is possible to observe that for all the systems
(using a single sensor or all sensors together), using
the FFT approach provides a significant
improvement compared to directly using the raw
samples. In addition, we observed that the systems
ICAART 2024 - 16th International Conference on Agents and Artificial Intelligence
466
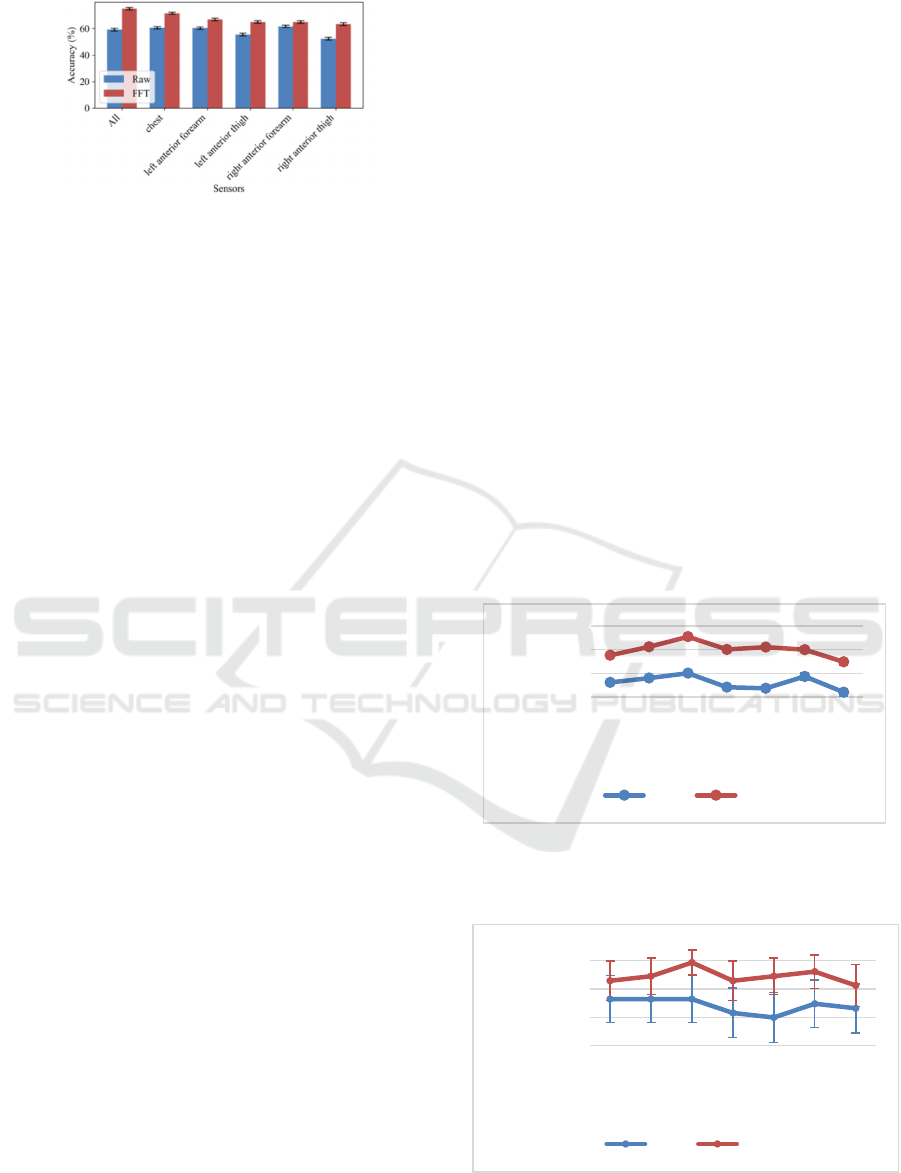
Figure 5: Accuracy at window-level using 6.4-second
windows depending on the input signal domain and
sensors.
using only the chest, left anterior forearm and or
right anterior forearm sensors and the system using
all the sensors together offer similar performance
when using raw data (e.g., 60.60 ± 0.99 % test
accuracy with the chest sensor). This means that the
motion symptoms are more noticeable in the chest
and upper limbs. Moreover, when analysing the FFT
signal experiments, it is possible to observe that the
chest is the single sensor that offers better
performance (71.57 ± 0.92 %). However, using all
the sensors provides a significant improvement
compared to the rest of experiments (75.10 ± 0.88
%). Then, the CNN architecture is capable to
integrate the information from the different sensors
and learn more meaningful features to model the
tremor.
For these reasons, we decided to use all the
sensors for the rest of experiments of this study.
4.4 Window Size Analysis
To study the effect of the window size over the PD
detection, we used windows of 0.8, 1.6, 3.2, 6.4,
12.8 and 16 seconds in time and frequency domain.
As observed in Figure 6 and Figure 7, the binary
classification performance showed improvement
with an increase in the duration of the analysis
window from 0.8 seconds to 3.2 seconds. However,
it decreased after 3.2 seconds. When using long
windows in a PD detection system that relies on
deep learning algorithms, the performance tends to
either saturate or decline. This occurrence could be
explained based on two factors (Manuel Gil-Martin
et al., 2021). Firstly, the increase in the window size
raises the number of parameters that require training
in the deep learning architecture. This aspect could
affect the final performance, especially when the
dataset has a limited number of examples for
training. Secondly, long windows raise the risk of
overfitting. For example, the application of the FFT
on lengthy windows increments the frequency
resolution, leading each hertz to be represented with
a larger number of data points. This resolution
escalates the vulnerability to overfitting and
undermines the robustness in a LOSO CV scenario.
Consequently, generalizing the trained model for the
evaluation of data from unseen subjects becomes
challenging. In addition to these two factors, in the
PD detection case study it is important to select an
appropriate window size because long windows
could mix tremor events with motion not associated
to PD. When increasing the window size, the
analysis windows could include most motion
without PD glimpses. This could disturb the
modelling process because the long windows could
smooth the tremor peak and they could be classified
as control. Moreover, as observed before for the 6.4-
second windows analysis, the deep study through
different window size confirms that the FFT
coefficients provide significant higher performance
compared to the Raw data for all the windows at
window-level (Figure 6). Regarding, user-level
classification (Figure 7), since LOSO methodology
reduces the number of examples to the number of
users, the confidence intervals are higher in this
case, but there still exists a tendency of the
improvement provided by the FFT. Even in this
Figure 6: Window-level PD classification accuracy using
all sensors depending on the window size and input signal
domain.
Figure 7: User-level PD classification accuracy using all
sensors depending on the window size and input signal
domain.
55.00
65.00
75.00
85.00
0.8 1.6 3.2 6.4 9.6 12.8 16
Accuracy (%)
Window Size (s)
Raw FFT
35.00
55.00
75.00
95.00
0.8 1.6 3.2 6.4 9.6 12.8 16
Accuracy (%)
Window Size (s)
Raw FFT
A Comprehensive Analysis of Parkinson’s Disease Detection Through Inertial Signal Processing
467

case, we observed that for 3.2-second windows,
there exist significant difference between using Raw
data and FFT. This FFT approach using windows of
3.2 seconds from all sensors reaches a window-level
accuracy of 80.49 ± 0.57 % and a user-level
accuracy of 93.55 ± 8.65 % in a LOSO scenario.
5 CONCLUSIONS
A comprehensive analysis is required when
developing a deep learning system focused on PD
detection using inertial sensors in order to highlight
key factors to the refinement of tremor detection.
This work uses the PD-BioStampRC21 dataset
including healthy control and PD participants
wearing five inertial sensors to perform a
comprehensive study.
Ensuring an appropriate distribution of data is
crucial in PD detection to prevent data overlap
between training and testing subsets. The LOSO CV
technique emerges as a robust solution, effectively
mitigating the risk of data contamination and
enhancing the model generalizability.
The use of FFT magnitude coefficients, in
contrast to raw data samples, become helpful in
detecting PD, particularly due to the pronounced
visibility of tremor characteristics in the frequency
domain. We obtained a significant improvement of
performance when using FFT data (66.90 ± 0.96 %)
of 6.4-second windows and left anterior forearm
sensor compared to using directly Raw data (60.33 ±
1.0 %).
Incorporating multiple sensors located on the
chest and limbs in CNN architecture capable of
combining data exhibits the potential to increment
the overall PD detection performance (75.10 ± 0.88
% when using FFT 6.4-second windows).
An in-depth exploration of the optimal analysis
window size is imperative in enhancing the
performance of both window-level and user-level
evaluations. We observed that using 3.2-second
analysis windows provides a positive balance
between capturing intricate temporal patterns and
preventing mixing tremor events with motion not
associated to PD. This window size provided a
window-level accuracy of 80.49 ± 0.57 % and a
user-level accuracy of 93.55 ± 8.65 % in a LOSO
scenario using the frequency domain of the input
signals from all the sensors available in the dataset.
As future work, it would be possible to refine the
data analysis. Specifically, the selection of windows
with higher energy levels could aid in identifying
instances when tremors are more pronounced,
thereby improving the performance of PD detection.
In addition, the development of a robust regression
system capable of accurately estimating UPDRS
scores could offer valuable insights into disease
progression and facilitate more precise monitoring
of patients' motor symptoms. Moreover, it could be
possible to investigate the optimal duration for data
collection, beyond the current 16.13 minutes used in
this work, and study the effect of the posture while
collecting tremor data. Integrating these
advancements into the proposed system holds
substantial promise in advancing the field and
contributing to the development of more effective
diagnostic and monitoring tools for PD.
ACKNOWLEDGEMENTS
The work was supported by the project “TremorDetect -
Detección de la enfermedad de Parkinson a través de
señales inerciales”, funded by “Primeros Proyectos” call
from ETSIT, UPM, by projects AMIC-PoC (PDC2021-
120846-C42), GOMINOLA (PID2020-118112RB-C21
and PID2020-118112RB-C22) and BeWord (PID2021-
126061OB-C43), supported by the Spanish Ministry of
Science and Innovation (MCIN/AEI/10.13039/501
100011033) and by the European Union
“NextGenerationEU/PRTR”, and ASTOUND (101071191
HORIZON-EIC-2021-PATHFINDERCHALLENGES-01)
funded by the European Commission.
REFERENCES
Adams, J. L., Dinesh, K., Snyder, C. W., Xiong, M.,
Tarolli, C. G., Sharma, S., . . . Sharma, G. (2021). A
real-world study of wearable sensors in Parkinson’s
disease. npj Parkinson's Disease, 7(1), 106.
doi:10.1038/s41531-021-00248-w
Arora, S., Venkataraman, V., Zhan, A., Donohue, S.,
Biglan, K. M., Dorsey, E. R., & Little, M. A. (2015).
Detecting and monitoring the symptoms of Parkinson's
disease using smartphones: A pilot study.
Parkinsonism & Related Disorders, 21(6), 650-653.
doi:10.1016/j.parkreldis.2015.02.026
Channa, A., Ifrim, R.-C., Popescu, D., & Popescu, N.
(2021). A-WEAR Bracelet for Detection of Hand
Tremor and Bradykinesia in Parkinson's Patients.
Sensors, 21(3). doi:10.3390/s21030981
Cole, B. T., Roy, S. H., De Luca, C. J., Nawab, S. H., &
Ieee. (2010, 2010
Aug 30-Sep 04). Dynamic Neural Network Detection of
Tremor and Dyskinesia from Wearable Sensor Data.
Paper presented at the 32nd Annual International
Conference of the IEEE Engineering-in-Medicine-and-
Biology-Society (EMBC 10), Buenos Aires,
ARGENTINA.
ICAART 2024 - 16th International Conference on Agents and Artificial Intelligence
468

Dai, H., Zhang, P., & Lueth, T. C. (2015). Quantitative
Assessment of Parkinsonian Tremor Based on an
Inertial Measurement Unit. Sensors, 15(10), 25055-
25071. doi:10.3390/s151025055
Deuschl, G., Fietzek, U., Klebe, S., & Volkmann, J.
(2003). Chapter 24 Clinical neurophysiology and
pathophysiology of Parkinsonian tremor. In M. Hallett
(Ed.), Handbook of Clinical Neurophysiology (Vol. 1,
pp. 377-396): Elsevier.
Garcia-Magarino, I., Medrano, C., Plaza, I., & Olivan, B.
(2016). A smartphone-based system for detecting hand
tremors in unconstrained environments. Personal and
Ubiquitous Computing, 20(6), 959-971.
doi:10.1007/s00779-016-0956-2
Gil-Martin, M., Montero, J. M., & San-Segundo, R.
(2019). Parkinson's Disease Detection from Drawing
Movements Using Convolutional Neural Networks.
Electronics, 8(8), 10. doi:10.3390/electronics8080907
Gil-Martin, M., San-Segundo, R., Fernandez-Martinez, F.,
& Ferreiros-Lopez, J. (2020). Improving physical
activity recognition using a new deep learning
architecture and post-processing techniques.
Engineering Applications of Artificial Intelligence, 92.
doi:10.1016/j.engappai.2020.103679
Gil-Martin, M., San-Segundo, R., Fernandez-Martinez, F.,
& Ferreiros-Lopez, J. (2021). Time Analysis in
Human Activity Recognition. Neural Processing
Letters. doi:10.1007/s11063-021-10611-w
Gil-Martín, M., San-Segundo, R., Fernández-Martínez, F.,
& de Córdoba, R. (2020). Human activity recognition
adapted to the type of movement. Computers &
Electrical Engineering, 88, 106822. doi:https://doi.
org/10.1016/j.compeleceng.2020.106822
Hathaliya, J. J., Modi, H., Gupta, R., Tanwar, S., Sharma,
P., & Sharma, R. (2022). Parkinson and essential
tremor classification to identify the patient?s risk
based on tremor severity. Computers & Electrical
Engineering, 101. doi:10.1016/j.compeleceng.2022.
107946
Iakovakis, D., Mastoras, R. E., Hadjidimitriou, S.,
Charisis, V., Bostanjopoulou, S., Katsarou, Z., . . .
Ieee. (2020, 2020
Jul 20-24). Smartwatch-based Activity Analysis During
Sleep for Early Parkinson's Disease Detection. Paper
presented at the 42nd Annual International Conference
of the IEEE-Engineering-in-Medicine-and-Biology-
Society (EMBC), Montreal, CANADA.
Igene, L., Alim, A., Imtiaz, M. H., & Schuckers, S.
(2023). A Machine Learning Model for Early
Prediction of Parkinson's Disease from Wearable
Sensors. 2023 Ieee 13th Annual Computing and
Communication Workshop and Conference, Ccwc,
734-737. doi:10.1109/ccwc57344.2023.10099230
Jankovic, J. (2008). Parkinson’s disease: clinical features
and diagnosis. Journal of Neurology, Neurosurgery &
Psychiatry, 79(4), 368-376. doi:10.1136/jnnp.2007.
131045
Kubota, K. J., Chen, J. A., & Little, M. A. (2016).
Machine learning for large-scale wearable sensor data
in Parkinson's disease: Concepts, promises, pitfalls,
and futures. Movement Disorders, 31(9), 1314-1326.
doi:10.1002/mds.26693
Lang, M., Pfister, F. M. J., Frohner, J., Abedinpour, K.,
Pichler, D., Fietzek, U., . . . Hirche, S. (2019). A
Multi-Layer Gaussian Process for Motor Symptom
Estimation in People With Parkinson's Disease. Ieee
Transactions on Biomedical Engineering, 66(11),
3038-3049. doi:10.1109/tbme.2019.2900002
Rigas, G., Tzallas, A. T., Tsipouras, M. G., Bougia, P.,
Tripoliti, E. E., Baga, D., . . . Konitsiotis, S. (2012).
Assessment of Tremor Activity in the Parkinson's
Disease Using a Set of Wearable Sensors. Ieee
Transactions on Information Technology in
Biomedicine, 16(3), 478-487. doi:10.1109/titb.2011.
2182616
San-Segundo, R., Manuel Montero, J., Barra-Chicote, R.,
Fernandez, F., & Manuel Pardo, J. (2016). Feature
extraction from smartphone inertial signals for human
activity segmentation. Signal Processing, 120, 359-
372. doi:10.1016/j.sigpro.2015.09.029
San-Segundo, R., Navarro-Hellin, H., Torres-Sanchez, R.,
Hodgins, J., & De la Torre, F. (2019). Increasing
Robustness in the Detection of Freezing of Gait in
Parkinson's Disease. Electronics, 8(2). doi:10.
3390/electronics8020119
Vanrell, S. R., Milone, D. H., & Rufiner, H. L. (2018).
Assessment of Homomorphic Analysis for Human
Activity Recognition From Acceleration Signals. Ieee
Journal of Biomedical and Health Informatics, 22(4),
1001-1010. doi:10.1109/jbhi.2017.2722870
Zhang, S., Wei, Z., Nie, J., Huang, L., Wang, S., & Li, Z.
(2017). A Review on Human Activity Recognition
Using Vision-Based Method. Journal of Healthcare
Engineering, 2017. doi:10.1155/2017/3090343.
A Comprehensive Analysis of Parkinson’s Disease Detection Through Inertial Signal Processing
469
