
How Quality Affects Deep Neural Networks in Fine-Grained Image
Classification
Joseph Smith
1
, Zheming Zuo
1 a
, Jonathan Stonehouse
2
and Boguslaw Obara
1 b
1
School of Computing, Newcastle University, Newcastle upon Tyne, U.K.
2
Procter and Gamble, Reading, U.K.
Keywords:
Image Quality Assessment, Neural Networks, Fine-Grained Image Classification, Mobile Imaging.
Abstract:
In this paper, we propose a No-Reference Image Quality Assessment (NRIQA) guided cut-off point selection
(CPS) strategy to enhance the performance of a fine-grained classification system. Scores given by existing
NRIQA methods on the same image may vary and not be as independent of natural image augmentations as
expected, which weakens their connection and explainability to fine-grained image classification. Taking the
three most commonly adopted image augmentation configurations – cropping, rotating, and blurring – as the
entry point, we formulate a two-step mechanism for selecting the most discriminative subset from a given
image dataset by considering both the confidence of model predictions and the density distribution of image
qualities over several NRIQA methods. Concretely, the cut-off points yielded by those methods are aggre-
gated via majority voting to inform the process of image subset selection. The efficacy and efficiency of such
a mechanism have been confirmed by comparing the models being trained on high-quality images against
a combination of high- and low-quality ones, with a range of 0.7% to 4.2% improvement on a commercial
product dataset in terms of mean accuracy through four deep neural classifiers. The robustness of the mecha-
nism has been proven by the observations that all the selected high-quality images can work jointly with 70%
low-quality images with 1.3% of classification precision sacrificed when using ResNet34 in an ablation study.
1 INTRODUCTION
Convolutional Neural Networks (CNNs) are at the
centre of many fine-grained image classification sys-
tems (Sharif Razavian et al. (2014); Gupta et al.
(2021); Ha et al. (2022)) and have been shown to be
susceptible to low-quality images, particularly blur-
ring and noise, which can deteriorate the precision of
model prediction (Dodge and Karam (2016)). This is-
sue could be even more significant when dealing with
images from an uncontrolled environment, where the
qualities could vary considerably (Sabbatini et al.
(2021); Aqqa et al. (2019)).
Fine-grained image classification tasks are even
more vulnerable to low image quality than coarse-
grained tasks (Peng et al. (2016)). The former re-
lies more on high-frequency features e.g. texture, to
be successful, as opposed to low-frequency features,
including the colour of objects (Wang et al. (2023)).
Additionally, high-frequency features tend to vanish
a
https://orcid.org/0000-0003-1576-0865
b
https://orcid.org/0000-0003-4084-7778
in blurry or noisy images, leading to the model need-
ing adequate information for making a correct predic-
tion (Hsu and Chen (2022)).
Image Quality Assessment (IQA) methods are
commonly adopted to produce a score for an im-
age that approximates human perception (Ding et al.
(2020)). These methods can be divided into three cat-
egories: full-reference (Sara et al. (2019)), where a
score is generated given two images: the original im-
age and its distorted version; reduced-reference (Han
et al. (2016)), where a score is given based on partially
unseen information between the image pair, and no-
reference (NR) (Mittal et al. (2012)), where a score
is delivered for a lone image which has not been dis-
torted. In the context of image classification, NRIQA
tends to help explain the predictions given by the clas-
sification model (Xu et al. (2021)).
On one hand, scores of low-quality images can
be enhanced through super-resolution (Gankhuyag
et al. (2023)), deblurring and denoising (Zuo et al.
(2022)), dehazing and deraining (Yang et al. (2020))
etc. These methods help to remove or suppress the
low-quality features that can cause CNNs to struggle
448
Smith, J., Zuo, Z., Stonehouse, J. and Obara, B.
How Quality Affects Deep Neural Networks in Fine-Grained Image Classification.
DOI: 10.5220/0012359200003660
Paper published under CC license (CC BY-NC-ND 4.0)
In Proceedings of the 19th International Joint Conference on Computer Vision, Imaging and Computer Graphics Theory and Applications (VISIGRAPP 2024) - Volume 2: VISAPP, pages
448-457
ISBN: 978-989-758-679-8; ISSN: 2184-4321
Proceedings Copyright © 2024 by SCITEPRESS – Science and Technology Publications, Lda.

when classifying images (Dodge and Karam (2016)).
However, this is heavily dependent on the availability
of high-frequency features.
On the contrary, NRIQA can help alleviate the
problems caused by low-quality images by being used
either to screen images before being classified to guar-
antee the required quality has been satisfied or at the
point of training to ensure the dataset includes a range
of different quality images to create a robust model.
The former is only applicable in the situation where
the image can be retaken, but the latter can be ap-
plied in most if not all, fine-grained image classifica-
tion tasks (Varga (2022)).
Many NRIQA methods are usually flawed by cor-
relations with augmentation configurations indepen-
dent of image quality. These configurations include
image rotation, blurring, and cropping. Among many
fine-grained image classification tasks, it is a high de-
gree of difficulty to standardise images by these con-
figurations. Thus, a thorough selection process is
needed to select one or more NRIQA methods that
are independent of image rotation and image size.
The NRIQA methods have been largely investi-
gated with image focus (Pertuz et al. (2013)) and
distortions (Stepien and Oszust (2022)). Addition-
ally, low-quality images could deteriorate CNN test-
ing, where blurred images have the most negative
effect on classification models among several image
deenhancement methods (Dodge and Karam (2016)).
Wang et al. propose a flexible module that can
be plugged into different models to cope with low-
quality images and alleviate the difficulty when the
IQA justification criteria are not defined. Mean-
while, Zhai and Min survey current state-of-the-art
IQA methods, where the aforementioned image aug-
mentation configurations are not explored.
This work aims to discriminate between the outer
packaging of commercial products made by two man-
ufacturers in various environments with tiny differ-
ences; even domain experts struggle to distinguish
them in the region of interest of the outer packag-
ing. The challenging factors include varying lighting
conditions, camera motions, mobile phone types, etc,
resulting in a wide spectrum of image qualities. Con-
cretely, our contributions are summarised as follows:
1) We select an optimal set of NRIQA methods based
on their robustness to external image augmentations
and ability to score low-quality images correctly.
2) We propose a two-step mechanism to select the
most discriminant subset of a given dataset to improve
fine-grained image classification performance by con-
necting NRIQA methods and model confidence.
3 We show that a selected training set of high-
quality images leads to competitive classification per-
formance with an acceptable degree of space and time
complexity.
4) We adopt a varying percentage of low-quality im-
ages to demonstrate how the training set’s quality
should reflect the testing set’s quality.
The rest of the paper is organised as follows. Sec-
tion 2 details the materials required to construct our
framework in Section 3. Experimental results and dis-
cussions are presented in Section 4. Section 5 sum-
marises the work with future directions pointed out.
2 MATERIALS
2.1 Datasets
A total of three datasets are adopted in this work.
All the datasets contain similar patterns of images
but with no intersections. This means we can tune
the NRIQA-guided CPS process to solve our problem
without over-fitting the system to our dataset. Infor-
mation about the datasets follows:
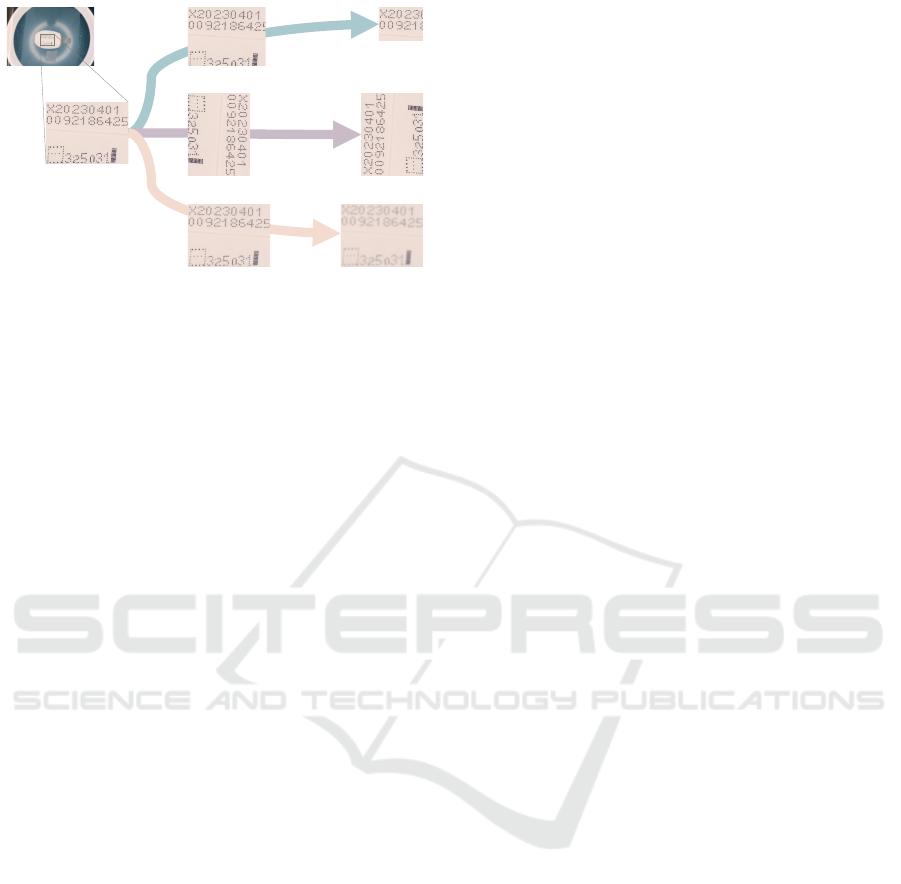
Dataset 1 contains 140 images of printed codes
of the bottom of the outer packaging of commercial
products, each with a resolution of 1024 × 1024 pix-
els. These 140 images are of 14 distinct samples, each
photographed ten times. The camera that took the
photos was first correctly focused on the image and
then deliberately moved out of focus by a set incre-
ment nine times by adjusting the camera’s ISO set-
ting. This created ten images of the same sample but
with gradually worse quality. The images were then
cropped around the printed code, similarly to how
they would be in the classification model. This dataset
will be used to test the effectiveness of the NRIQA
methods. Figure 1 shows images of varying augmen-
tation methods.
Dataset 2 includes 700 images of the bottoms of
the outer packaging of commercial products, each
with a resolution of 1024 × 1024 pixels and tightly
cropped around a printed dot matrix code. The class
labels of the images refer to which manufacturer
made the outer packaging of the commercial prod-
uct. Dataset 2 is used to find the cut-off point in im-
age quality where the classification model struggles
to work effectively, as depicted in the two-step mech-
anism for subset selection within Figure 2.
Dataset 3 contains 2800 RGB images of the bot-
tom of the outer packaging of commercial products
with the same settings as Dataset 2. Dataset 3 is tem-
porally consecutive to Dataset 2. These two datasets
are independent and do not contain any identical im-
ages. Dataset 3 is used to train new models to evaluate
the two-step discrimination mechanism.
How Quality Affects Deep Neural Networks in Fine-Grained Image Classification
449
…
…
…
…
(a)
(b)
(c)
Figure 1: A raw sample of the underside of a commercial
product in Dataset 1, with printed codes shown on the bot-
tom of the bottle, is to be progressively processed through
three typical image augmentation configurations: (a) crop-
ping, (b) rotating and (c) blurring.
One of the clear images from Dataset 1 has been
rotated by 15° increments to create six images ranging
from the cross being rotated 0° to 75°. This has been
done to test the robustness of the NRIQA methods to
rotation in images.
One of the clear images from Dataset 1 has been
cropped from the bottom and the right incrementally
to create images of different resolutions, which should
be of the same quality. The images were cropped by
1/20th of the original images’ height and width each
time, nine times over, to create ten different images.
The smallest image is 1/4 of the resolution of the orig-
inal image. This was done to test the robustness of
each NRIQA method to image resolution.
2.2 Image Quality Assessment Methods
Statistical Based NRIQA Methods Variance of
the Laplacian (LAPV). The Laplace filter is com-
monly employed for edge detection in images. The
quality of an image can be measured by taking the
Laplacian variance of the image (Pech-Pacheco et al.
(2000)).
Modified Laplacian (LAPM). Nayar and Nakagawa
suggested a focus measure based on an alternative
definition of Laplacian, which can be used as an
NRIQA.
Sum of the Wavelet Coefficients (WAVS). Discrete
Wavelet Transform (DWT) of an image could be help-
ful where, in its first level, the image is decomposed
into four sub-images. Yang and Nelson calculated the
corresponding horizontal, vertical, and diagonal coef-
ficients.
BRISQUE. Mittal et al. propose a
Blind/Referenceless Image Spatial Quality Eval-
uator (BRISQUE) using natural scene statistics
(NSS) in the spatial domain (Mittal et al. (2012)).
NSS is designed to quantify losses of “naturalness”
in images.
NIQE. Mittal et al. developed on BRISQUE (Mit-
tal et al. (2012)) to create a Natural Image Quality
Evaluator (NIQE) (Mittal et al. (2013)). NIQE used
the same NSS as BRISQUE, but instead of basing re-
sults on the features of distorted images or images
perceived as low-quality by human perception, NIQE
uses measurable deviations from statistical regulari-
ties observed in natural images.
Deep Learning Based NRIQA Methods
MUSIQ. Ke et al. propose a MUltiScale Image Qual-
ity transformer (MUSIQ) to calculate a quality score
for an image (Ke et al. (2021)). MUSIQ is pretrained
on ImageNet and then fine-tuned for use on large-
scale image quality datasets (Ying et al. (2020), Fang
et al. (2020), Hosu et al. (2020)). MUSIQ does not
require a fixed shape; thus, less image augmentation
may lead to a more significant change in image qual-
ity.
MANIQA. Yang et al. presented a Multidimen-
sional Attention Network for No-Reference Image
Quality assessment (MANIQA) (Yang et al. (2022)).
MANIQA is different from MUSIQ as it works on
GAN-based distortion images merely. MANIQA is
pretrained on the PIPAL dataset (Gu et al. (2020)) that
contains a mixture of natural and GAN-based images.
HyperIQA. Su et al. adopted hypernetworks based
solely on images with naturally occurring distortion
(Su et al. (2020)). Experimental results indicate that
it performs well for natural and synthetic distortions.
The model is pretrained on KonIQ-10k (Hosu et al.
(2020)).
2.3 Deep Neural Classifiers
We employ a ResNet34 model (He et al. (2016))
trained on a dataset of 3090 RGB images of the bot-
tom of the outer packaging of commercial products
(Jackson et al. (2021)) as the baseline model for this
work. We adopt the Adam optimiser for model train-
ing, a learning rate of 10
−4
, a weight decay of 0,
and the categorical cross-entropy loss function. This
model is used for finding the cut-off point for accept-
able image quality by looking at the model’s confi-
dence for the images in Dataset 2.
We also utilise pretrained models of AlexNet
(Krizhevsky et al. (2012)), ResNet18, ResNet34 (He
et al. (2016)), and VGG19 (Simonyan and Zisser-
man (2015)) to evaluate the effect image quality has
on training. The models are pretrained on ImageNet
(Deng et al. (2009)).
VISAPP 2024 - 19th International Conference on Computer Vision Theory and Applications
450

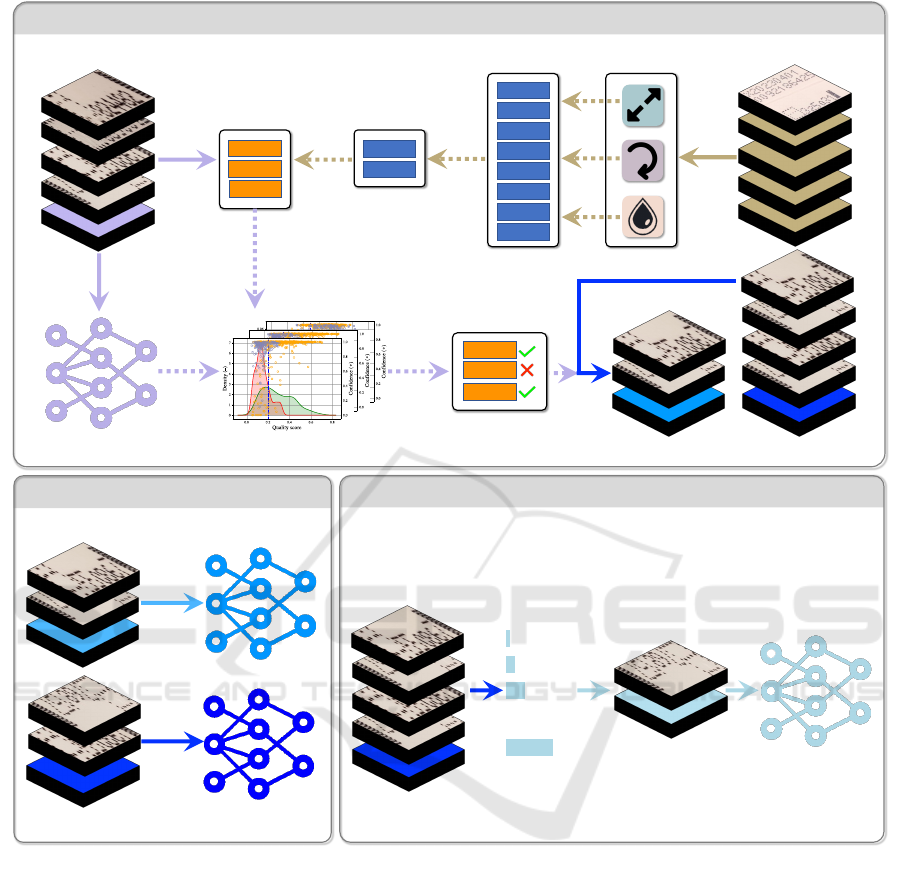
3 METHODS
In this section, we detail the framework of the
NRIQA-guided CPS process of image quality within
a dataset of images depicted in Figure 2. Specifically,
the correlation metrics used to evaluate the effective-
ness and robustness of the NRIQA methods are de-
tailed in Section 3.1.1. This is depicted in the top row
of the top box of Figure 2. Section 3.1.2 details how
we decide the values for the cut-off points of the NR-
IQA methods for image quality as pictured on the bot-
tom row of the top box in Figure 2. Section 3.2 de-
tails how we used training sets made up of only high-
quality images and mixed-quality images to show
how the accuracy of a model is affected by the qual-
ity of its training set. This is drawn in the bottom left
box of Figure 2. Our further experiments with vary-
ing quality are detailed in Section 3.3, revealing how
we employed various low-quality images in the train-
ing set to find the optimal mix of low and high-quality
images. This is visualised in the bottom right box of
Figure 2.
3.1 NRIQA-Guided CPS Strategy
3.1.1 Correlation Metrics of NRIQA Methods
Given the qualities of images measured by several as-
sessment metrics detailed in Section 2.2, we then, as
depicted in the upper of Figure 2, determine the qual-
ified NRIQA metrics through correlation analysis.
Pearson Correlation Coefficient (PCC). measures
the degree of relationship between a pair of variables
(Adler and Parmryd (2010)). It helps to explain the
correlations in the results of our experiments. Specif-
ically, PCC is calculated by:
PCC(I
idx
, I
qvc
) =
COV (I
idx
, I
qvc
)
SD(I
idx
) ∗ SD(I
qvc
)
, (1)
where I
idx
denotes the index of the image and I
qvc
rep-
resents the image quality score, COV (·, ·) and SD(·)
correspond to covariance and standard deviation, re-
spectively.
Spearman Rank Correlation Coefficient (SRCC).
reveals the correlation of the order of results rather
than the value of the results (Lyerly (1952)). SRCC is
calculated as follows:
SRCC(I
idx
, I
qvc
) = PCC(rank(I
idx
), rank(I
qvc
)), (2)
where rank(·) denotes the operation of ordering the
results from smallest to largest.
It is a common choice to adopt both PCC and
SRCC in practice (Cheng et al. (2021)), as the for-
mer gives a general idea of the gradient of the rela-
tionship between the image index in the dataset and
its corresponding quality score. In contrast, the latter
indicates which methods correlate strongly with the
order of images, e.g. the clearest image to the blurri-
est image.
To evaluate the robustness and efficiency of the
NRIQA set, images from each of the augmentations
of Dataset 1 are run through the eight quality metrics.
The SRCC and the PCC are calculated from the av-
eraged quality scores to show the correlation between
image augmentation configurations and the NRIQA
scores produced. Experimental setups are detailed be-
low.
The progressively cropped images from Dataset 1
justify the robustness of each NRIQA method to im-
age rotation. A surviving NRIQA method exhibits
a low correlation between returned scores and image
resolution. Similarly, the rotated images assess each
NRIQA method’s robustness to rotation, whereas sur-
viving methods display a low correlation between
scores and image rotation. Lastly, the clear-to-blurry
images from Dataset 1 gauge the effectiveness of each
NRIQA method in scoring blurry images. A surviv-
ing NRIQA method should exhibit a high correlation
between image blurriness and scores, reflecting score-
quality alignment. Correlation coefficients will be av-
eraged across 14 samples.
The above results will inform which NRIQA
methods should be selected to restrict low-quality im-
ages from being used in the classification system.
When multiple methods are chosen, the common ma-
jority voting methods will be triggered, e.g. if the ma-
jority of methods produce low scores, the image will
be deemed “blurry” and will not be used.
3.1.2 Cut-Off Point Determination for Subset
Selection
To validate the correlation between image quality and
the accuracy of a fine-grained classification model,
the confidence of a pretrained ResNet34 is compared
to the image quality scores generated by the NRIQA
methods. A high, positive correlation between confi-
dence and image quality suggests that the model does
struggle with lower-quality images, as suspected. To
this end, we run the entirety of Dataset 2 through the
current model and check the confidence and image
quality values produced.
The cut-off points for each NRIQA method are
determined by looking at the image quality distribu-
tion over correct and incorrect predictions. By cal-
culating the Kernel Density Estimation (KDE) (Chen
and Meer (2002)) of the distributions, we can observe
where the two curves cross and use this as a sensible
value to restrict lower-quality images.
This value should represent the point at which the im-
How Quality Affects Deep Neural Networks in Fine-Grained Image Classification
451
Dataset 1
Dataset 2
Dataset 3
Majority Voting
LAPM
WAVS
MUSIQ
LAPV
LAPM
WAVS
BRISQUE
NIQE
MUSIQ
MANIQA
HyperIQA
PCC
SRCC
LAPM
WAVS
averaged
select
NRIQA
Method
Augmentation
Configuration
Correlation
Analysis
Qualified
NRIQA Subset
MUSIQ
Dataset 2
quality
Trai ned Model
model
confidence
Confidence and Quality of Correct
and Incorrect Predictions
High-quality Subset of
Dataset 3
High-quality Subset of
Dataset 3
Randomly Selected All
Quality Samples of Dataset 3
training
Percentage of
Low-Quality
Images
Removed
…
training
NRIQA-Guided CPS Strategy
training
High- v.s. All-Quality
Varying Quality Analysis
…
Dataset 3
0%
10%
20%
50%
Var yin g Quality Samples
of Dataset 3
…
Figure 2: Overall framework of the proposed two-step mechanism of high-quality image subset selection of the image dataset
for improved fine-grained image classification. The upper row depicts the process of seeking the most appropriate subset of
NRIQA methods specified in Section 2.2 and the majority voting procedure of selecting high-quality images from a given
dataset specified in Section 3.1.2. The bottom left box denotes how we used training sets made up of only high-quality and
mixed-quality images to show how the accuracy of a model is affected by the quality of its training set in Section 3.2. The
bottom right box denotes how we employed a varying amount of low-quality images in the training set to find the optimal mix
of low and high-quality images in Section 3.3.
age is too blurry for the model to classify the image
reliably.
3.2 High- v.s. All-Quality
To assess the model’s performance on high-quality
images, we utilised the specified NRIQA thresholds
to form a subset of Dataset 3. This subset exclu-
sively contained high-quality images. 10% were des-
ignated for testing, 10% for evaluation, and the rest
for training a manufacturer classification model based
on outer packaging of commercial products under-
side images. Four model architectures were used
(AlexNet, ResNet18, ResNet34, and VGG19). The
mean and standard deviation of five runs are evalu-
ated.
To compare the aforementioned model with one
trained on diverse image quality, another model was
trained for the same task but using images across all
the quality levels. Random images were selected from
VISAPP 2024 - 19th International Conference on Computer Vision Theory and Applications
452

Table 1: Average correlation coefficients for image augmentation configurations. Bold values show the most desirable result
in each row. ↓ denotes where a lower correlation is favourable, whereas the ↑ indicates where a higher correlation is preferable.
Augumentation
Configuration
Correlation
Metric
NRIQA Method
LAPV LAPM WAVS BRISQUE NIQE MUSIQ MANIQA HyperIQA
cropping
PCC↓ 0.337 0.322 0.345 0.599 0.774 0.954 0.937 0.150
SRCC↓ 0.358 0.152 0.164 0.406 0.969 0.952 0.927 0.333
rotating
PCC↓ 0.406 0.570 0.050 0.336 0.279 0.316 0.062 0.133
SRCC↓ 0.486 0.486 0.086 0.200 0.200 0.143 0.200 0.314
blurring
PCC↑ 0.770 0.878 0.845 0.855 0.053 0.907 0.695 0.169
SRCC↑ 1.000 0.996 0.973 0.965 0.165 0.885 0.626 0.194
Dataset 3 to match the high-quality image subset’s
size. This approach ensured fairness by avoiding any
subset advantage through data volume discrepancy.
All trained models undergo testing using the high-
quality test set. This comparison will reveal the su-
perior model for high-quality image classification.
As future image acquisition will be limited to high-
quality images, this approach accurately assesses each
model’s effectiveness.
3.3 Varying Quality Analysis
A varying range of image qualities was incorporated
to review how the model’s accuracy changes as the
quality of the images increases or decreases. A ran-
dom subset of Dataset 3 was selected. Different per-
centages ranging from 0% to 50% of the lowest qual-
ity images in the subset were removed to create mul-
tiple subsets of various ranges of quality. The number
of images in each subset was standardised by select-
ing a larger original subset depending on the number
of images removed. A ResNet34 model was trained
five times on each subset and tested on the high-
quality testing set from the experiment above. The
model was trained using the same configuration as in
Section 3.2. The averages and standard deviations for
the five runs were evaluated in Section 4.4.
4 RESULTS
4.1 NRIQA Method Assessments
Table 1 summarises the correlation coefficients of
PCC and SRCC over the averaged scores of each
NRIQA method, where the preferable PCC and
SRCC are marked in bold.
4.1.1 Cropped Images
From the results reported, the LAPM and HyperIQA
had the lowest correlation with the image resolutions
and, thus, are the most robust methods to image crop-
ping. In contrast, NIQE, MANIQA, and MUSIQ are
relatively less robust models for image cropping.
4.1.2 Rotated Images
As for the results reported for image rotation in Table
1, WAVS had the lowest correlation to rotation and is
more robust compared against the rest of the NRIQA
methods to image rotation.
4.1.3 Blurred Images
Regarding image blurring, LAPV and MUSIQ had
the highest correlation between the NRIQA score and
the intentional defocus of the image. Deep learning-
based methods, other than MUSIQ, had lower correla-
tions. This is due to the images of the outer packaging
of commercial products being markedly distinct from
the images the models were pretrained on.
From there, we determined to use a combination
of the LAPM, WAVS, and MUSIQ in a voting system
for the remaining experiments.
4.2 Cut-Off Point Determination for
Subset Selection
After running the whole of Dataset 3 through the clas-
sification model, the model achieved 95% accuracy.
Figure 3 depicts the confidence of the classification
model against the quality scores generated for the
image for each of the NRIQA methods. All three
graphs show a clear, strong correlation between the
confidence of the classification model and the qual-
ity scores generated by the NRIQA methods. Most
misclassifications happen within the lower half of im-
age quality for all three NRIQA methods. This shows
How Quality Affects Deep Neural Networks in Fine-Grained Image Classification
453
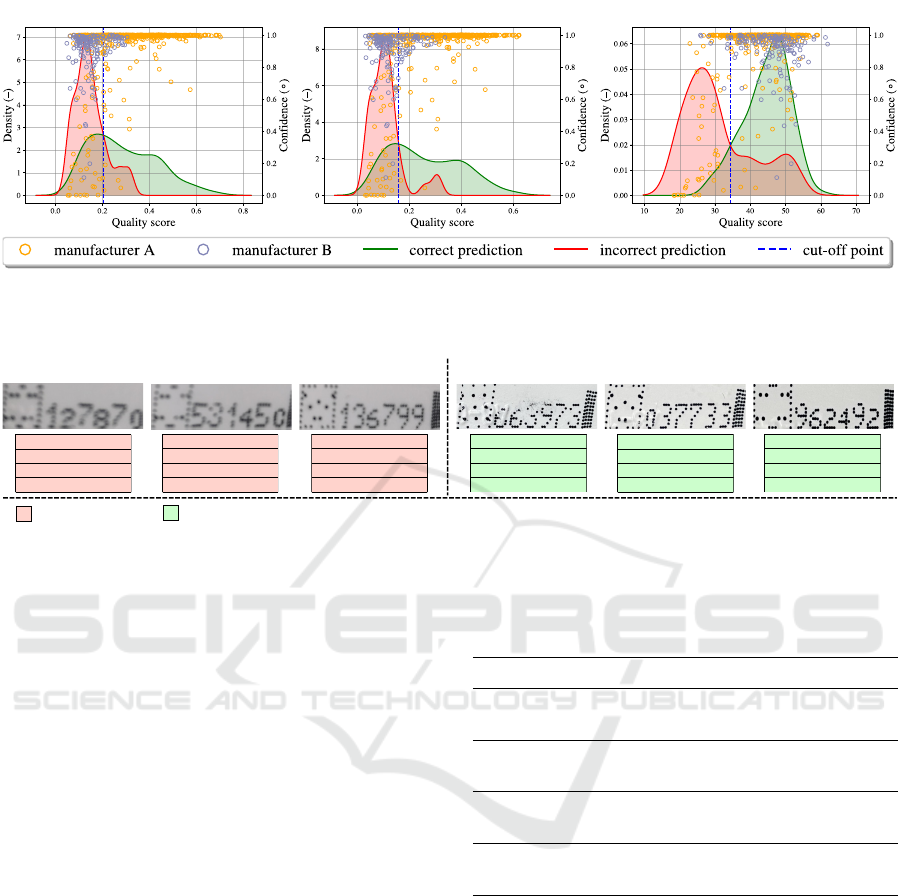
LAPM WAVS MUSIQ
Figure 3: The scatter plots reveal the relationship between the image-wise quality score in the x-axis and the prediction
confidence of the pretrained classification model in the y-axis for images in Dataset 2, as well as the corresponding density
distribution of correct/incorrect predictions.
Low-quality and Low-confidence High-quality and High-confidence
correct prediction
incorrect prediction
confidence: 0.00001847
LAPM: 0.053
WAVS: 0.037
MUSIQ: 18.4
confidence: 0.000496983
LAPM: 0.059
WAVS: 0.032
MUSIQ: 20.5
confidence: 0.091158986
LAPM: 0.06
WAVS: 0.044
MUSIQ: 22.2
confidence: 0.997436849
LAPM: 0.585
WAVS: 0.62
MUSIQ: 55.4
confidence: 0.99878611
LAPM: 0.698
WAVS: 0.621
MUSIQ: 51.3
confidence: 0.999668942
LAPM: 0.687
WAVS: 0.622
MUSIQ: 50.9
Figure 4: Explanations of the model predictions on low- and high-quality testing images.
that image quality strongly affects the classification
model’s ability to classify images accurately.
Cut-off points for each of the three surviving
methods were suggested by looking at the quality
of images where the classification confidence drops
and the model starts to misclassify images. Fig-
ure 3 reveals the KDEs of image quality for correct
and incorrect classifications for each of the selected
NRIQA methods. Specifically, the cut-off points set
were 0.206 for LAPM, 0.159 for WAVS, and 34.4 for
MUSIQ. These values are used in the voting system to
determine whether an image is to be selected. Then,
the voting system will reject the image if it produces
low-quality scores for at least two of the three surviv-
ing NRIQA methods; in line with Figure 4.
4.3 High v.s. All-Quality
Table 2 reports the average testing accuracies of the
models trained on high-quality and all-quality images.
All models were tested on a data set of only high-
quality data from Dataset 3 unseen to the models, as
these will be the most similar images to what the sys-
tem will be employed on in an uncontrolled environ-
ment once the quality thresholds are implemented.
In all cases, the models trained on only high-
quality images outperformed the models trained on
the full range of image quality. The architecture with
the highest difference in accuracy between high and
Table 2: Testing results for models trained on high- and all-
quality images in five runs with optimal accuracy marked in
bold. Each model is trained on 1293 images with 40 epochs.
Model Quality Accuracy (%) AUC (%)
AlexNet
High-quality 79.3±3.3 96.1±1.6
All-quality 78.4±4.2 96.6±1.9
VGG19
High-quality 83.3±4.2 96.3±1.5
All-quality 82.6±6.7 95.2±2.0
ResNet18
High-quality 86.6±2.0 94.4±1.0
All-quality 85.1±2.9 94.7±0.5
ResNet34
High-quality 85.4±3.1 94.8±1.2
All-quality 81.2±2.1 93.2±1.3
all-quality images was ResNet34, which had an av-
erage accuracy of 85.4% when trained on only high-
quality images, compared to 81.2% when trained on
the full range of image quality. This is only a small in-
crease of 4.2%, but when factored into a large system,
this is an incremental step towards better accuracy.
4.4 Varying Quality Analysis
Table 3 reports the results for the experiment de-
scribed in Section 3.3. The results indicate that the
accuracy of the model increases as the percentage
of removed images approaches 30% and then drops
slightly and levels off afterwards.
VISAPP 2024 - 19th International Conference on Computer Vision Theory and Applications
454

Table 3: Averaged results of ResNet34 trained on various
combinations of high- and low-quality images for five runs
with the optimal accuracy marked in bold. Each model is
trained on 1293 images with 40 epochs.
Percent Removed (%) Accuracy (%) AUC (%)
0 81.5±4.4 96.9±1.7
10 82.0±2.6 96.7±1.1
20 81.9±5.1 95.4±0.8
30 84.1±3.5 96.8±1.5
40 82.4±3.2 95.1±2.6
50 82.6±4.5 94.5±2.4
This might be caused by the quality of the train-
ing set at 30% removed being the most representative
of the testing set. This shows the importance of hav-
ing a training set that is reflective of the data from
an uncontrolled environment and that using images in
training of lower quality than expected in the uncon-
trolled environment does not improve the accuracy of
the model.
4.5 Discussions
From our investigation, WAVS, LAPM, and MUSIQ
are the most effective NRIQA methods with the
smallest degree of correlation to image rotation or
cropping. We observe that using a combination of
these methods in a voting system allows them to com-
pensate for each other’s weaknesses, i.e. MUSIQ
correlating image resolution while otherwise being a
very effective NRIQA method.
We evaluated our chosen NRIQA methods and
looked at the correlation between image quality and
fine-grained classification accuracy by examining the
existing model’s confidence in images of different
quality scores. We found a strong correlation be-
tween image quality scores and the models’ confi-
dence in correct classifications across all three se-
lected NRIQA methods. This backs up our hypoth-
esis that low image quality does reduce a fine-grained
image classification model’s ability to classify images
accurately.
We then looked at how image quality affects
model training. The results show that a model trained
exclusively on high-quality performs better at clas-
sifying high-quality images than a model trained on
the full range of image quality. This is useful as it
helps direct how we augment data for a task with a
guaranteed range of quality. The results suggest that
augmenting images using blurring past the guaranteed
range of image quality may not be useful as a pre-
processing step in training.
We found that a mixture of low- and high-quality
images can be used as long as 30% of the lowest-
quality images are removed. This is useful as it helps
validate the CPS strategy. A similar process could
also be used in other problems to help find the optimal
subset of images for training within a given dataset.
5 CONCLUSIONS
In this paper, we propose a two-step mechanism to
inform the process of selecting the high-quality sub-
set of a given dataset by taking both the density
distribution of averaged quality scores of qualified
NRIQA methods and the prediction confidence of a
deep neural network into consideration. The mod-
els trained on the high-quality images outperform the
ones trained on both high- and low-quality images.
Additionally, the high-quality selected using the pro-
posed framework has been proven to be compatible
with partial low-quality ones with acceptable classifi-
cation accuracy achieved. Though competitive results
have been obtained, investigations of the proposed
two-step mechanism on larger-scale datasets could be
treated as active future work.
REFERENCES
Adler, J. and Parmryd, I. (2010). Quantifying colocaliza-
tion by correlation: the pearson correlation coefficient
is superior to the mander’s overlap coefficient. Cytom-
etry Part A, 77(8):733–742.
Aqqa, M., Mantini, P., and Shah, S. K. (2019). Understand-
ing how video quality affects object detection algo-
rithms. In International Conference on Computer Vi-
sion Theory and Applications, pages 96–104.
Chen, H. and Meer, P. (2002). Robust computer vision
through kernel density estimation. In European Con-
ference on Computer Vision, pages 236–250.
Cheng, J., Liu, Z., Guan, H., Wu, Z., Zhu, H., Jiang, J.,
Wen, W., Tao, D., and Liu, T. (2021). Brain age esti-
mation from MRI using cascade networks with rank-
ing loss. IEEE Transactions on Medical Imaging,
40(12):3400–3412.
Deng, J., Dong, W., Socher, R., Li, L.-J., Li, K., and Fei-
Fei, L. (2009). Imagenet: A large-scale hierarchical
image database. In IEEE Conference on Computer
Vision and Pattern Recognition, pages 248–255.
Ding, K., Ma, K., Wang, S., and Simoncelli, E. P. (2020).
Image quality assessment: Unifying structure and tex-
ture similarity. IEEE Transactions on Pattern Analysis
and Machine Intelligence, 44(5):2567–2581.
Dodge, S. F. and Karam, L. (2016). Understanding how
image quality affects deep neural networks. In Inter-
national Conference on Quality of Multimedia Expe-
rience, pages 1–6.
How Quality Affects Deep Neural Networks in Fine-Grained Image Classification
455

Fang, Y., Zhu, H., Zeng, Y., Ma, K., and Wang, Z. (2020).
Perceptual quality assessment of smartphone photog-
raphy. In IEEE Conference on Computer Vision and
Pattern Recognition, pages 3674–3683.
Gankhuyag, G., Yoon, K., Park, J., Son, H. S., and Min, K.
(2023). Lightweight real-time image super-resolution
network for 4k images. In IEEE Conference on Com-
puter Vision and Pattern Recognition, pages 1746–
1755.
Gu, J., Cai, H., Chen, H., Ye, X., Ren, J., and Dong, C.
(2020). Pipal: a large-scale image quality assessment
dataset for perceptual image restoration. In European
Conference on Computer Vision, pages 633–651.
Gupta, A., Anpalagan, A., Guan, L., and Khwaja, A. S.
(2021). Deep learning for object detection and scene
perception in self-driving cars: Survey, challenges,
and open issues. Array, 10:100057.
Ha, Y., Du, Z., and Tian, J. (2022). Fine-grained in-
teractive attention learning for semi-supervised white
blood cell classification. Biomedical Signal Process-
ing and Control, 75:103611.
Han, Z., Zhai, G., Liu, Y., Gu, K., and Zhang, X. (2016).
A reduced-reference quality assessment scheme for
blurred images. In IEEE Visual Communications and
Image Processing, pages 1–4.
He, K., Zhang, X., Ren, S., and Sun, J. (2016). Deep
residual learning for image recognition. In IEEE Con-
ference on Computer Vision and Pattern Recognition,
pages 770–778.
Hosu, V., Lin, H., Sziranyi, T., and Saupe, D. (2020).
KonIQ-10k: An ecologically valid database for deep
learning of blind image quality assessment. IEEE
Transactions on Image Processing, 29:4041–4056.
Hsu, W.-Y. and Chen, P.-C. (2022). Pedestrian detec-
tion using stationary wavelet dilated residual super-
resolution. IEEE Transactions on Instrumentation and
Measurement, 71:1–11.
Jackson, P. T., Bonner, S., Jia, N., Holder, C., Stonehouse,
J., and Obara, B. (2021). Camera bias in a fine grained
classification task. In IEEE International Joint Con-
ference on Neural Networks, pages 1–8.
Ke, J., Wang, Q., Wang, Y., Milanfar, P., and Yang, F.
(2021). MUSIQ: Multi-scale smage suality trans-
former. In IEEE International Conference on Com-
puter Vision, pages 5128–5137.
Krizhevsky, A., Sutskever, I., and Hinton, G. E. (2012). Im-
agenet classification with deep convolutional neural
networks. In Advances in Neural Information Pro-
cessing Systems, pages 1106–1114.
Lyerly, S. B. (1952). The average spearman rank correlation
coefficient. Psychometrika, 17(4):421–428.
Mittal, A., Moorthy, A. K., and Bovik, A. C. (2012).
No-reference image quality assessment in the spatial
domain. IEEE Transactions on Image Processing,
21:4695–4708.
Mittal, A., Soundararajan, R., and Bovik, A. C. (2013).
Making a “completely blind” image quality analyzer.
IEEE Signal Processing Letters, 20(3):209–212.
Nayar, S. K. and Nakagawa, Y. (1994). Shape from focus.
IEEE Transactions on Pattern Analysis and Machine
Intelligence, 16(8):824–831.
Pech-Pacheco, J., Cristobal, G., Chamorro-Martinez, J., and
Fernandez-Valdivia, J. (2000). Diatom autofocusing
in brightfield microscopy: a comparative study. In In-
ternational Conference on Pattern Recognition, pages
314–317.
Peng, X., Hoffman, J., Stella, X. Y., and Saenko, K. (2016).
Fine-to-coarse knowledge transfer for low-res image
classification. In IEEE International Conference on
Image Processing, pages 3683–3687.
Pertuz, S., Puig, D., and Garcia, M. A. (2013). Analysis of
focus measure operators for shape-from-focus. Pat-
tern Recognition, 46(5):1415–1432.
Sabbatini, L., Palma, L., Belli, A., Sini, F., and Pierleoni, P.
(2021). A computer vision system for staff gauge in
river flood monitoring. Inventions, 6(4):79.
Sara, U., Akter, M., and Uddin, M. S. (2019). Image quality
assessment through FSIM, SSIM, MSE and PSNR—a
comparative study. Journal of Computer and Commu-
nications, 7(3):8–18.
Sharif Razavian, A., Azizpour, H., Sullivan, J., and Carls-
son, S. (2014). Cnn features off-the-shelf: an astound-
ing baseline for recognition. In IEEE Conference on
Computer Vision and Pattern Recognition workshops,
pages 806–813.
Simonyan, K. and Zisserman, A. (2015). Very deep con-
volutional networks for large-scale image recognition.
In International Conference on Learning Representa-
tions, pages 1–14.
Stepien, I. and Oszust, M. (2022). A brief survey on
no-reference image quality assessment methods for
magnetic resonance images. Journal of Imaging,
8(6):160–178.
Su, S., Yan, Q., Zhu, Y., Zhang, C., Ge, X., Sun, J., and
Zhang, Y. (2020). Blindly assess image quality in the
wild guided by a self-adaptive hyper network. In IEEE
Conference on Computer Vision and Pattern Recogni-
tion, pages 3664–3673.
Varga, D. (2022). No-reference image quality assessment
with convolutional neural networks and decision fu-
sion. Applied Sciences, 12(1):101–118.
Wang, M., Zhao, P., Lu, X., Min, F., and Wang, X.
(2023). Fine-grained visual categorization: A spatial–
frequency feature fusion perspective. IEEE Transac-
tions on Circuits and Systems for Video Technology,
33(6):2798–2812.
Wang, Y., Cao, Y., Zha, Z.-J., Zhang, J., and Xiong, Z.
(2020). Deep degradation prior for low-quality im-
age classification. In IEEE Conference on Computer
Vision and Pattern Recognition, pages 11049–11058.
Xu, Y., Wei, M., and Kamruzzaman, M. (2021). Inter/intra-
category discriminative features for aerial image clas-
sification: A quality-aware selection model. Future
Generation Computer Systems, 119:77–83.
Yang, G. and Nelson, B. J. (2003). Wavelet-based autofo-
cusing and unsupervised segmentation of microscopic
images. In IEEE/RSJ International Conference on In-
telligent Robots and Systems, volume 3, pages 2143–
2148.
VISAPP 2024 - 19th International Conference on Computer Vision Theory and Applications
456

Yang, S., Wu, T., Shi, S., Lao, S., Gong, Y., Cao, M., Wang,
J., and Yang, Y. (2022). MANIQA: Multi-dimension
attention network for no-reference image quality as-
sessment. In IEEE Conference on Computer Vision
and Pattern Recognition, pages 1191–1200.
Yang, W., Yuan, Y., Ren, W., Liu, J., Scheirer, W. J., Wang,
Z., Zhang, T., Zhong, Q., Xie, D., Pu, S., et al. (2020).
Advancing image understanding in poor visibility en-
vironments: A collective benchmark study. IEEE
Transactions on Image Processing, 29:5737–5752.
Ying, Z., Niu, H., Gupta, P., Mahajan, D., Ghadiyaram, D.,
and Bovik, A. (2020). From patches to pictures (PaQ-
2-PiQ): Mapping the perceptual space of picture qual-
ity. In IEEE Conference on Computer Vision and Pat-
tern Recognition, pages 3575–3585.
Zhai, G. and Min, X. (2020). Perceptual image quality as-
sessment: a survey. Science China Information Sci-
ences, 63:1–52.
Zuo, Z., Chen, X., Xu, H., Li, J., Liao, W., Yang, Z.-X.,
and Wang, S. (2022). Idea-net: Adaptive dual self-
attention network for single image denoising. In IEEE
Winter Conference on Applications of Computer Vi-
sion, pages 739–748.
How Quality Affects Deep Neural Networks in Fine-Grained Image Classification
457
