
Modeling Intestinal Glucose Absorption from D-Xylose Data
Danilo Dursoniah
1 a
, Maxime Folschette
1 b
, Rebecca Goutchtat
2
, Violeta Raverdy
2
,
Franc¸ois Pattou
2
and C
´
edric Lhoussaine
1 c
1
Univ. Lille, CNRS, Centrale Lille, UMR 9189 CRIStAL, F-59000 Lille, France
2
Univ. Lille, Inserm, CHU Lille, U1190 - EGID,F-59000 Lille, France
danilo.dursoniah@univ-lille.fr, maxime.folschette@centrale-lille.fr, rebecca.goutchtat@inserm.fr,
{violeta.raverdy, francois.pattou, cedric.lhoussaine}@univ-lille.fr
Keywords:
Systems Biology, Diabetes, Parameters Estimation, Practical Identifiability, Sensitivity Analysis.
Abstract:
Type 2 Diabetes (T2D) is one of the main epidemics of this century. One of the hypothesis of medical research
is that an important cause of T2D may be the abnormal regulation of intestinal glucose absorption (IGA). Early
detection of IGA disorders, and, more generally, precision medicine, may help to prevent the risk of T2D. This
could be achieved by predictive models of glucose dynamics in blood following an oral ingestion. Even though
many such models have been proposed, they either do not cope with IGA at all, or their calibration requires the
use of complex and invasive tracer protocols that make them clinically unusable on a daily basis. To overcome
this issue, D-xylose may be used as an IGA marker. Indeed, it is a glucose analogue with similar intestinal
absorption mechanisms but, contrary to glucose, its dynamics in blood only results from gastric emptying,
intestinal absorption and elimination by the kidney. In this paper, we investigate a model-based assessment of
IGA based on D-xylose dynamics in blood after oral absorption. We show that a multi-compartment model of
instestinal absorption can fit very well D-xylose data obtained from different experimental conditions and be
a good qualitative estimate of IGA. Additionnally, because gastric emptying is a possible confounding factor
with intestinal absorption, we explore the relative contribution of both mechanisms to the rate of D-xylose
(and thus glucose) appearance in blood.
1 INTRODUCTION
Type 2 diabetes (T2D) is a metabolic disease, with a
high prevalence worldwide, that remains a major pub-
lic health issue in all countries. T2D is mainly char-
acterized by a high blood glucose concentration with
an abnormally low concentration of blood insulin, its
down-regulator hormone secreted by the pancreas. It
is commonly admitted that T2D is correlated with a
low pancreatic activity and a reduced ability for the
different tissues to absorb and use the glucose avail-
able in the blood. As it has multifactorial causes, as-
sociated with various comorbidities, such as obesity,
the challenge to develop an actual therapy is still up
to be tackled.
One of the markers of possible risks of T2D in
patients is a change in the glycemic postprandial re-
sponse (Bergman et al., 2018), that is, a modification
of the dynamics over time of glucose concentration in
a
https://orcid.org/0009-0007-6159-1966
b
https://orcid.org/0000-0002-3727-2320
c
https://orcid.org/0000-0002-3970-3761
the blood after a meal. It has been shown that one of
the major contributors of this postprandial response is
intestinal glucose absorption (IGA) (Tric
`
o et al., 2019;
Baud et al., 2016). Therefore, IGA monitoring would
lead to a better prevention of T2D in patients at risk,
improve the cure of patients affected, and more gener-
ally better understand the physiological mechanisms
at work in this disease.
In this regard, modeling postprandial glucose dy-
namics in blood is crucial to predict how a change of
IGA can affect the concentration of glucose in blood
and to devise new diabetes markers. This requires, in
particular, to model the rate of appearance of exoge-
nous glucose (Ra
G
), that is, the rate of glucose coming
from the meal. However, calibrating such a model in-
volves the experimental measure of this rate, which is
a difficult challenge. Indeed, the direct measurement
of Ra
G
requires an access to the portal vein, which is
generally hardly feasible and even impossible on hu-
mans. In addition, it cannot be deduced from other
easily observable variables like the concentration of
glucose in blood, because other mechanisms occur all
438
Dursoniah, D., Folschette, M., Goutchtat, R., Raverdy, V., Pattou, F. and Lhoussaine, C.
Modeling Intestinal Glucose Absorption from D-Xylose Data.
DOI: 10.5220/0012358300003657
Paper published under CC license (CC BY-NC-ND 4.0)
In Proceedings of the 17th International Joint Conference on Biomedical Engineering Systems and Technologies (BIOSTEC 2024) - Volume 1, pages 438-445
ISBN: 978-989-758-688-0; ISSN: 2184-4305
Proceedings Copyright © 2024 by SCITEPRESS – Science and Technology Publications, Lda.

the time: glucose excretion (by the kidneys), glucose
production (by the liver) and metabolization (by the
tissues), regulated by insulin.
The current approach to experimentally measure
Ra
G
is to perform oral glucose tests with multiple
isotopic tracers that consist in ingesting labelled glu-
cose (Toffolo et al., 2006). They allow to distinguish
between the different fluxes of glucose in the blood,
and to measure the fraction coming from the meal.
Nevertheless, these tests are invasive and complex to
set up in a clinical or lab routine, and as such don’t
allow to gather data on large cohorts of patients.
Here, we propose an alternative approach to mea-
sure Ra
G
that uses D-xylose as an IGA marker.
D-xylose is a sugar absorbed by the small intestine
and eliminated by the kidneys, in the same way than
glucose, but with no significant metabolization by
any other organs, including the liver, unlike glucose.
Therefore, as it is not stored, released, or regulated
from an endogenous source, we can assume that mon-
itoring D-xylose concentration in the blood mainly re-
flects its gastro-intestinal activity. Moreover, it is by
far simpler to use than isotopic tracer methods. Using
D-xylose as a quantitative marker of IGA in the clin-
ical and experimental settings has already been pro-
posed (Fujita et al., 1998; Baud et al., 2016; Goutch-
tat et al., 2022). However, such direct measurement
is not perfectly accurate since it ignores the effect of
D-xylose elimination that takes place in addition to
intestinal absorption, and cannot distinguish the re-
spective roles of gastric emptying and intestinal ab-
sorption in the rate of D-xylose appearance.
Related Works. So far, no mechanistic model of
D-xylose dynamics has been proposed yet. When it
comes to glucose dynamics, most of the models of
glucose appearance in blood rely on a complex gas-
tric emptying modeling. Historically, Elashoff et al.
proposed the first well-referenced model to describe
gastric emptying (Elashoff et al., 1982).
Later, Dalla Man et al. exposed the limitations of
the previous approach from Elashoff et al., and pro-
posed a complete gastro-intestinal model, not only
describing the gastric emptying, but also the glu-
cose intestinal absorption in post-prandial condition
(Dalla Man et al., 2006). In this model, the intestinal
absorption is reduced to a single flux with constant
rate, whereas the gastric emptying involves a complex
equation with 5 parameters. This model could fit their
own dataset of exogenous glucose, obtained with the
isotopic triple tracer method, considered as the gold
standard experimental approach to measure Ra
G
.
Salinari et al. proposed a spatial model of intesti-
nal absorption and transit, defined by means of a sys-
tem of partial differential equations, depending on
time and on the position along the intestine (Salinari
et al., 2011). The rate of transit was determined by
their specific data, mainly depending on the length of
the intestine (see Subsection 3.2). More importantly,
in this spatial model, we can consider a non-uniform
intestinal absorption rate along the intestine. This hy-
pothesis is indeed considered as realistic and the au-
thors show that different spatial distributions of ab-
sorption may result in different glucose appearance
dynamics.
Contribution. In this paper, we propose a new
model-based assessment of IGA. More precisely, we
investigate a physiological model of D-xylose dynam-
ics that is composed of multi-compartmental intesti-
nal transit and absorption, and both exponential gas-
tric emptying and D-xylose elimination. This model
can be seen as a simplified and discretized version of
the model of intestinal absorption by Salinari et al.
While being simple, we show that our model can fit
time series of D-xylose data obtained in different ex-
perimental conditions (oral and jejunal administration
of D-Xylose) with a good accuracy and, most impor-
tantly, that it can predict Ra
G
validated with tracer
data. We also show that the rates of gastric empty-
ing and of absorption, in particular, are identifiable.
In addition, to decypher the relative contribu-
tion of gastric emptying and intestinal absorption
to D-xylose dynamics, we show that the alternative
model of Dalla Man et al. (Dalla Man et al., 2006)
emphasizying on gastric emptying cannot fit equally
well our experimental data. Finally, we performed a
sensitivity analysis to decypher which of the rate of
gastric emptying and the rate of intestinal absorption
have the most significant impact on the overall quan-
tity of D-xylose absorbed after 180 minutes. We show
that this quantity is more sensitive to intestinal ab-
sorption and that D-xylose can thus potentially serve
as a marker of IGA that is easy to use in the clini-
cal setting. All data and experiments are available at:
https://zenodo.org/records/10136595.
2 MINIPIGS DATASETS
For our problematic, different experiments have been
performed to monitor sugar in the blood after an in-
take of a bolus of sugar using intestinal or oral admin-
istration. This entails two subpopulations of pigs each
producing several datasets.
The individuals of the first subpopulation under-
went an oral and a jejunal administration. The Oral
bolus dataset allows to monitor blood D-xylose in the
Modeling Intestinal Glucose Absorption from D-Xylose Data
439

normal state after an oral administration of the meal.
In the Intestinal (or jejunal) bolus dataset the stom-
ach is bypassed and the meal is directly administrated
in the small intestine. The blended meal includes 30 g
of D-xylose.
The individuals of the second subpopulation un-
derwent a surgical experiment (intestinal resection)
to assess the sugar response in blood after a change
in the absorption processes. This subpopulation is
interesting to compare the rate of appearance of ex-
ogenous glucose (Ra
G
) with the rate of appearance
of D-xylose (Ra
X
) in normal and experimental con-
ditions to demonstrate the relevance of D-xylose to
study IGA behavior. Indeed, this subpopulation ben-
efitted from a gold standard technique to monitor
their IGA, known as dual-tracer, implying two differ-
ently labeled glucoses to distinguish glucose from an
exogenous source and glucose from an endogenous
source (typically produced by the liver). This sub-
population thus produced four datasets: before and
after the surgery, both measuring D-xylose and glu-
cose concentrations in blood. The Oral bolus before
intestinal resection dataset allows to monitor blood
sugar in the normal state (before surgery) after an oral
administration of the meal. In the Oral bolus after in-
testinal resection dataset, about 80% of the mid-part
of the small intestine has been removed. After a time
of recovery, an oral administration of the meal is per-
formed. All these datasets are used to calibrate the
models.
3 MODEL STRUCTURE AND
CALIBRATION
This section presents the main model of this work
and results provided by this model. The first step
is to estimate the volume of distribution of D-xylose
V
D
X
, which represents the total volume of fluid that
D-xylose can occupy once absorbed by the intestine:
it serves as a reference to compute concentrations of
D-xylose in the body instead of quantities. It is usu-
ally normalized by the body weight, so the dimension
of V
D
X
is dL/kg. After an intravenous injection exper-
iment, it is defined by V
D
X
=
D
X
BW ·X
p
where D
X
is the
administrated dose of D-xylose (mg), X
p
is the con-
centration of D-xylose in the blood (mg/dL) when D
X
is fully administrated instantly, and BW is the body
weight (kg).
From this work, we found a significant linear cor-
relation (not shown) between the body weight and the
volume of distribution.This observation allowed us to
infer, from their body weight BW , the volume of dis-
tribution, denoted V
D
X
(BW ), of the minipigs that did
not underwent an intravenous injection experiment.
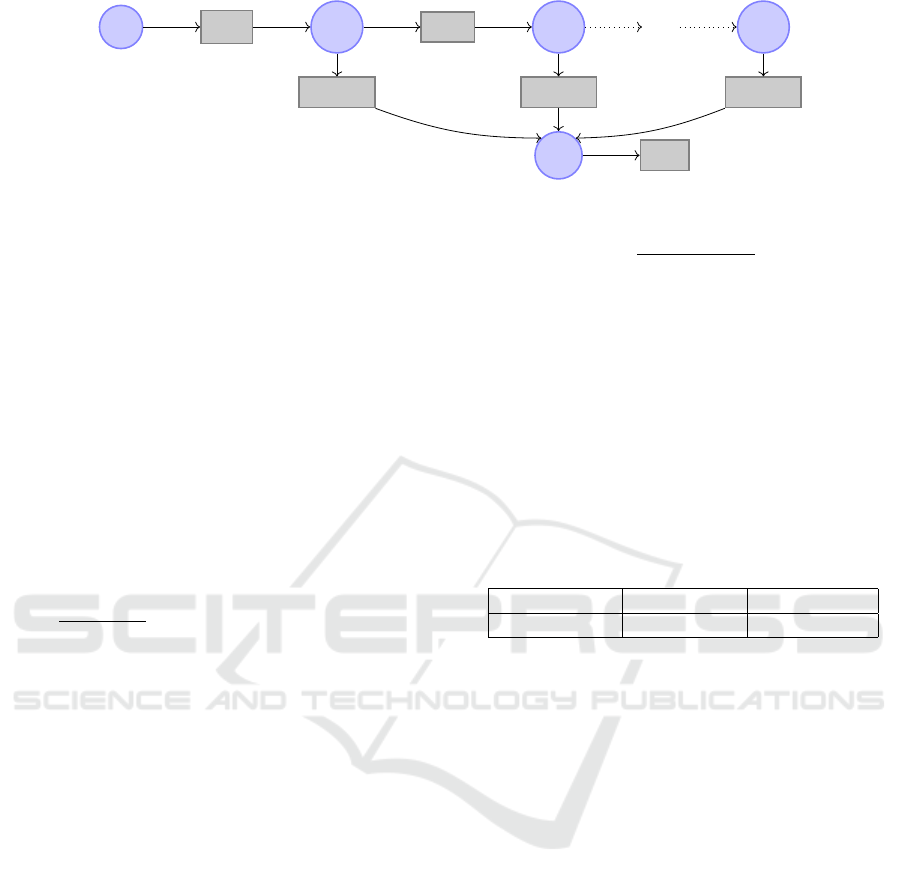
3.1 Multi-Compartment Model
The model that is used in the rest of this work is given
in Figure 1 both as a system of ordinary differential
equations (ODEs) and in the form of a reaction net-
work (using a Petri net-like graphical notation). It is
composed of the variables X
s
(D-xylose in the stom-
ach), X
p
(D-xylose in the plasma), and X
g1
,. .., X
gn
(D-xylose in the intestinal tract, where n = 10 for all
following numerical analyses).
The rate k
empt
(min
−1
) models gastric emptying
of the stomach into the intestine. This rate is will-
ingly kept simple, as opposed to other modelings such
as (Dalla Man et al., 2006) and as discussed in Sec-
tion 4.2. Intestinal transit is modeled as a flux of
D-xylose from each compartments X
g
i
to the next,
X
g
i+1
. We assume that this flux is uniform with rate
k
trans
(min
−1
) defined by k
trans
=
1
τ
and τ =
L
u·n
where
τ is the time required for the transit through one com-
partment (min), L is the length of the small intestine
(estimated at 1100 cm, the average length obtained
from the surgery performed for the oral bolus after
resection dataset), and u the speed of intestinal tran-
sit (empirically set to 6 cm/min, an estimation for the
PDE intestinal model of (Salinari et al., 2011)).
The global intestinal absorption, from the gut to
the plasma, is modeled with rate k
abs
(min
−1
). How-
ever, the distribution of this rate of absorption along
the intestine is supposed non-uniform. For this, for
each variable X
g
i
, the rate of absorption is modulated
by a strictly positive parameter α
i
. The sum of all
parameters α
1
, ..., α
n
equals 1, so that the global ab-
sorption rate (the sum of the rates from each com-
partment of the intestine) is thus k
abs
. Note that if
the distribution of these parameters is uniform (that
is, α
i
= 1/n for all i) then this model is equivalent
to a model where the whole intestine would be repre-
sented by a unique variable X
g
and an output rate of
k
abs
. We don’t force any particular distribution, and
the parameters α
i
are estimated in the following.
Finally, here, “elimination” is a generic term to
designate both D-xylose renal clearance and metabo-
lization, both resulting in D-xylose blood concentra-
tion decrease after a certain time, modeled by a rate
k
elim
(min
−1
). It is admitted that metabolization by the
tissue and in the gut can be considered as negligible,
making renal clearance the main factor of D-xylose
elimination; therefore, a single rate of elimination
from the plasma compartment is relevant. This model
is mainly a discretized variant of the model of (Sali-
nari et al., 2011).
BIOINFORMATICS 2024 - 15th International Conference on Bioinformatics Models, Methods and Algorithms
440
X
s
k
empt
X
g1
k
trans
X
g2
. . .
X
gn
α
1
· k
abs
α
2
· k
abs
. . .
α
n
· k
abs
X
p
k
elim
(a) Reaction network
˙
X
s
(t) = −k
empt
· X
s
(t)
˙
X
g1
(t) = k
empt
· X
s
(t) − (α
1
· k
abs
+ k
trans
) · X
g1
(t)
.
.
.
˙
X
gn
(t) = k
trans
· X
g
n−1
(t) − α
n
· k
abs
· X
gn
(t)
˙
X
p
(t) = Ra
X
(t) − k
elim
· X
p
(t)
Ra
X
(t) = k
abs
· (
n
∑
i=1
α
i
· X
gi
(t)) and
n
∑
i=1
α
i
= 1
(b) ODE system
˙
X
s
(0) =
D
X
BW ·V
D
X
(BW )
˙
X
g1
(0) = 0
.
.
.
˙
X
gn
(0) = 0
˙
X
p
(0) = 0
(c) Initial conditions
Figure 1: Multi-compartment model.
We also use a “jejunal injection” variant of the
model, that is used to fit the jejunal bolus dataset.
This variant is obtained by removing the variable
X
s
from the model and changing the initial value of
X
g1
to
D
X
BW ·V
D
X
(BW )
, in order to model the injection of
D-xylose directly into the intestine.
3.2 Parameter Estimation
Using our various available experimental datasets, we
adopt a parameter estimation strategy that minimizes
the risks of non-identifiability. For this, we estimate
parameters using two datasets at the same time: the
oral bolus dataset (on the main model) and the jeju-
nal bolus dataset (on its jejunal variant). The esti-
mated parameters are the rates k
empt
, k
abs
and k
elim
, in
addition to the absorption distribution parameters α
1
,
..., α
n
. All these parameters were considered common
to both models, except for k
empt
that does not exist in
the jejunal variant.
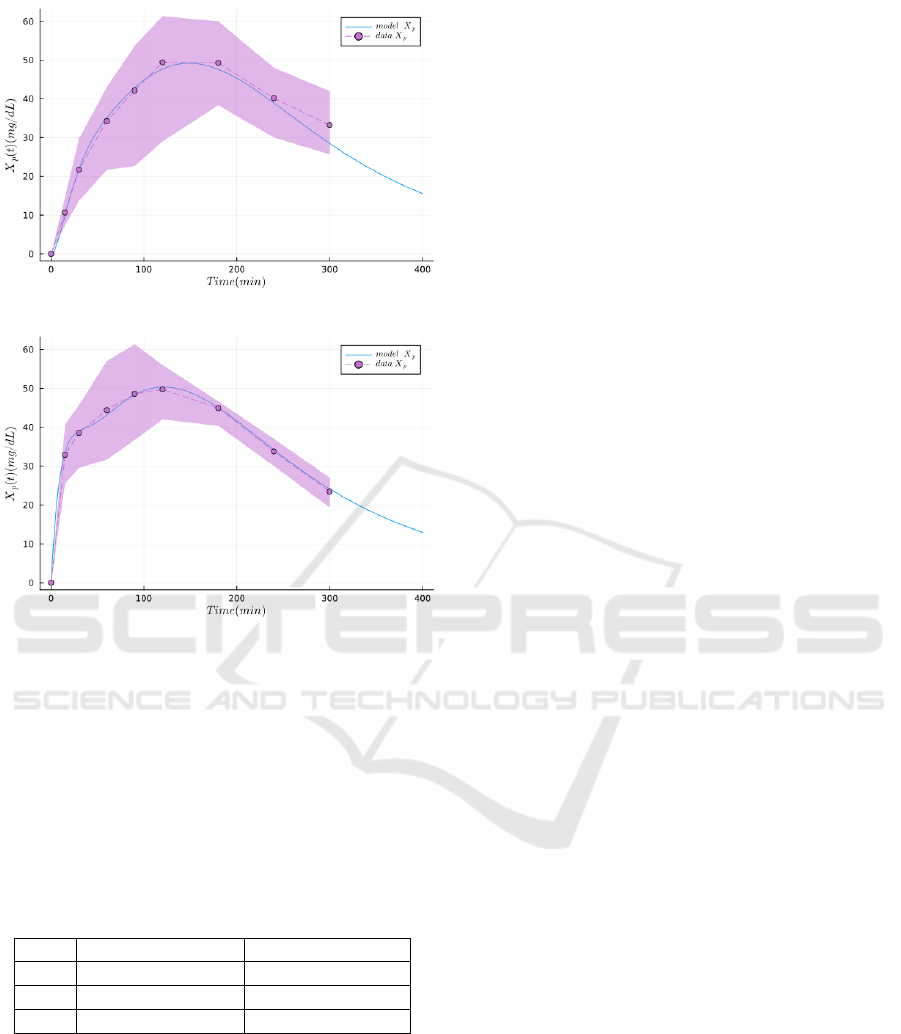
Technically, we fit the mean values of the
plasma D-xylose data X
p
(purple bullets in Fig-
ure 2) taking into account the standard deviation
(purple shaded area) to minimize the Negative Log-
Likelihood Loss (NLL −Loss). This is achieved using
the CMA-ES (Covariance matrix adaptation evolution
strategy) numerical optimization algorithm (Hansen,
2023). All implementation steps (data pre-processing,
model implementation and numerical analyses) were
made in the Julia programming language (v1.8.2)
with the following packages: CMAEvolutionStrategy
(v0.2.6), DifferentialEquations (v7.7.0), DiffEqPara-
Table 1: Parameter values estimated by fitting simultane-
ously the oral and jejunal bolus datasets with, respectively,
the model and its jejunal variant (NLL-Loss: 44.035).
k
empt
(min
−1
) k
abs
(min
−1
) k
elim
(min
−1
)
0.0379 0.222 0.00628
mEstim (v2.0.1), ModelingToolkit (v8.46.1), Cata-
lyst (v12.3.2), LikelihoodProfiler (v0.5.0) and Plots
(v1.38.5).
The parameter values that are obtained for k
empt
,
k
abs
and k
elim
are reported in Table 1. As can be seen
on Figure 2, the model performs a good fitting of both
the oral and jejunal datasets.
3.3 Practical Identifiability Analysis
Parameter estimation allows to find one set of param-
eter values that makes a model fit the data, but does
not guarantee that there aren’t any other values that
could equally or satisfyingly fit the data. Indeed, ex-
perimental data are noisy and part of the fitting de-
viation is to be attributed to experimental error. In-
tuitively, assuming acceptable error intervals for the
observed variables, if there is a “unique” set of pa-
rameter values that makes the observed variables fit
the data within these intervals, then the model is said
practically identifiable.
Identifiability analysis is an important step in as-
sessing the quality of a model. In this paper, we con-
sider practical identifiability based on the profile like-
lihood method (Raue et al., 2009). This method inves-
tigates the practical identifiability locally, that is, near
Modeling Intestinal Glucose Absorption from D-Xylose Data
441
(a) Results of the model fitting the oral bolus dataset
(b) Results of the jejunal variant of the model fitting the jeju-
nal bolus dataset
Figure 2: Results of the main model and its jejunal vari-
ant, respectively fitting the oral and jejunal bolus datasets
featuring plasma D-xylose (NLL-Loss: 44.035). The dots
and the dashed lines represent the mean experimental val-
ues, the envelope is the standard deviation, and the plain
lines are the simulations produced with the model.
Table 2: Practical identifiability analysis results. Here, each
value represents a confidence interval bound (denoted as
C.I.) that is reached, meaning complete practical identifi-
ability for the model. Missing values would have denoted
unreached bounds and thus incomplete identifiability.
C.I. lower bound C.I upper bound
k
empt
0.0374 0.0920
k
abs
0.222 0.328
k
elim
0.00622 0.00708
the estimated value of a given parameter. For this,
we used the Julia package LikelihoodProfiler (v0.5.0).
This tool locally analyses each parameter in a given
interval to scan, which gives a confidence interval
bound if the parameter is identifiable, or none if the
tool has reached the given scan interval bounds or if
no identifiability gain is detected along this interval.
As it is an exploratory step, we gave a relatively large
interval to scan for each parameter of interest. We set
the confidence interval to 95%.
The confidence intervals found for each parameter
are collected in Table 2. We actually ignore the iden-
tifiability of the speed of intestinal transit and the dis-
tribution of absorption parameters that are irrelevant
for the present work and, hence, set as constants for
this identifiability analysis. These intervals indicate
total identifiability for the three relevant parameters:
k
empt
, k
abs
and k
elim
. The results can be interpreted as
an indication of the good relevance of the collected
datasets and especially the good reliability of the es-
timation of our main parameter of interest, k
abs
. This
analysis has been performed in the same setting that
was used for fitting in Section 3.2, that is, on the main
model and its jejunal variant simultaneously.
3.4 Prediction of The Rate of Glucose
Absorption from The Dataset of
Intestinal Resection
In order to validate the usefulness of our model, we
test its capability to predict the rate of appearance
of exogenous glucose (Ra
G
) both in normal condition
and after an intestinal resection. Recall that this rate
corresponds to the part of the concentration of glucose
per unit of time appearing in blood that is originating
from the meal. This rate was experimentally moni-
tored using the dual tracer protocol. We show in the
following that the model is able to adapt to data ob-
tained after intestinal resection, which is considered
to experimentally simulate a change in the mecha-
nisms of glucose absorption. In this study, since the
setting and individuals are different from the datasets
used above, we re-evaluate all parameters (rates and
absorption parameters) except the elimination (con-
sidered untouched by the operation) before and af-
ter intestinal resection. However, since our model
is designed for D-xylose, we do not directly train it
on the available glucose data: instead, we train it on
the available D-xylose datasets (not featuring double-
tracer data, but only D-xylose concentration in blood
over time) and compare the results with the glucose
dynamics form the glucose datasets.
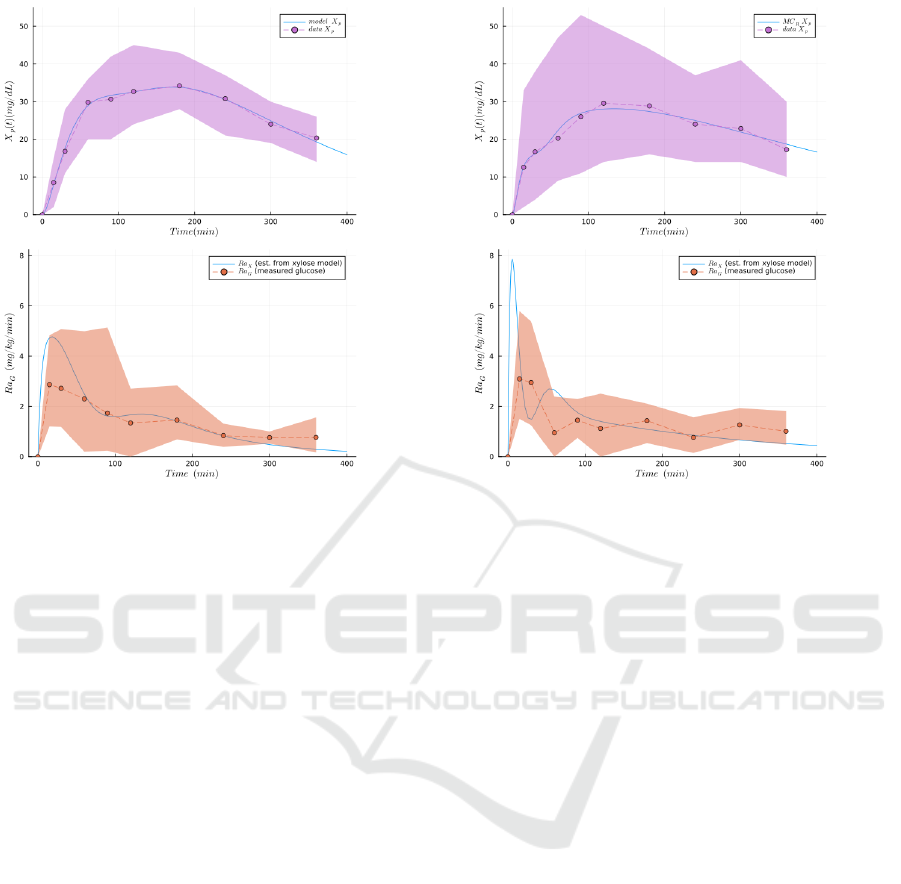
Finally, we compare the rate of D-xylose appear-
ance (Ra
X
) computed using the model (with the for-
mula given in Figure 1b) and compare it with the
Ra
G
experimental data (the rate of appearance of
exogenous glucose) obtained with the double-tracer
method. This result is presented in Figure 3. As
we can see, although the values of the parameters
were estimated on D-xylose plasma measurments, the
model gives a relatively satisfying prediction of the
rate of appearance of exogenous glucose (Figure 3,
lower plots). This tends to indicate that D-xylose
BIOINFORMATICS 2024 - 15th International Conference on Bioinformatics Models, Methods and Algorithms
442
(a) Results of the model fitting the oral bolus before intesti-
nal resection dataset.
(b) Results of the model fitting the oral bolus after intesti-
nal resection dataset.
Figure 3: Comparing the rate of glucose exogenous appearance (Ra
G
) from double tracer experiment, the gold standard
method, to the generated rate of appearance of D-xylose (Ra
X
), obtained from parameter estimation (NLL-Loss: 52.459) on
the same population. The dots and the dashed lines represent the mean experimental values, the envelope is the standard
deviation, and the plain lines are the simulations produced with the model. The top figures represent the plasma D-xylose
(used for fitting the parameters). The bottom figures represent the simulated rate of absorption of D-xylose (Ra
X
) from the
model, and the observed rate of absorption of glucose (Ra
G
) from double-tracer experiments. In both experimental conditions
(pre- and post-resection) we can observe a relatively good fitting between the glucose and the D-xylose, despite the absence
of a glucose model in this work.
might be an acceptable marker for glucose absorp-
tion. Note that the difference of the rates of appear-
ance between glucose and D-xylose after a resection
might reflect, on the one hand, that Ra
x
is the ex-
clusive reflection of the gastric emptying and the in-
testinal absorption, whereas on the other hand, Ra
G
reflects these two mechanisms in addition to the in-
evitable hepatic glucose metabolization, despite the
use of the gold standard method.
4 RELATIVE ROLES OF
GASTRIC EMPTYING AND
INTESTINAL ABSORPTION
In this section, we propose to compare the relative
roles that gastric emptying and intestinal absorption
play in the appearance of D-xylose in the blood, ac-
cording to our model. For this, we first perform a
global sensitivity analysis, which is designed to assess
the impact of the model parameters on a chosen model
output. In our case, such analysis would assess which
parameter is the most impactful on the D-xylose ap-
pearance, especially between gastric emptying and in-
testinal absorption. Since we considered D-xylose as
a relevant biomarker for glucose exogenous appear-
ance, it is expected that the model is more sensitive
to intestinal absorption than gastric emptying. In ad-
dition to the sensitivity analysis, we estimated the pa-
rameters on a model inspired by Dalla Man and col-
leagues (Dalla Man et al., 2006) characterized by a
detailed gastric emptying modeling and a simplified
intestinal modeling.
4.1 Global Sensitivity Analysis
The rate of exogenous sugar appearance (either Ra
X
for D-xylose or Ra
G
for glucose) depends not only on
the rate of intestinal absorption but also on the rate of
gastric emptying. Hence, both gastric emptying and
intestinal absorption events are potentially contribut-
ing to IGA. As we seek for a model that can assess
the intestinal activity to profile any individual, it is
important to check which factor is the most impactful
on IGA.
Modeling Intestinal Glucose Absorption from D-Xylose Data
443
Global sensitivity analysis allows to understand
how the uncertainty or variability in the inputs of a
model affects the output or outcome of the model.
It helps to identify which parameters have the most
significant impact on the model’s results. In this
work, the sensitivity analysis has been done on the
model (without the jejunal variant) using Sobol in-
dices (Sobo
´
l, 1993). For the model’s output, we con-
sider the area under the curve of D-xylose’s rate of
appearance at 180 minutes, noted AUC
Ra
X
. It corre-
sponds to the integration of Ra
X
, that is, to the to-
tal quantity of D-xylose that has reached the blood
at a given time t independently from the influence of
the rate of elimination k
elim
. In the absence of tracer
methods (as it is the case for D-xylose in this work),
computing AUC
Ra
X
is of interest to assess D-xylose
absorption because observing only its concentration
in plasma (X
p
) would be also influenced by the elim-
ination rate. Furthermore, by checking the output at
the maximum time monitored (180 min), we wanted
to ensure that the gastric emptying has way less in-
fluence on the rate of appearance than the intestinal
absorption, hence making sure that D-xylose can po-
tentially be used as a biomarker to assess Ra
X
(and
eventually Ra
G
).
We use the Julia package GlobalSensitivity
(v2.1.4) to perform this analysis for AUC
Ra
X
. This
analysis systematically states the importance of in-
testinal absorption, without denying the role of gastric
emptying, for both parameters. Indeed, it indicates a
first order Sobol index of 0.05 for k
empt
and a first or-
der Sobol index index of 0.95 for k
abs
.
4.2 Model with Complex Gastric
Emptying
To validate furthermore the degree of implication of
intestinal absorption over gastric emptying on the
glucose or D-xylose appearance in the blood, we
compared our results with another model featuring a
more complex gastric emptying part, inspired from
the works of Dalla Man and colleagues (Dalla Man
et al., 2006). This model features two compartments
for the stomach contents, the first (X
s
1
) representing
non-grinded food and the second (X
s
2
) representeing
grinded food (as opposed to only one compartment
for the model of Figure 1) but only one compartment
(X
g
) for the intestine (as opposed to several compart-
ments for the model of Figure 1). Moreover, the rate
of gastric emptying k
empt
from X
s
2
to X
g
is not a con-
stant value but depends on the sum of the two vari-
ables that represent the total content of the stomach
(X
s
1
+ X
s
2
), on the initial bolus (D
X
) and on other
constant parameters (k
min
, k
max
, a and b). Intuitively,
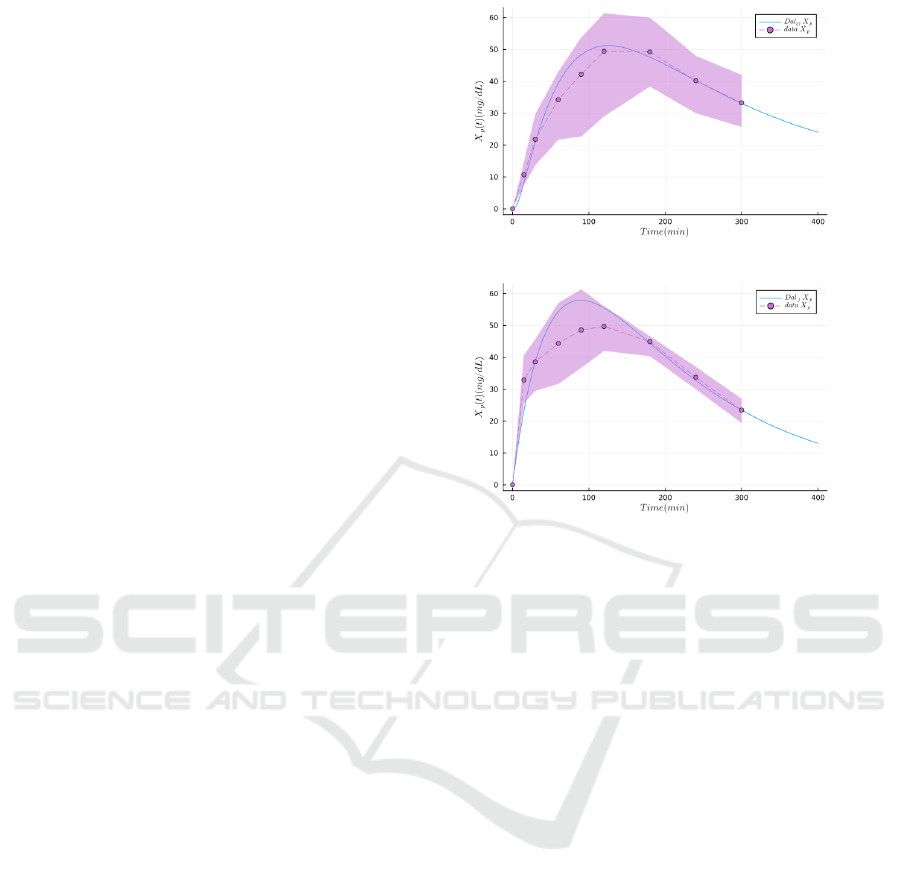
(a) X
p
from oral bolus.
(b) X
p
from jejunal bolus.
Figure 4: Results of parameter estimations of the model in-
spired from Dalla Man et al. on the oral and jejunal bolus
datasets (NLL-Loss: 47.416). The dots and the dashed lines
represent the mean experimental values, the envelope is the
standard deviation, and the plain lines are the simulations
produced with the model of Section 4.2.
this rate is U-shaped and reaches its maximum value
(k
max
) at the beginning and the end of the griniding
(when the stomach is almost full or almost empty) and
reaches its minimum value (k
min
) in-between.
The values of all constant parameters were ob-
tained with the same data (oral bolus dataset and je-
junal bolus dataset) and the same fitting method than
the model of Section 3. As a reminder, the experimen-
tal dataset features the D-xylose concentration over
time, measured in the peripheral blood, both after an
oral bolus and after a bolus directly injected in the je-
junum, and the fitting of the parameters is performed
using both experimental conditions at once. The idea
is to check if a model with a more complex stomach
and gastric emptying coupled with a simpler intestine
modeled as a single compartment is able to fit this
dataset as efficiently as the model of Figure 1. The
result of this experiment is given in the simulation of
Figure 4, showing that the more complex gastric part
of the model is not able to fit the data as well as the
model of Figure 1. Hence, combined with the sen-
sitivity analysis on the multi-compartment model, we
demonstrate the necessity to use the model of Figure 1
to reflect D-xylose appearance.
BIOINFORMATICS 2024 - 15th International Conference on Bioinformatics Models, Methods and Algorithms
444

5 CONCLUSIONS AND
PERSPECTIVES
In this work, we propose a multi-compartment model
of postprandial D-xylose dynamics as a first step to-
wards a predictive model of intestinal glucose absorp-
tion. This model is based on three major parameters
representing the (linear) rates of gastric emptying, in-
testinal absorption and elimination, and models the
intestine as a succession of compartments, thus intro-
ducing a delay that models the intestinal transit. We
calibrated the model using a tailored dataset from sev-
eral minipig populations that underwent oral, intra-
venous or jejunal administration of D-xylose, as well
as intestinal resection. We studied the identifiability
and the sensitivity of its parameters.
This model presents good performances in terms
of goodness-of-fit, even with the data of jejunal injec-
tion, especially when compared with another model
where the gastric part is more complex but the intesti-
nal part is simplified, and which does not fit the data
of jejunal injection data as well. This suggests that the
chosen multi-compartment modeling of the intestine
is relevant, and emphasizes the important role of in-
testinal absorption. Furthermore, the model appeared
to be identifiable for all relevant parameters.
Finally, we also compared the rate of appearance
of D-xylose predicted by the model with the actual
rate of appearance of exogenous glucose (Ra
G
), that
is, glucose only coming from the meal and not from
kidney storage, for instance. These results are very in-
teresting as they corroborate that D-xylose could be a
valuable marker of intestinal absorption. It reinforces
the fact that our model is a good candidate to predict
Ra
G
, at least qualitatively.
Besides of experimental investigations, further
work is necessary to improve, or better take advan-
tage of, the ability of the model to predict Ra
G
. Also,
we plan to propose a simplified model of the glucose-
insulin regulation system based on the minimal-
model of (Bergman et al., 1979) with an accurate
D-xylose-based model of IGA. Finally, datasets on
humans that underwent glucose and D-xylose bolus
administrations could help translate this model to hu-
mans. In the long term, it is hoped that this model
could be applied to humans and could help in a medi-
cal setting to diagnose patients with abnormal intesti-
nal glucose absorption.
ACKNOWLEDGMENTS
This work was supported by project MIGAD (ANR-
21-CE45-0017) of the French National Research
Agency (ANR).
REFERENCES
Baud, G., Raverdy, V., Bonner, C., Daoudi, M., Caiazzo,
R., and Pattou, F. (2016). Sodium glucose trans-
port modulation in type 2 diabetes and gastric bypass
surgery. Surgery for Obesity and Related Diseases,
12(6):1206–1212. Diabetes Special Issue.
Bergman, M. et al. (2018). Lessons learned from the 1-hour
post-load glucose level during ogtt: Current screen-
ing recommendations for dysglycaemia should be re-
vised. Diabetes/metabolism research and reviews,
34(5):e2992.
Bergman, R. N., Ider, Y. Z., Bowden, C. R., and Cobelli, C.
(1979). Quantitative estimation of insulin sensitivity.
American Journal of Physiology-Endocrinology and
Metabolism, 236(6):E667.
Dalla Man, C., Camilleri, M., and Cobelli, C. (2006). A
system model of oral glucose absorption: Validation
on gold standard data. IEEE Transactions on Biomed-
ical Engineering, 53(12):2472–2478.
Elashoff, J. D., Reedy, T. J., and Meyer, J. H. (1982).
Analysis of gastric emptying data. Gastroenterology,
83(6):1306–1312.
Fujita, Y., Kojima, H., Hidaka, H., Fujimiya, M., Kashi-
wagi, A., and Kikkawa, R. (1998). Increased intestinal
glucose absorption and postprandial hyperglycaemia
at the early step of glucose intolerance in otsuka long-
evans tokushima fatty rats. Diabetologia, 41:1459–
1466.
Goutchtat, R., Marciniak, C., Caiazzo, R., Verkindt, H.,
Quenon, A., Rabier, T., Lapiere, S., Raverdy, V., Hu-
bert, T., and Pattou, F. (2022). 1361-p: D-xylose test
as a biomarker for glucose intestinal absorption in hu-
mans and minipigs. Diabetes, 71(Supplement 1).
Hansen, N. (2023). The cma evolution strategy: A tutorial.
Raue, A., Kreutz, C., Maiwald, T., Bachmann, J., Schilling,
M., Klingm
¨
uller, U., and Timmer, J. (2009). Struc-
tural and practical identifiability analysis of partially
observed dynamical models by exploiting the profile
likelihood. Bioinformatics, 25(15):1923–1929.
Salinari, S., Bertuzzi, A., and Mingrone, G. (2011). Intesti-
nal transit of a glucose bolus and incretin kinetics: a
mathematical model with application to the oral glu-
cose tolerance test. American Journal of Physiology-
Endocrinology and Metabolism, 300(6):E955–E965.
Sobo
´
l, I. (1993). Sensitivity estimates for nonlinear mathe-
matical models. Math. Model. Comput. Exp., 1:407.
Toffolo, G., Basu, R., Dalla Man, C., Rizza, R., and
Cobelli, C. (2006). Assessment of postprandial
glucose metabolism: conventional dual-vs. triple-
tracer method. American Journal of Physiology-
Endocrinology And Metabolism, 291(4):E800–E806.
Tric
`
o, D., Mengozzi, A., Frascerra, S., Scozzaro, M. T.,
Mari, A., and Natali, A. (2019). Intestinal glu-
cose absorption is a key determinant of 1-hour post-
load plasma glucose levels in nondiabetic subjects.
The Journal of Clinical Endocrinology & Metabolism,
104(6):2131–2139.
Modeling Intestinal Glucose Absorption from D-Xylose Data
445
