
Evaluation of Gel and Dry Electrodes for EEG Measurement to
Compare Their Suitability for Multimodal Workload Detection in
Humans
Judith Bütefür
1
, Mathias Trampler
2
and Elsa Andrea Kirchner
1,2 a
1
Institute of Medical Technology Systems, University of Duisburg-Essen, Duisburg, Germany
2
Robotics Innovation Center, German Research Center for Artificial Intelligence (DFKI GmbH), Bremen, Germany
Keywords: Workload, N-Back Task, EEG Frequency Power, Task Load Index, Dry Electrode Headset.
Abstract: In this paper we aim to investigate whether the use of dry electrodes to detect multimodal workload could be
a viable way forward in the future. Therefore, we did a comparative study with gel (6 subjects) and dry
electrodes (2 subjects) and analysed the data using the Task Load Index (TLI) and the power spectrum of
different frequency bands. The results show that the TLI is significantly increasing for higher workload
condition (p < 0.04) and expected changes in the frequency bands are significant for both gel and dry
electrodes in subject-specific frequency bands. In conclusion, the results look promising, and it is worthwhile
to conduct another study with more subjects using dry electrodes.
1 INTRODUCTION
To know the overall workload level of a person
during a certain task is helpful in different areas. For
the prevention of mental disorders as, for example,
burnout due to permanent stress and overload, it is an
advantage to know the overall workload level of a
person (Greif & Bertino, 2022), as the tendency
towards mental disorders increased in the past (World
Health Organization, 2023) and this must be avoided
as much as possible. Safety-critical environments in
particular need to be better monitored in terms of
workload to protect the people who work in them. In
space flight, for example, it is important to know the
workload level of each astronaut, since a higher level
of workload is related to a higher risk to make
mistakes (Morris & Leung, 2006) and this can quickly
end fatally. Further, microgravity on ISS and in space
(ESA, 2023) will likely have an impact on the overall
workload since astronauts are not used to it in general.
The Multiple Resource Model by Wickens (2008)
defines different dimensions influencing workload.
Objects that are in microgravity behave significantly
differently than those in Earth gravity. As a result,
visual processing and special activities consume more
resources because the objects astronauts see behave
a
https://orcid.org/0000-0002-5370-7443
differently than they would expect. Thus,
investigation of the adaption of workload under
different gravitational conditions is important.
The literature shows that workload can be
determined based on different physiological signals
(Fairclough & Mulder, 2011; Singh, Ponzoni
Carvalho Chanel, & Roy, 2021; Volden, Alwis, de
Viveka, & Fostervold, 2018; Ding, Cao, Duffy,
Wang, & Thang, 2020).
Different modalities can be investigated to
estimate workload under different gravitational
conditions. The following modalities are of special
interest for our future research:
• Electroencephalogram (EEG),
• Eye Tracking (ET),
• Electrocardiogram (ECG) and
• Respiration (RESP)
EEG and ET are very common parameters for
workload estimation. ECG and RESP are very
interesting for space applications, since different
gravity conditions have an impact to the
cardiovascular system of a person (Schlegel, et al.,
1998) as well.
The aim of this paper is to see, if a measuring
system with dry electrodes in form of a headset could
Bütefür, J., Trampler, M. and Kirchner, E.
Evaluation of Gel and Dry Electrodes for EEG Measurement to Compare Their Suitability for Multimodal Workload Detection in Humans.
DOI: 10.5220/0012357800003657
Paper published under CC license (CC BY-NC-ND 4.0)
In Proceedings of the 17th International Joint Conference on Biomedical Engineering Systems and Technologies (BIOSTEC 2024) - Volume 1, pages 747-754
ISBN: 978-989-758-688-0; ISSN: 2184-4305
Proceedings Copyright © 2024 by SCITEPRESS – Science and Technology Publications, Lda.
747

be used for EEG measurement, since one big
advantage of such a device is that every person could
set this up on their own in a few seconds (Trampler,
Tabie, Rotonda, Heere, & Kirchner, 2021) which
would be required under conditions such as space
exploration with few persons and time available. To
test this, we conducted a study with both, a gel and
dry electrode system. Subjects had to solve the same
cognitive demanding tasks. To verify, which of the
systems is better suited for our aim, we looked at the
data measured during an N-back task (Kirchner W.
K., 1958).
The remainder of the paper is structured as
follows. In the next section, we provide an overview
about the EEG parameters that change due to
different workload conditions. In section 3, we
introduce the experimental setup of the study and
discuss the used methods. Afterwards, we explain the
results of the EEG analysis and discuss them in
section 5. In section 6 we give a conclusion about the
outcome.
2 WORKLOAD DETECTION
BASED ON THE
ELECTROENCEPHALOGRAM
This section provides information about the EEG and
the expected changes caused by “lower” and “higher”
workload. “Lower” workload was evoked by a clearly
simpler task with less demand on working memory.
The EEG measures brain activity with very high
time resolution by measuring the potential difference
between two electrodes (Berger, 1934). Some
parameters in the EEG are reported in literature that
change with different levels of workload.
For features in the time domain Pergher et al.
(2018) reported a higher P300 amplitude for lower
workload and the highest at the electrodes Fz, Pz and
Cz. A reduced amplitude of the P3a in an N-back task
was found as well (Putze, Mühl, Lotte, Fairclough, &
Herff, 2018). Kirchner et al. (2016) showed a reduced
P3b for high task load, i.e., workload caused by a task.
For features in the frequency domain a lot more
literature can be found in context to N-back tasks and
workload in general. Klimesch (1999) and Andreassi
(1995) reported that theta and alpha oscillations are
sensitive to task difficulty. Some groups reported a
change in the alpha band power over parietal sites
(Ding, Lu, Lin, & Tseng, 2016; Ewing, Fairclough, &
Gilleade, 2016). Ding et al. (2016) reported in detail
that they found a stronger alpha 1 (8-10 Hz) activity
in insula but a weaker alpha 2 (10-12 Hz) activity in
the anterior cingulate cortex for higher workload after
source reconstruction, compared to lower workload.
Ewing et al. (2016) calculated the frequency bands for
every subject individually and reported a decrease in
lower alpha band power (7.5-10 Hz) in the right
hemisphere. For upper alpha band power (10.5-13
Hz) they reported a decreasing power with increasing
demand.
The theta band power (4-8 Hz) was shown to
change during an increase of workload, while the
theta band power in the frontal sites does increase
(Bagheri & Power, 2020; Ewing, Fairclough, &
Gilleade, 2016; Shou & Ding, 2013). Nowak et al.
(2021) showed that an increase in theta band power at
frontal electrodes leads to better results in N-back
tasks. Ding et al. (2020) reported this especially for
the Fz electrode. Another group showed a stronger
theta activity in temporal regions 335 ms after the
stimulus onset (Ding, Lu, Lin, & Tseng, 2016).
Two groups showed an increase in beta band
power (13-25 Hz) for higher workload compared to
lower workload. Matthews et al. (2017) explained
that they would interpret the higher beta band power
as a direct expression of attentional overload or as an
indirect product of cognitive self-regulation. Singh et
al. (2021) found the higher beta band power mostly in
the fronto-central, temporal and occipital sites.
Changes in gamma band (25-45 Hz) are also
dependent on workload. Singh et al. (2021) showed
an increase in gamma band power for higher
workload, compared to lower workload in the brain
areas in which changes in beta activity were found.
To define the level of workload of a person, it is
also common to use the ratio of frequency band
powers of certain electrodes. For example, the Task
Load Index (TLI) is defined as the ratio between the
averaged power of the theta band at Fz and the
averaged power of the alpha band at Pz (Smith,
Gevins, Brown, Karnik, & Du, 2001).
3 METHODS
This section contains information about the dataset in
general, the experimental setup and procedure, the
data recording and pre-processing and the EEG
analysis.
3.1 Data
The data were recorded in two separated studies but
with the same experimental setup. The data for dry
electrodes and detailed information about the headset
are already published (Trampler, Tabie, Rotonda,
BIOSIGNALS 2024 - 17th International Conference on Bio-inspired Systems and Signal Processing
748
Heere, & Kirchner, 2021). These data were originally
recorded to explore the fit of the headset with five
subjects. The headset and its layout can be seen in
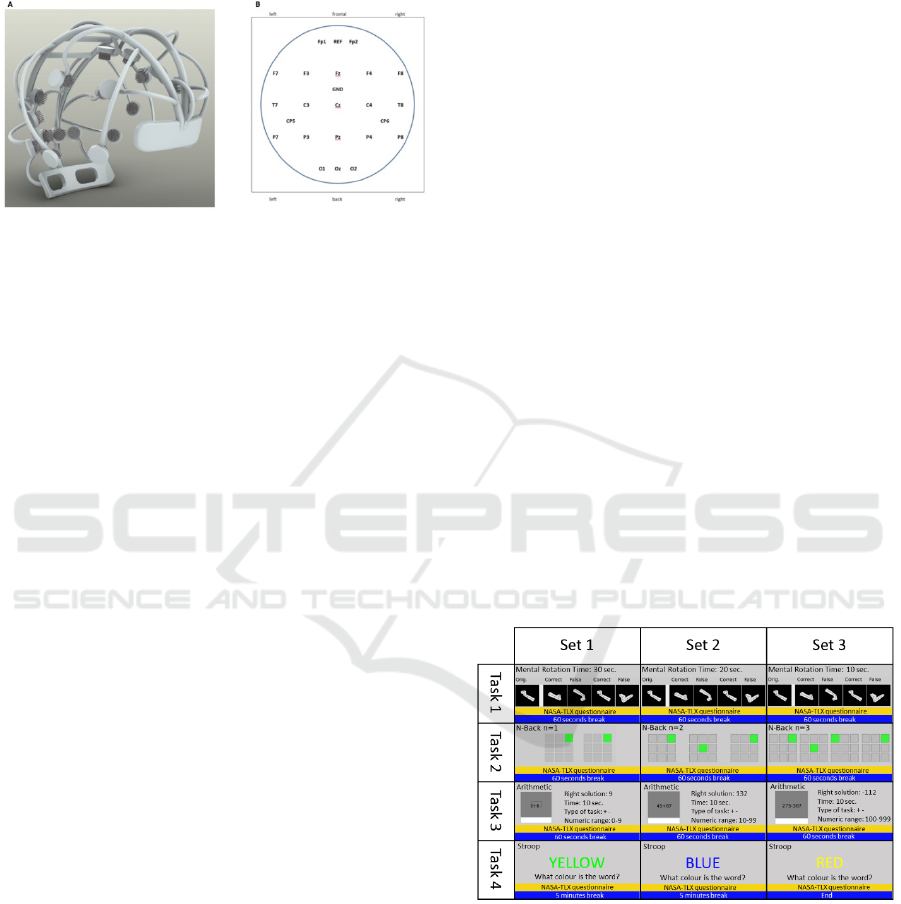
Figure 1.
Figure 1: A: Dry electrode headset with integrated
electrodes; B: layout (Trampler, Tabie, Rotonda, Heere, &
Kirchner, 2021).
The data with gel electrodes were afterwards
recorded with six subjects to compare dry electrodes
with gel electrodes.
The particular challenges of dry electrode systems
are both the signal quality and the wearing comfort
for the subjects, especially during longer
measurements. The electrodes must be placed on the
skin with a certain amount of pressure in order to
establish contact between the electrode and the scalp
with the appropriate impedance and to ensure good
signal quality. However, the pressure must not be too
high, as the test subjects would otherwise suffer pain.
This can be influenced by the flexibility of the
headset. The number of pins per electrode also has a
further influence on wearing comfort, as the pressure
is distributed over a larger area with more electrodes
and has no influence on the impedance (Fiedler, et al.,
2018).
3.2 Participants
EEG and ET data from eight healthy subjects (6 male,
average age = 29,8 ± 6,8) were included in this study.
All subjects gave their written informed consent and
were told that they could stop the experiment at any
time without consequences. The studies were
approved by the local Ethical Committee of the
University of Bremen. Subjects received a monetary
compensation of 10€ per hours.
3.3 Experimental Setting
Throughout the experiment, every subject executed
three sets with four different tasks each, always in the
same order. After every task the subject had to answer
the NASA-TLX questionnaire (Hart & Staveland,
1988). There was a 60-seconds break between every
task. After each set there was a break of five minutes.
The difficulty of the tasks increased with each set.
The experimental design can be seen in Figure 2.
The first task was a mental rotation task
(Shephard & Metzler, 1971) where subjects had to
decide which of the shown objects are the same but
rotated.
The second task was a visual N-back task
(Kirchner W. K., 1958). The easiest level was N=1,
the middle level N=2 and the most difficult N=3.
Square figures, as shown in Figure 2, were shown to
the subjects. Subjects were instructed to press a
button if the stimulus was a target. The number of
targets were between 20 and 30 and the number of
non-targets between 160 and 248 for every subject.
This difference in the number of stimuli is due to the
experimental design. Subjects had a time limit for the
task and had to process as many stimuli as possible.
The presentation time for each figure was 500 ms and
the inter-stimulus interval 2000 ms.
The third task was an arithmetic task in which the
subjects had to perform an addition or subtraction
with two numbers. The time limit was ten seconds for
each level of difficulty.
The last task was the Stroop test (Stroop, 1935).
Here, the levels of difficulty were always the same as
this task was a control task for workload conditions.
For the purpose of this paper only the EEG-data
from the N-back task are important and used for
evaluation.
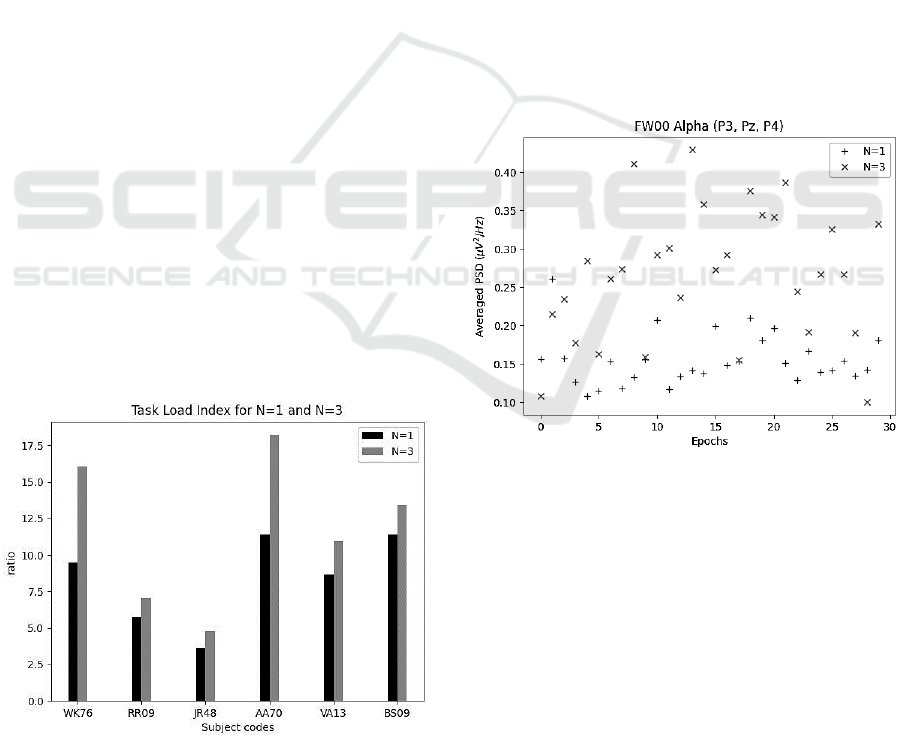
Figure 2: Experimental design.
3.4 EEG Recording and Pre-Processing
Before the experiment started, each subject was
prepared with the Pupil Core Eye Tracker from Pupil
Labs (https://pupil-labs.com/products/core/) with a
sampling frequency of 200 Hz @ 192x192px and an
accuracy of 0.60°.
Evaluation of Gel and Dry Electrodes for EEG Measurement to Compare Their Suitability for Multimodal Workload Detection in Humans
749

Subjects were also prepared with the EEG
system. ANT eego myLab (https://www.ant-
neuro.com/products/eego-mylab) with a sampling
rate of 500 Hz was used. Six of the subjects (WK76,
RR09, JR48, AA70 VA13 & BS09) were prepared
with 64-channel Ag/AgCl active gel electrodes,
positioned according to the 10-20 system with
reference at FCz. The other two subjects (FW00,
SD50) were prepared with a 24-electrode tailor-
developed headset with dry electrodes also according
to the 10-20 system, where each electrode is
positioned by an arch that adjusts its pressure to the
appropriate force (for more detailed information see
(Trampler, Tabie, Rotonda, Heere, & Kirchner,
2021)). The 24 electrodes used were defined as the
optimal minimum before the headset was built. As
explained in Trampler et al. (2021), three other
subjects were measured with the dry electrode
headset, but we were unable to record an EEG signal
because the electrode cap did not fit properly. The dry
electrode headset was tailor-developed to fit subject
FW00 perfectly.
During the experiment, both EEG and ET were
measured the entire time.
Pre-processing was done with the MNE python-
library. The data were down-sampled to 256 Hz and
a bandpass filter between 0.1 and 40 Hz was applied.
3.5 EEG Analysis
To analyse the EEG data, the N-back task data were
segmented into epochs of 15 seconds without any
overlap and without consideration of the
target- / non-target-events. Power Spectral Density
(PSD) in µV
2
/Hz was computed for the different
frequency bands using the multitaper method. The
frequency bands were defined for every subject
individually.
The peak was determined in a fixed frequency
band using the frequency ranges (Samima & Sarma,
2019), which are showed in Table 1. Peaks were
detected using Brain Vision Analyzer 2.2 (Brain
Products GmbH, Gilching, Germany).
The electrodes were chosen based on the expected
changes with different levels of workload in the
individual brain areas (see Sec. 2). For beta and
gamma FCz electrode was used for active electrodes
and T7 for dry electrodes, since the FCz electrode was
set to GND and cannot be recalculated (see Figure 1).
T7 was chosen instead, since beta and gamma
changes can also be detected in temporal brain
regions (Singh, Ponzoni Carvalho Chanel, & Roy,
2021). The peak detection was done for both, low and
high workload conditions in the predefined frequency
band. Afterwards, the average of both peak frequency
values was calculated to obtain a value for defining
the frequency band.
Table 1: Used frequency ranges for peak detection.
Frequency Range (Hz) Electrode
Theta 4.0 – 8.0 Fz
Alpha 8.0 – 13.0 Pz
Beta 13.0 – 25.0 FCz / T7
Gamma 25.0 – 45.0 FCz / T7
To determine the final individual frequency band,
we used a 2 Hz frequency band for theta and alpha
with the average values as the centre. For beta and
gamma, we used a 4 Hz frequency band around the
average values, also using them as the centre.
After all individual frequency bands were
determined, the average power within this range was
determined for each epoch individually. This was
done for all electrodes in the respective relevant brain
areas. In Table 2 the used electrodes are listed. FCz
was not used for the analysis, in contrast to peak
detection, of beta and gamma bands, because for the
dry electrode data it does not exist and the used
electrodes for analysis should be the same for all data.
Table 2: Electrodes used for analyses of different frequency
bands.
Frequency bands Used electrodes
Theta F3, F4
Alpha P3, Pz, P4
Beta/Gamma
F3, Fz, F4, C3, Cz, C4,
T7, T8, O1, O2
For statistical analysis, it must be checked
whether the data are normally distributed. Hence, the
Kolmogorov-Smirnov test was applied. Since it
turned out that the data are not normally distributed,
the Wilcoxon signed-rank test was used to check for
statistical significance. If frequency bands were
significantly different, the absolute values were used
to see if the conditions (e.g., alpha power for N=1 >
N=3) were fulfilled (see Figure 4 for an example).
Also, the TLI was calculated for each subject
individually, using the average power over all epochs
for theta band of Fz electrode and the average power
over all epochs for alpha band of Pz electrode.
Although the N-back task is not a typical task for task
load, the frequency bands considered for workload
are very similar. The TLI can therefore be a first
indication of whether a subject’s workload level is
changing. In addition, a specific task was performed
during the N-back task, which affects the workload.
Also, a study by Hamann et al. (2023) showed the
BIOSIGNALS 2024 - 17th International Conference on Bio-inspired Systems and Signal Processing
750
sensitivity of the TLI for workload. Normal
distribution was again tested using the Kolmogorov-
Smirnov test. Since there was no normal distribution
of the data, the Wilcoxon signed-rank test was used
to test statistical significance to see, if the TLI is
significant higher for N=3 in comparison to N=1. The
TLI was used to show in the first step whether a
significant difference in the frequency bands could be
seen at all for individual subjects within the different
levels of workload before the individual frequency
bands were analysed. The TLI was used, since it is
often used for workload estimation, even if ratios of
frequency bands should be used with caution
(Boumann, Hamann, Biella, Carstengerdes, &
Sammito, 2023). It can be used in this study because
the subjects have to actively perform a task, to which
the workload condition is linked.
4 RESULTS
The following section presents the results of the EEG
analysis in the frequency domain.
4.1 Task Load Index
The Wilcoxon signed-rank test showed a significant
increase of workload between the lowest (N=1) and
highest (N=3) task level (p < 0.04) over all subjects
measured with the gel electrodes. When looking at the
individual subjects, a difference in TLI can be seen
for all subjects (see Figure 3). For subjects with dry
electrodes the TLI was also calculated. However, the
sample size is not large enough for a statistically
significant statement regarding TLI.
Figure 3: TLI for subjects with gel electrodes for different
workload levels.
4.2 Single EEG Bands
We compared the power of the individual EEG
frequency bands under different workload conditions
(N=1 and N=3) for each subject individually.
For the theta band power, we analysed the F3 and
F4 electrodes. We could show a significant increase
in the power for four subjects with gel electrodes
(p < 0.003). For the dry electrodes one subject
showed a significant increase (p < 0.001). The results
can be seen in Table 3.
For the alpha band power, we used the electrodes
P3, Pz and P4 and could show a significant decrease
in power (p < 0.03) for four subjects, but not for the
same subjects as for theta power. For the subjects
with dry electrodes, we could show a decrease in
power of the alpha band for one subject (p < 0.01).
For subject FW00 the difference between the band
power of N=1 and N=3 was significant, but alpha
power increased from the lower workload condition
to higher workload condition, which can be seen in
Figure 4. This value is marked with an asterisk. For
individually results of all subjects see Table 3.
Figure 4: Averaged PSD values for alpha band power of
subject FW00 under different workload conditions.
For beta and gamma band power we used the
electrodes F3, Fz, F4, C3, Cz, C4, T7, T8, O1 and O2.
For beta band power we could show a significant
increase in power for one subject with gel electrodes
(p < 0.05) and for one with dry electrodes (p < 0.001).
For four of the other subjects the difference between
the beta band power was significant, but the power
for N=3 decreased in comparison to N=1, instead of
increasing. In Table 3, these values are marked with
an asterisk as well.
Evaluation of Gel and Dry Electrodes for EEG Measurement to Compare Their Suitability for Multimodal Workload Detection in Humans
751
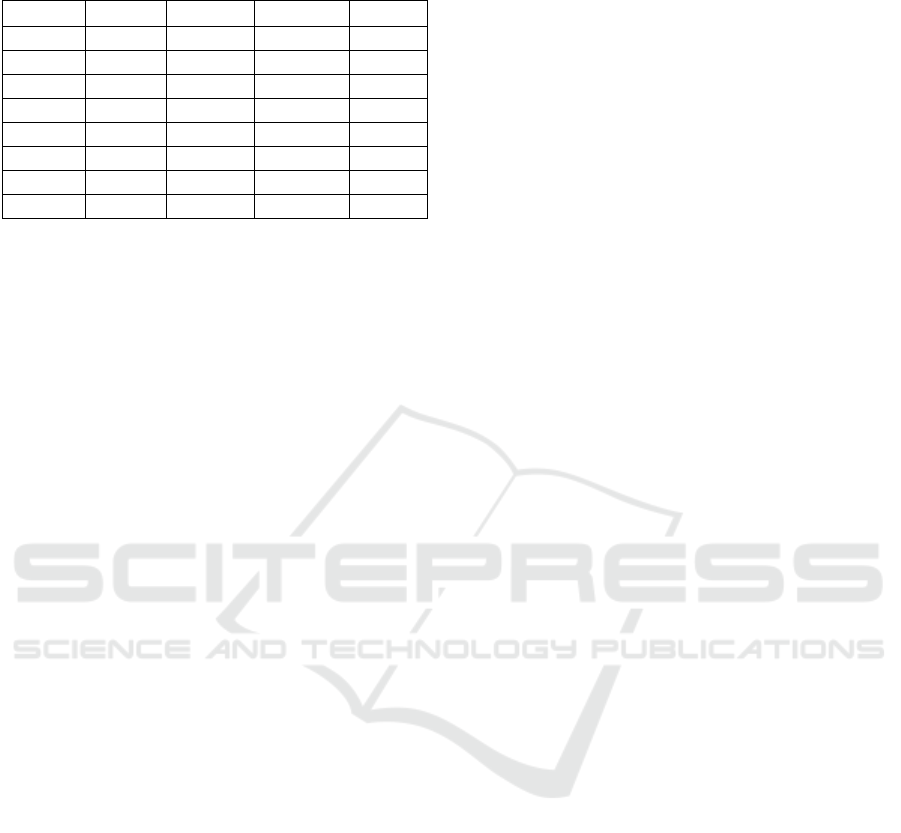
Table 3: p-values for each subject from Wilcoxon signed-
ranked test.
Subject
θ α β γ
WK76 <0.001 <0.001 <0.001* n.s.
RR09 <0.001 <0.03 <0.05 <0.01
JR48 <0.001 <0.001 n.s. n.s.
AA70 <0.003 n.s. <0.001* n.s.
VA13 n.s. n.s. n.s. <0.001
BS09 n.s. <0.001 <0.003* <0.001
FW00
1
<0.001 <0.001* <0.004* <0.004
SD50
1
n.s. <0.009 <0.001 <0.001
*Significantly different, but power does not change in the
direction as expected
1
Subjects measured with dry electrodes
For gamma band power we could show a
significant increase in gamma band power for three
subjects with gel electrodes (p < 0.01) and for both
subjects with dry electrodes (p < 0.004). The results
for beta and gamma band power can also be seen in
Table 3.
5 DISCUSSION
The main objective of this study was to investigate, if
an EEG headset system with dry electrodes is suitable
for determining workload levels of humans. To test
this, we did a study with gel and dry electrodes. Dry
electrodes were placed in a custom-made headset
optimized to fit a specific person. For this
comparison, subjects had to do an N-back task with
three conditions (low (N=1), medium (N=2) and high
(N=3) workload). For the analysis we only looked
into the low and high workload data and compared
them with each other.
For data analysis objective measures were used.
We did a frequency analysis, because if we find more
workload-related and relevant features, these could
also be used in addition to the time domain features
for machine learning. First the TLI was calculated. As
can be seen in Figure 3 a change in TLI, which
basically means a change in the ratio between theta
band power in Fz electrode and alpha band power in
Pz electrode can be seen for all subjects with gel
electrodes. The difference is also statistically
significant (p < 0.04).
Unfortunately, we cannot provide statistics
regarding TLI with dry electrodes because the sample
size of two subjects is too small. For this, more
subjects must be measured with dry electrodes. This
was not possible, since the dry electrode headset is
customized to fit one person, as mentioned above, and
would not fit very well to other subjects. We tried to
measure more subjects, but if the size of the head is
too small, we could not get any results, because there
is no contact between the electrodes and the head
surface. If the size of the head is too big, subjects
would easily get a headache because of too much
pressure. This is definitely a disadvantage of dry
electrode headsets compared to gel electrode caps, as
already discussed in Trampler et al. (2021), although
they are easily to put on by the users themselves.
For the analysis of the power of the frequency
bands we used different electrodes for the bands,
since the changes of power are detected in different
brain areas (Ding, Lu, Lin, & Tseng, 2016; Ding, Cao,
Duffy, Wang, & Thang, 2020; Singh, Ponzoni
Carvalho Chanel, & Roy, 2021). For beta and gamma
frequency we used F3, Fz, F4 and C3, Cz, C4 instead
of FC1 and FC2 for fronto-central region, since the
dry electrode headset does not have these electrodes
and we want to have comparable results.
Based on the analysis, it can be said that the
frequency bands have different significance for the
analysis of workload. According to the results from
Table 3, it can be seen that theta and alpha band power
are significant for most of the subjects. At least one
of these two frequency bands is significant for all
subjects except VA13. For the subjects WK76, RR09
and JR48 even both power changes are significant.
Beta band power has less significance in relation
to theta and alpha. Its changes are just significant for
two subjects, whereas one was measured with gel
electrodes and one with dry electrodes.
Gamma band power changes are significant for
five subjects in total, but it is hard to interpret since it
is a really high frequency band and its changes could
also be affected by muscle activity from frontalis
and/or temporalis muscles (Goncharova, McFarland,
Vaughan, & Wolpaw, 2003).
Overall, based on our analyses we can state that
changes in frequency bands regarding different
workload conditions are very subject-specific. This is
also important for machine learning, as it makes
features very subject-specific as well.
Results from dry electrodes show that there are
significant changes in the power of frequency bands.
For the subject FW00 we found a significant change
in the power of alpha and gamma frequency bands.
For subject SD50 we could find significant changes
in the power of all frequency bands except alpha. For
both subjects we could see a very similar behaviour
for dry electrodes compared to gel electrodes.
For future work, the other modalities presented in
the introduction (ET, ECG, RESP) should be included
to increase the likelihood of the data being useful if
the EEG data cannot be recorded properly. The
BIOSIGNALS 2024 - 17th International Conference on Bio-inspired Systems and Signal Processing
752

presented modalities also promise a good analysis of
the current workload. In addition, the headset must be
adapted in terms of cross-subject fit and comfort so
that a study with more than two subjects of good data
quality can be conducted.
6 CONCLUSION
In this study, we investigated whether the use of dry
electrodes to detect workload could be a viable way
forward, particularly using a headset that can be very
easily self-fitted. Our results suggest that dry
electrodes are a promising alternative for the
detection of workload if the headset fits the subject.
As a next step a study with a larger sample of subjects
is needed. However, the adaptability of the dry
electrode headsets is significantly less than that of gel
electrode caps. To improve this, either better suited
subjects with very similar head shapes can be selected
or better fitting headsets must be built.
ACKNOWLEDGEMENTS
We would like to express our gratitude to all the
subjects who participated in the study. Also, we
would like to thank the researchers from DFKI,
namely Marc Tabie and Mathias Trampler, who set
up the experiment and recorded the data. Special
thanks also goes to Dr. Su-Kyoung Kim for her help
with the statistical analysis.
REFERENCES
Andreassi, J. L. (1995). Psychophysiology: Human
behaviour and physiological responses. Lawrence
Erlbaum Associates Inc.
Bagheri, M., & Power, S. D. (2020). EEG-based detection
of mental workload level and stress: the effect of
variation in each state on classification of the other. J.
Neural Eng. 17 (5), p. 56015, doi: 10.1088/1741-
2552/abbc27.
Berger, H. (1934). Über das Elektroencephalogramm des
Menschen. Dtsch Med Wochenschr 60 (51), pp. 1947-
1949, doi: 10.1055/s-0028-1130334.
Boumann, H., Hamann, A., Biella, M., Carstengerdes, N.,
& Sammito, S. (2023). Suitability of Physiological,
Self-report and Behavioral Measures for Assessing
Mental Workload in Pilots. Harris, D., Li, WC. (eds)
Engineering Psychology and Cognitive Ergonomics.
HCII 2023. Lecture Notes in Computer Science, vol
14017. Springer, Cahm, https://doi.org/10.1007/978-3-
031-35392-5_1.
Ding, H.-M., Lu, G.-Y., Lin, Y.-P., & Tseng, Y.-L. (2016).
An EEG Stuy of Auditory Working Memory Load and
Cognitive Performance. Constantine Stephanidis (Hg.):
HCI International 2016 - Posters' Extended Abstracts.,
pp. 181-185.
Ding, Y., Cao, Y., Duffy, V. G., Wang, Y., & Thang, X.
(2020). Measurement and identification of mental
workload during simulated computer tasks with
multimodal methods ans machine learning. Ergonomics
63 (7), pp. 896-908, doi: 10.1080/00140139.2020.
1759699.
ESA. (16. September 2023). European Space Agency. from
https://www.esa.int/Space_in_Member_States/German
y/Wo_ist_die_Internationale_Raumstation
Ewing, K., Fairclough, S., & Gilleade, K. (2016).
Evaluation of an adaptive game that uses EEG measures
validated during the design process as inouts to a
biocyberentic loop. Fron. Hum. Neurosci., p. 223.
Fairclough, S., & Mulder, L. (2011). Psychophysiological
processes of mental effort investment. In How
Motivation Affects Cardiovascular Response:
Mechanisms and Applications (pp. 61-76).
Washington, DC, USA: American Psychological
Association.
Fiedler, P., Mühle, R., Griebel, S., Pedrosa, P., Fonseca, C.,
Vaz, F., . . . Haueisen, J. (April 2018). Contact Pressure
and Flexibility of Multipin Dry EEG Electrodes. IEEE
Transactions on Neural Systems and Rehabilitation
Engineering, pp. 750 - 757, doi: 10.1109/TNSRE.20
18.2811752.
Goncharova, I. I., McFarland, D. J., Vaughan, T. M., &
Wolpaw, J. R. (2003). EMG contamination of EEG:
spectral and topographical characteristics. Clinical
Neurophysiology 114, pp. 1580-1593, doi:
10.1016/S1388-2457(03)00093-2.
Greif, S., & Bertino, M. (2022). Burnout: Characteristics
and Prevention in Coaching. In S. Greif, H. Möller, W.
Scholl, J. Passmore, & F. Müller, International
Handbook of Evidence-Based Coaching. Springer,
Cham. doi: 10.1007/978-3-030-1938-5_9.
Hamann, A., & Carstengerdes, N. (2023). Don't Think
Twice, It's All Right? - An Examination of Commonly
Used EEG Indices and Their Sensitivity to Mental
Workload. Harris, D., Li, WC: (eds) Engineering
Psychology and Cognitive Ergonomics. HCII 2023.
Lecture Notes in Computer Science(), vol 14017.
Springer, Cham., doi: 10.1007/978-3-031-35392-5_5.
Hart, S. G., & Staveland, L. E. (1988). Development of
NASA-TLX (Task Load Index): Results of Empirical
and Theoretical Research. In Hancock, Peter A.;
Meshkati, Najmedin (eds.), Human Mental Workload.
Advances in Psychology. 52 (pp. 139-183). Amsterdam:
North Holland.
Kirchner, E. A., Kim, S.-K., Wöhrle, H., Tabie, M.,
Maurus, M., & Kirchner, F. (2016). An intelligent man-
machine interface - multi-robot control adapted for task
engagement based on single-trial detectability of P300.
Frontiers in Human Neuroscience, p. 291, doi:
10.3389/fnhum.2016.00291.
Evaluation of Gel and Dry Electrodes for EEG Measurement to Compare Their Suitability for Multimodal Workload Detection in Humans
753

Kirchner, W. K. (1958). Age differences in short-term
retention of rapidly changing information. Journal of
experimental psychology, pp. 352-358, 55(4).
Klimesch, W. (1999). EEG alpha and theta oscillations
reflect cognitive and memory performance: a review
and analysis. Brain Research Reviews 29 (2), p. 169-
195.
Matthews, G., Reinerman-Jones, L., Abich, J., &
Kustubayeva, A. (2017). Metrics for individual
differences in EEG response to cognitive workload:
Optimizing performance prediction. Personal. Individ.
Differ., pp. 22-28.
Morris, C. H., & Leung, Y. K. (2006). Pilot mental
workload: how well do pilots really perform?
Ergonomics 49 (15), pp. 1581-1596, doi:
10.1080/001401306008579787.
Nowak, K., Costa-Faidella, J., Dacewicz, A., Escera, C., &
Szelag, E. (2021). Altered event-related potentials and
theta oscillations index auditory working memory
deficits in healthy aging. Neurobiology of Aging 108,
pp. 1-15, doi: 10.1016/j.neurobiolaging. 2021.07.019.
Pergher, V., Wittenvrongel, B., Tournoy, J., Schoenmakers,
B., & van Hulle, M. (2018). N-back training and
transfer effects revealed by behavioural responses and
EEG. Brain and behaviour 8 (11), doi: 10.1002/
brb3.1136.
Putze, F., Mühl, C., Lotte, F., Fairclough, S., & Herff, C.
(2018). Detection and Estimation of Working Memory
States and Cognitive Functions Based on
Neurophysiological Measures. Front. Hum. Neurosci.
12, p. 440, doi: 10.3389/fnhum.2018.00440.
Samima, S., & Sarma, M. (2019). EEG-Based Mental
Workload Estimation. Annual International
Conference of the IEEE Engineering in Medicine and
Biology Society. IEEE Engineering in Medicine and
Biology Society. Annual International Conference
2019, pp. 5605-5608, doi: 10.1109/EMBC.
2019.8857164.
Schlegel, T. T., Benavides, E. W., Barker, D. C., Brown, T.
E., Harm, D. L., DeSilva, S. J., & Low, P. A. (1998).
Cardiovascular and Valsalva responses during
parabolic flight. Journal of applied physiology, pp.
1957-1965, doi: 10.1152/jappl.1998.85.5.1957.
Shephard, R., & Metzler, J. (1971). Mental Rotation of
Three-Dimensional Objects. Science, 171, pp. 701-703.
Shou, G., & Ding, L. (2013). Frontal theta EEG dynamics
in a real-world air traffic control task. Proceedings of
the 35th Annual International Conference of the IEEE
Enginerring in Medicine and Biology Society (EMBC),
pp. 5594-5597.
Singh, G., Ponzoni Carvalho Chanel, C., & Roy, R. N.
(2021). Mental Workload Estimation Based on
Physiological Features for Pilot-UAV Teaming
Applications. Frontiers in Human Neuroscience, pp.
22-28, doi: 10.3389/fnhum.2021.692878.
Smith, M. E., Gevins, A., Brown, H., Karnik, A., & Du, R.
(2001). Monitoring Task Loading with Multivariate
EEG Measures during Complex Forms of Human-
Computer Interaction. Human Factors
, pp. 366-380,
doi: 10.1015/001872001775898287.
Stroop, J. R. (1935). Studies of interference in serial verbal
reactions. Journal of Experimental Psychology. 18 (6),
pp. 643-662.
Trampler, M., Tabie, M., Rotonda, M., Heere, N., &
Kirchner, E. A. (2021). Continuous Mental State
Detection for Mental Ergonomics. Neuroergonomics
Conference 2021.
Volden, F., Alwis, E., de Viveka, & Fostervold, K.-I.
(2018). Human Gaze-Parameters as an Indicator of
Mental Workload. Proceedings of the 20th Congress of
the International Ergonomics Association (IEA 2018).
Volume X: Auditory and Vocal Ergonomics, Visual
Erfonomics, Psychophysiology in Ergonomics,
Ergonomics in Advanced Imaging, pp. 209-215.
Wickens, C. D. (2008). Multiple resources and mental
workload. Human Factors 50 (3), pp. 449-455, doi:
10.1518/001872008X288394.
World Health Organization. (13. September 2023). Mental
disorders. from https://www.who.int/news-room/fact-
sheets/detail/mental-disorders
BIOSIGNALS 2024 - 17th International Conference on Bio-inspired Systems and Signal Processing
754
