
FeedMeter: Evaluating the Quality of Community-Driven Threat
Intelligence
Andreas R
¨
uedlinger
1 a
, Rebecca Klauser
2 b
, Pavlos Lamprakis
2
, Markus Happe
2 c
,
Bernhard Tellenbach
3 d
, Onur Veyisoglu
4
and Ariane Trammell
4
1
Deimos AG, Zurich, Switzerland
2
Exeon Analytics AG, Zurich, Switzerland
3
Armasuisse, Zurich, Switzerland
4
Zurich University of Applied Sciences ZHAW, Winterthur, Switzerland
bernhard.tellenbach@armasuisse.ch, {onur.veyisoglu, ariane.trammell}@zhaw.com
Keywords:
Open Source Intelligence (OSINT), Cyber Threat Intelligence (CTI), Threat Feeds.
Abstract:
A sound understanding of the adversary in the form of cyber threat intelligence (CTI) is key to successful
cyber defense. Various sources of CTI exist, however there is no state-of-the-art method to approximate feed
quality in an automated and continuous way. In addition, finding, combining and maintaining relevant feeds
is very laborious and impedes taking advantage of the full potential of existing feeds. We propose FeedMeter,
a platform that collects, normalizes, and aggregates threat intelligence feeds and continuously monitors them
using eight descriptive metrics that approximate the feed quality. The platform aims to reduce the workload
of duplicated manual processing and maintenance tasks and shares valuable insights about threat intelligence
feeds. Our evaluation of a FeedMeter prototype with more than 150 OSINT sources, conducted over four years,
shows that the platform has a real benefit for the community and that the metrics are promising approximations
of source quality. A comparison with a prevalent commercial threat intelligence feed further strengthens this
finding.
1 INTRODUCTION
Threat information is defined by The National Insti-
tute of Standards and Technology (NIST) (Johnson
et al., 2016) as “any information that can help an or-
ganization identify, assess, monitor, and respond to
cyber-threats”. This information is considered key
to effectively defend against, react on, and detect at-
tacks. To be applicable, this information must be
transformed into threat intelligence which the NIST
defines as “threat information that has been aggre-
gated, transformed, analyzed, interpreted, or enriched
to provide the necessary context for decision-making
processes” (Johnson et al., 2016). One possibility
to get threat intelligence is the use of Open-source
intelligence (OSINT) sources, available in the Inter-
net. The scope and the quality of OSINT sources vary
a
https://orcid.org/0000-0002-1150-404X
b
https://orcid.org/0000-0002-6409-7281
c
https://orcid.org/0000-0002-2455-0870
d
https://orcid.org/0000-0002-5008-1107
heavily, making source selection difficult. In research,
there have been numerous attempts (e.g., recently by
(Griffioen et al., 2020, Li et al., 2019, Ramanathan
et al., 2020)) to analyze the quality of CTI feeds using
some of the criteria defined by the European Union
Agency for Cybersecurity (ENISA) (Pawlinski et al.,
2014). However, applicability of these studies are
limited since they often only represent a snapshot for
a given point in time, or their results cannot be veri-
fied due to use of closed source algorithms or data.
As shown in (Johnson et al., 2016, RSA, The
Security Division of EMC, 2012, Sauerwein et al.,
2017, Connolly et al., 2014) data from several threat
intelligence sources has to be combined in order to
get actionable information. While several sources for
consolidated feeds exist, the aggregation process is
often opaque, and their quality is unknown.
To address this problem, we propose FeedMe-
ter, a platform for automated collection, normaliza-
tion, aggregation, metadata-enrichment, and rating of
various OSINT feeds. The collected feeds are la-
54
Rüedlinger, A., Klauser, R., Lamprakis, P., Happe, M., Tellenbach, B., Veyisoglu, O. and Trammell, A.
FeedMeter: Evaluating the Quality of Community-Driven Threat Intelligence.
DOI: 10.5220/0012357600003648
Paper published under CC license (CC BY-NC-ND 4.0)
In Proceedings of the 10th International Conference on Information Systems Security and Privacy (ICISSP 2024), pages 54-66
ISBN: 978-989-758-683-5; ISSN: 2184-4356
Proceedings Copyright © 2024 by SCITEPRESS – Science and Technology Publications, Lda.

beled according to their threat type and continuously
and methodically rated using eight descriptive met-
rics. Together, these metrics approximate the five cri-
teria defined by ENISA, relevant; timely; accurate;
complete; and ingestible (Pawlinski et al., 2014). We
apply seven already known metrics, based solely on
feed statistics and OSINT data, and propose our own,
called DNS age in addition. Our CTI platform per-
forms the common, usually laborious tasks in source
evaluation and makes individual searches for informa-
tion sources and their evaluation much more efficient.
The resulting main research questions in this study
are:
1. Can we aggregate, monitor, and evaluate OSINT
CTI feeds continuously and automatically using
only feed data and publicly available OSINT?
2. Can we define metrics that approximate the theo-
retical quality criteria of ENISA and result in an
immediate operational benefit for the end-user?
3. Is the quality of OSINT CTI feeds good enough
compared to commercial feeds?
As our main contributions, we outline the pro-
posed FeedMeter platform, build a prototype, and an-
swer these questions. In Section 2 we describe key
components of the proposed platform, some of the
challenges and their mitigation, and define the de-
scriptive metrics. Section 3 describes the used data
sets ranging from OSINT feeds to a commercial feed
for comparison purposes. Section 4 shows the key re-
sults. The data as well as the results are available on
our interactive website
1
, which can be used to eval-
uate our findings. In Section 5, we conclude that au-
tomatic monitoring of CTI feeds is possible and high-
light the benefits and limitations of the proposed met-
rics regarding their usage as a quality approximation
of the feeds. We show that using commercial CTI
feeds can have advantages, but its quality is not fun-
damentally superior to OSINT feeds.
2 METHODOLOGY
An overview of FeedMeter is outlined in Figure 1.
Different OSINT feeds are downloaded, validated,
normalized, enriched with metadata, aggregated, and
evaluated. The result is an aggregate feed that re-
tains all information of its sources and contains ad-
ditional metadata, such as the results of the con-
tinuously calculated metrics and user feedback from
the community. Additional metadata from OSINT is
1
https://osint-feed-analysis.site
added as well, where it can reduce individual collec-
tion and implementation efforts and provide a tangi-
ble advantage in dealing with threats, e.g. location
data and DNS data. A significant benefit of the Feed-
Meter platform is the possibility to filter the aggre-
gate feed and only query the parts relevant to one’s
threat model. However, compiling such an aggregate
feed poses nontrivial challenges, primarily attributed
to the very heterogeneous landscape of OSINT feeds
and OSINT data sources. The following paragraphs
describe the problems and approaches to solve them.
Where this is not possible, we explain how to mitigate
them.
2.1 Feed Aggregation
Update Intervals. In order to cope with different up-
date intervals and strategies, we aggregated the feeds
over a defined time interval. This results in periodic
snapshots which can be compared to each other.
Data Formats. OSINT feed syntaxes are diverse with
providers utilizing various data formats. For our anal-
ysis, we normalized the data to a set of predefined
types, including IPv4/IPv6 addresses, subnets, Fully
Qualified Domain Name (FQDNs), and URLs. Nor-
malization efforts mostly consists of simple actions
such as converting to lowercase or IPv6 address com-
pression. Addressing several nontrivial cases are out
of scope of this paper.
Semantic Meaning. Labels. are used to specify
the meaning of different OSINT feeds and indica-
tor. However, as criticized by (Metcalf and Spring,
2015, Li et al., 2019), there is no standardized set of
labels. This normalization step is particularly chal-
lenging and generally has to be performed manually.
With FeedMeter we introduce an hierarchical tax-
onomy where child labels have a more confined and
detailed meaning than their parent. This approach has
the advantage that no information from the original
label is lost. Additionally, the taxonomy can easily be
extended and adapted as the threat landscape evolves.
In this paper, we focus on the labels shown in Table 1.
Licensing. When aggregating feeds, we respected
and preserved all license information by tagging them
correspondingly so that potential users can select the
feeds that correspond to their licensing needs.
Aggregation. We deduplicated and aggregated the
normalized indicators while preserving all semantic
meaning, origins, and relevant additional metadata
provided by the sources. Additional metadata from
other OSINT sources could be added during this step.
FeedMeter: Evaluating the Quality of Community-Driven Threat Intelligence
55
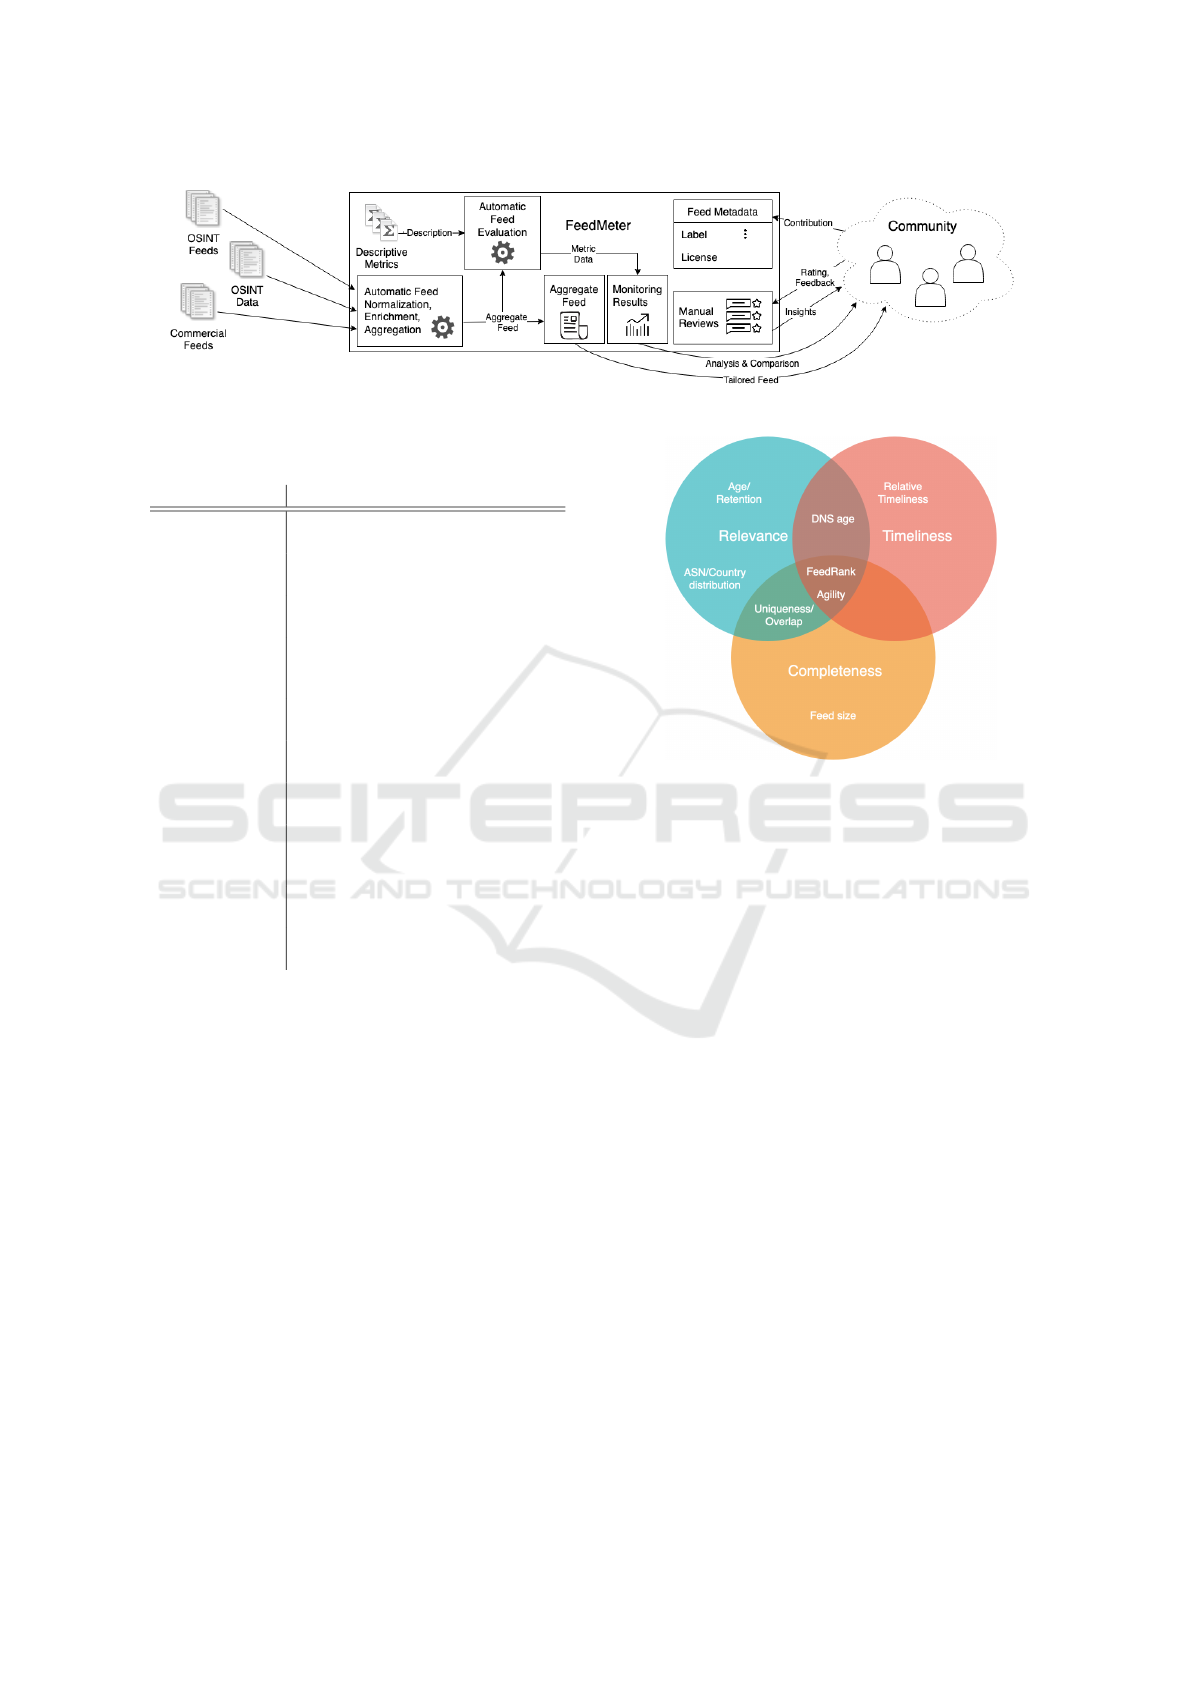
Figure 1: Architecture overview of FeedMeter.
Table 1: Overview of labels representing the semantic
meaning of feeds.
Label Meaning
Malware C&C and malware distribution
servers, hosts belonging to a botnet
Spam Hosts distributing spam through
emails or web forms
Phishing Hosts sending phishing mails or
serving phishing sites
Attacks Origins of active attacks, such as
port scanning, brute force attacks,
exploitation attempts, etc.
Crime & Fraud Other bad actors, unrelated to active
attacks: cybercrime, fraud, etc.
Anonymization Tor nodes, web proxies, VPN gate-
ways, etc.
Cryptocurrency Nodes in cryptocurrency networks
and cryptojacking hosts
Info Generic host or network informa-
tion, such as routable and un-
routable address spaces
Consolidation Feeds consolidating other feeds
with possibly many different labels
Reputation Hosts serving porn, gambling, on-
line pharmacy sites, etc.
2.2 Descriptive Metrics
ENISA (Pawlinski et al., 2014) proposed a set of the-
oretical quality criteria for the assessment of Threat
Intelligence Feeds: relevance, timeliness, accuracy
completeness and Ingestibility of the CTI. However,
those criteria cannot simply be applied to an auto-
mated evaluation, since some are subjective and oth-
ers require a ground truth.
In order to approximate those theoretical metrics,
we selected seven metrics from previous work that
can be calculated using only openly available data.
Additionally, we propose a new metric called DNS
age. Figure 2 shows an overview of the used metrics
in the context of the theoretical quality criteria. To
keep the figure concise, we only show the three the-
oretical criteria with the most relation to our metrics,
relevance, completeness, and timeliness. The follow-
ing paragraphs describe the rationale behind the se-
Figure 2: Mapping of the proposed metrics to the three qual-
ity criteria, Relevance, Completeness, and Timeliness.
lected metrics in detail.
Feed Size. The feed size helps to understand the
feed’s coverage better. Even if the total number of en-
tries needed for a feed for full coverage is unknown,
more entries mean more coverage (assuming no false
negatives).
Agility. The agility of the feed can give valuable in-
sights into how the maintainer curates a feed and how
frequently and to what extent something changes.
Therefore, an addition and a removal metric is used.
The first evaluates the timeliness of a feed. The sec-
ond assesses the relevance and completeness of the
feed and if additional post-processing is needed, like
manually dropping entries according to a retention
policy. To capture all the aspects of agility, we de-
fine 3 metrics for both types of updates: the update
frequency, the absolute update size, and the relative
update size
Uniqueness and Overlap. The uniqueness and the
overlap of a feed give insight into its relevance: it
might help decide if adding the feed is worth the ef-
fort, in both complexity and expenses. As pointed
out in previous work (Metcalf and Spring, 2015, Li
et al., 2019), a low overlap of two feeds means that
each feed does not provide enough information about
the threat landscape, and we are far from a complete
threat feed.
ICISSP 2024 - 10th International Conference on Information Systems Security and Privacy
56

Relative Timeliness. Relative timely feeds provide
a time advantage for the establishment of preventive
measures as compared to feeds that are less timely.
FeedRank. The FeedRank (Meier et al., 2018) pro-
vides insights into several quality dimensions: The
contribution analysis helps to understand the rele-
vance and completeness. The correlation part of Fee-
dRank is an approximation of the accuracy (confirma-
tion of entries) and the (relative) timeliness of a feed.
ASN and Country Distribution. While ASN and
country distributions do not accurately represent the
origin of threats, they can be used in the context of
feed quality evaluation. Here, they show whether a
feed is biased towards a certain ASN or country (e.g.,
due to sensors being present only in that part of the
network). Organizations can use this information to
make a determination whether a feed is relevant for
their use case.
Entry Age and Retention. We define the following
four key characteristics of the age distribution of a
snapshot: the percentage of fresh entries (age < 24h),
the percentage of recent entries (age < 7 days), the
percentage of stale entries (age > 60 days) and the
median of the age distribution.
The age and retention give, like the agility, in-
sights into how a list is curated and thus its relevance.
Generally, a feed with many new entries is desirable
to face upcoming threats. Still, stale entries can also
be helpful due to recurring attacks or re-using of in-
frastructure by threat actors. The retention can also
help identify if further post-processing is needed in
employing a retention policy.
DNS Age. We propose the new metric DNS age and
define it for FQDN and URL entries as the time be-
tween the first appearance of its Second Level Do-
mains (SLD) in the DNS and the time it was added
to the feed. We measure the DNS age in days since a
higher resolution is hard to achieve for the DNS ap-
pearance. Since the combination of such DNS ages in
the context of a feed is somewhat intricate, we have
to define several sub-metrics. Either we can only an-
alyze true SLD entries (SLD DNS age distribution),
or we can look at all FQDNs, including sub-domains
and also URLs. In the second case, we further want
to distinguish if we analyze the DNS age of all new
entries (all DNS age distribution) or just those en-
tries that correspond to an SLD that has not been
added to the feed since its DNS appearance (first-
seen DNS age distribution). For example, a feed adds
the FQDN “some.domain.com” and later adds “some-
other.domain.com.” The all DNS age distribution in-
cludes the DNS age for both entry additions. Since
they have the same SLD (domain.com), the first-seen
DNS age distribution only includes the DNS age of
the first entry addition. Besides analyzing the data
series metrics for these distributions, we additionally
define meaningful key metrics for them, listed in Ta-
ble 2.
A high rate of fresh entries can attribute a feed to
good timeliness. On the contrary, an increased num-
ber of stale entries does not imply low timeliness.
A threat can also emerge from an FQDN registered
a long time ago but not from an FQDN that is not
present yet in the DNS. Not registered and expired
entries can tell something about the accuracy and rel-
evance of the feed. And finally, future entries can
in some cases, e.g., for domain generation algorithm
(DGA) feeds, give insight into how well the feeds can
“predict the future,” namely if the listed entries are
used in practice.
3 DATASETS
We collected, stored and aggregated more than 150
OSINT feeds, primarily threat information, from a
variety of public intelligence sources between March
2018 and April 2022. The exact number of collected
feeds fluctuated throughout this period as we added
new sources or removed discontinued ones. Avail-
ability and reliability of these sources was inconsis-
tent, and there were a few short outages in our own
collection infrastructure, e.g., due to maintenance.
The nature of these feeds is very heterogeneous,
both in the structure of the data as well as the process
in which they are created. There are simple lists of
indicators as well as labeled, metadata enriched, and
well-structured databases, feeds manually maintained
by individuals, community-driven databases, and au-
tomatically generated feeds. To be included in our
body, the feeds had to be actively updated and pro-
vide one of the data types we wanted.
3.1 Collection, Normalization and
Labeling
We downloaded the feeds according to the specifica-
tion published by the feeds. For feeds without a spec-
ification we used an interval of 5 minutes. We per-
formed the validation and normalization steps as well
as the labeling as explained in Section 2.1.
3.2 Additional OSINT Data
For the computation of several metrics we need addi-
tional OSINT data, which we collected as follows:
Geolocation. We downloaded the free version of
FeedMeter: Evaluating the Quality of Community-Driven Threat Intelligence
57
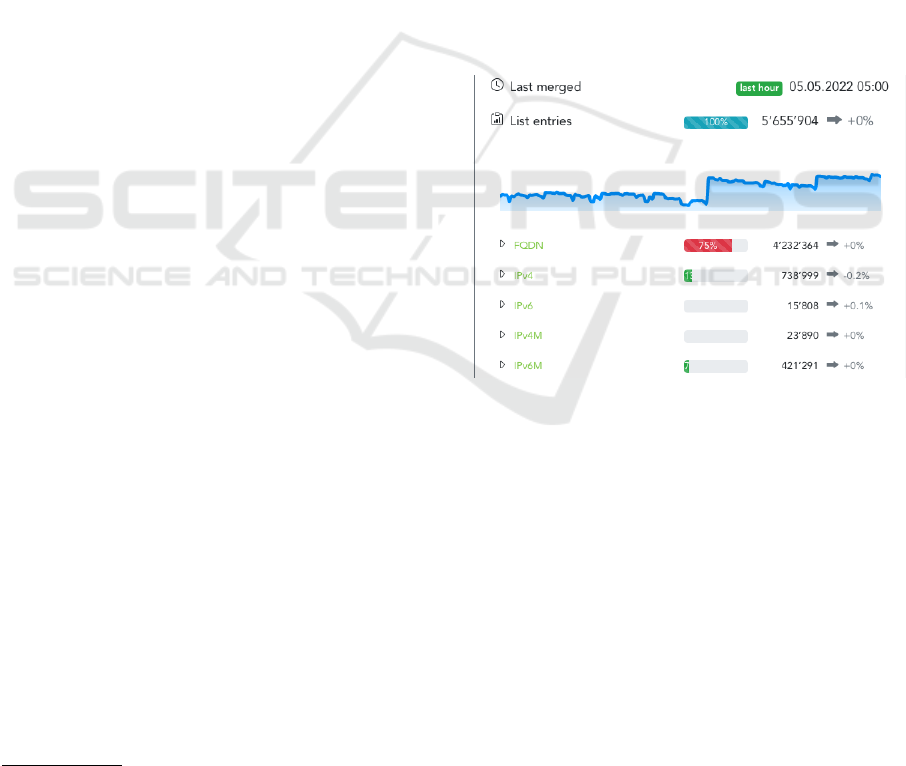
Table 2: DNS age key metrics.
0-day entries ratio of entries with DNS age = 0
fresh entries ratio of entries with DNS age ≤ 3 days
recent entries ratio of entries with DNS age ≤ 30 days
stale entries ratio of entries with DNS age > 365 days
10% most recent entries 10th percentile DNS age
unknown entries ratio of entries with DNS appearance before start of our DNS data collection
not registered entries ratio of entries where SLD never in DNS zone
expired entries ratio of entries where SLD previously in DNS zone but removed
future entries ratio of entries where SLD added to DNS zone after entry added
the MaxMind database called GeoLite2
2
every week
from December 2019 to April 2022 and used it to look
up and store the ISO 3166-1 country code of all IP ad-
dresses within the collected feeds.
Autonomous Systems. For ASN determination we
used the BGP Routing Report
3
by Philip Smith which
publishes border gateway protocol (BGP) routing ta-
ble data from several geographical regions on a daily
basis. We used the data from the London Internet Ex-
change (LINX), as it is the location geographically
closest to us. During outages of this location we
switched to the data collected in Brisbane, Australia.
Domain Name System. We downloaded the zone
files of more than 1,000 TLDs on a daily basis from
August 2019 to April 2022, including .com, the most
prevalent TLD. We used the resulting data to build a
comprehensive domain database to analyze the DNS
age of FQDNs and URLs within the collected feeds.
3.3 Commercial Reference Feed
We were granted access to an aggregate feed by a
prevalent commercial CTI provider for six months
and downloaded it every 5 minutes from June 2019
to December 2019. The feed consists of entries la-
beled as either spam and abuse, phishing, malware,
or cracked sites using a bit mask. The labels match
with our taxonomy with the exception of cracked sites
which is represented by our label crime & fraud.
3.4 Aggregation
We aggregated the collected and normalized feeds
hourly, resulting in periodic snapshots of the entire
indicator body. For feeds collected once per hour or
more often, all data collected since the last aggrega-
tion was used. For feeds collected less often, the latest
feed was used. Feeds for which we had more than one
consecutive collection failure were not included.
2
https://dev.maxmind.com/geoip/geolite2-free-geoloc
ation-data?lang=en
3
https://thyme.apnic.net/
For all feeds, a reference to the originating feeds
including source labels and any additional metadata
originating from the sources was preserved.
4 RESULTS
4.1 Automatic Metric Evaluation
Figure 3: Screenshot of the threat feed live monitoring dash-
board.
In parallel to collecting and aggregating OSINT
threat feed data for four years, we set up and oper-
ated a platform to monitor and evaluate the feeds us-
ing the proposed metrics, called FeedMeter. FeedMe-
ter shows our vision of a platform where the threat
feed metadata can be analyzed in real-time but also
be studied historically. Figure 3 shows an extract of
the status dashboard of this platform. For the thor-
ough analysis of the proposed metrics, we extracted
different samples from the 4-year evaluation data. In
doing so, we can also evaluate whether the findings
for a metric in one evaluation period can be repro-
duced in a similar period at a later time. Table 3 gives
an overview over the chosen samples, their evaluation
periods, and for which kind of analysis in this work
the sample was used for. Where not noted otherwise,
we refer to the main sample in the results.
ICISSP 2024 - 10th International Conference on Information Systems Security and Privacy
58
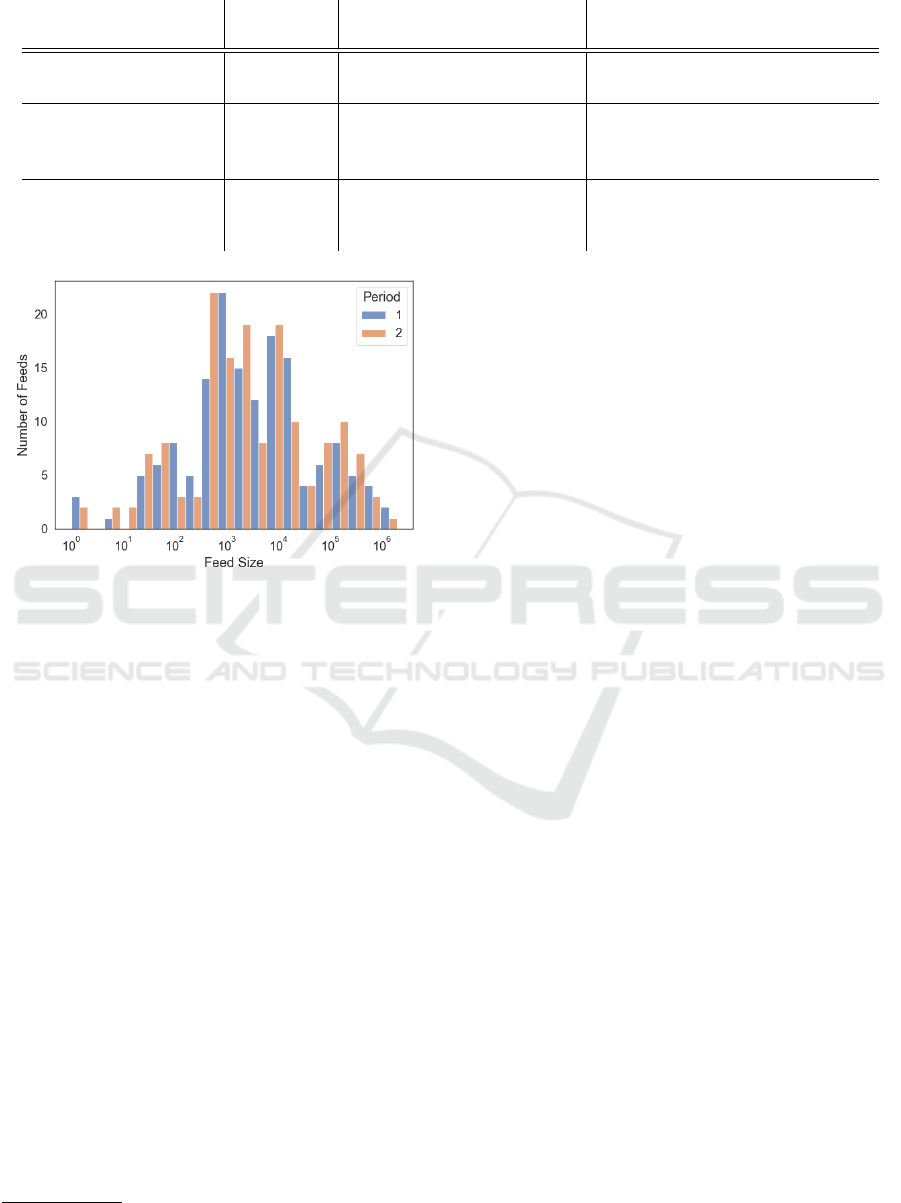
Table 3: Overview of the used evaluation samples.
Sample Period du-
ration
Periods Description
Main sample 6 months 2020-10-01 - 2021-04-01 Main sample, all feeds
2021-10-01 - 2022-04-01 all metrics except DNS age
DNS age sample 3 months 2020-09-01 - 2020-12-01 FQDN and URL feeds,
2021-04-01 - 2021-07-01 DNS age only
2021-12-01 - 2022-03-01
Comparison sample 6 months 2019-06-23 - 2019-12-03 Period with access to the commer-
cial feed to analyze OSINT vs.
commercial feeds
Figure 4: Median feed size distribution of the two main
sample periods.
In the following, we show a small extract of the
evaluation results. The full results can be studied on
our results website
4
.
Feed Size. Figure 4 shows the median size distribu-
tion of the evaluated feeds that were active in both pe-
riods. The size varies substantially, from feeds with
only a handful of entries to feeds with several hun-
dreds of thousands. The analysis of the feed size vari-
ability shows that most of the feeds have a quite stable
feed size.
Agility. To analyze the agility of the feeds, we look at
the joint distribution of the update frequency and the
relative update size for both additions and removals,
as shown in Figure 5. A data point reflects the me-
dian value of the corresponding metric of one feed in
a period. Note that the normalization of the update
frequency is relative to their respective update inter-
val. This can lead to a bias to the value claimed by
the provider or chosen by us, if the update interval
is higher than our aggregation interval of one hour,
and has to be considered when evaluating the update
frequency of a feed. As can be seen in the figure,
most of the feeds are updated very regularly. 42% of
the feeds add new entries in every second update or
4
https://osint-feed-analysis.site
more and 36% of them remove entries in at least 50%
of updates. However, more than half of them have
an update interval > 1h. The analysis also uncovers
feeds that rarely change. 13% of the feeds almost
never add new entries and 15% of the feeds almost
never remove entries. On the other hand, the distribu-
tion of the relative update sizes shows that most of the
feeds change very few of their entries during an up-
date. 70% of the feeds have relative addition sizes be-
low 3%, and relative removal sizes below 5%. There
were, however, feeds with a very high agility. Namely
the feed tracker.h3x.eu malware corpus, an event feed
with 24h update interval, delivered on the promise to
only list entries from the last day and showed a com-
plete change of the content in every update interval.
Uniqueness and Overlap. The overall uniqueness of
all entries in the two evaluation periods is 77% and
78%. It has to be noted that there is some inher-
ent overlap of several related feeds by the same feed
provider (e.g. blocklist.de SSH attackers and block-
list.de all attackers) reducing the overall uniqueness
by some percentages. Similarly to Li et al. (Li et al.,
2019), we analyzed the relative overlap of the feeds,
especially when looking at their labels. In contrast
to their finding, we could not find any labels with
significantly higher internal overlap or with signif-
icant cross-label overlap. The visualization of this
grouped overlap matrix just confirmed our expecta-
tion that feed variants of the same provider have a
high overlap. It also confirmed the labeling of the
consolidation feeds. The feeds with this label con-
solidate entries with potentially very different labels
in one feed. And, indeed, most of them overlap with
many different feeds from all kinds of labels.
Relative Timeliness. For more than 60% of feeds,
over 50% of the shared entries are untimely. The
most prevalent examples were the two consolidation
feeds of missdeer blocklist in which many of shared
entries were untimely. Additionally, two of the net-
lab.360.com feeds included all of their entries in an
untimely manner.
FeedMeter: Evaluating the Quality of Community-Driven Threat Intelligence
59
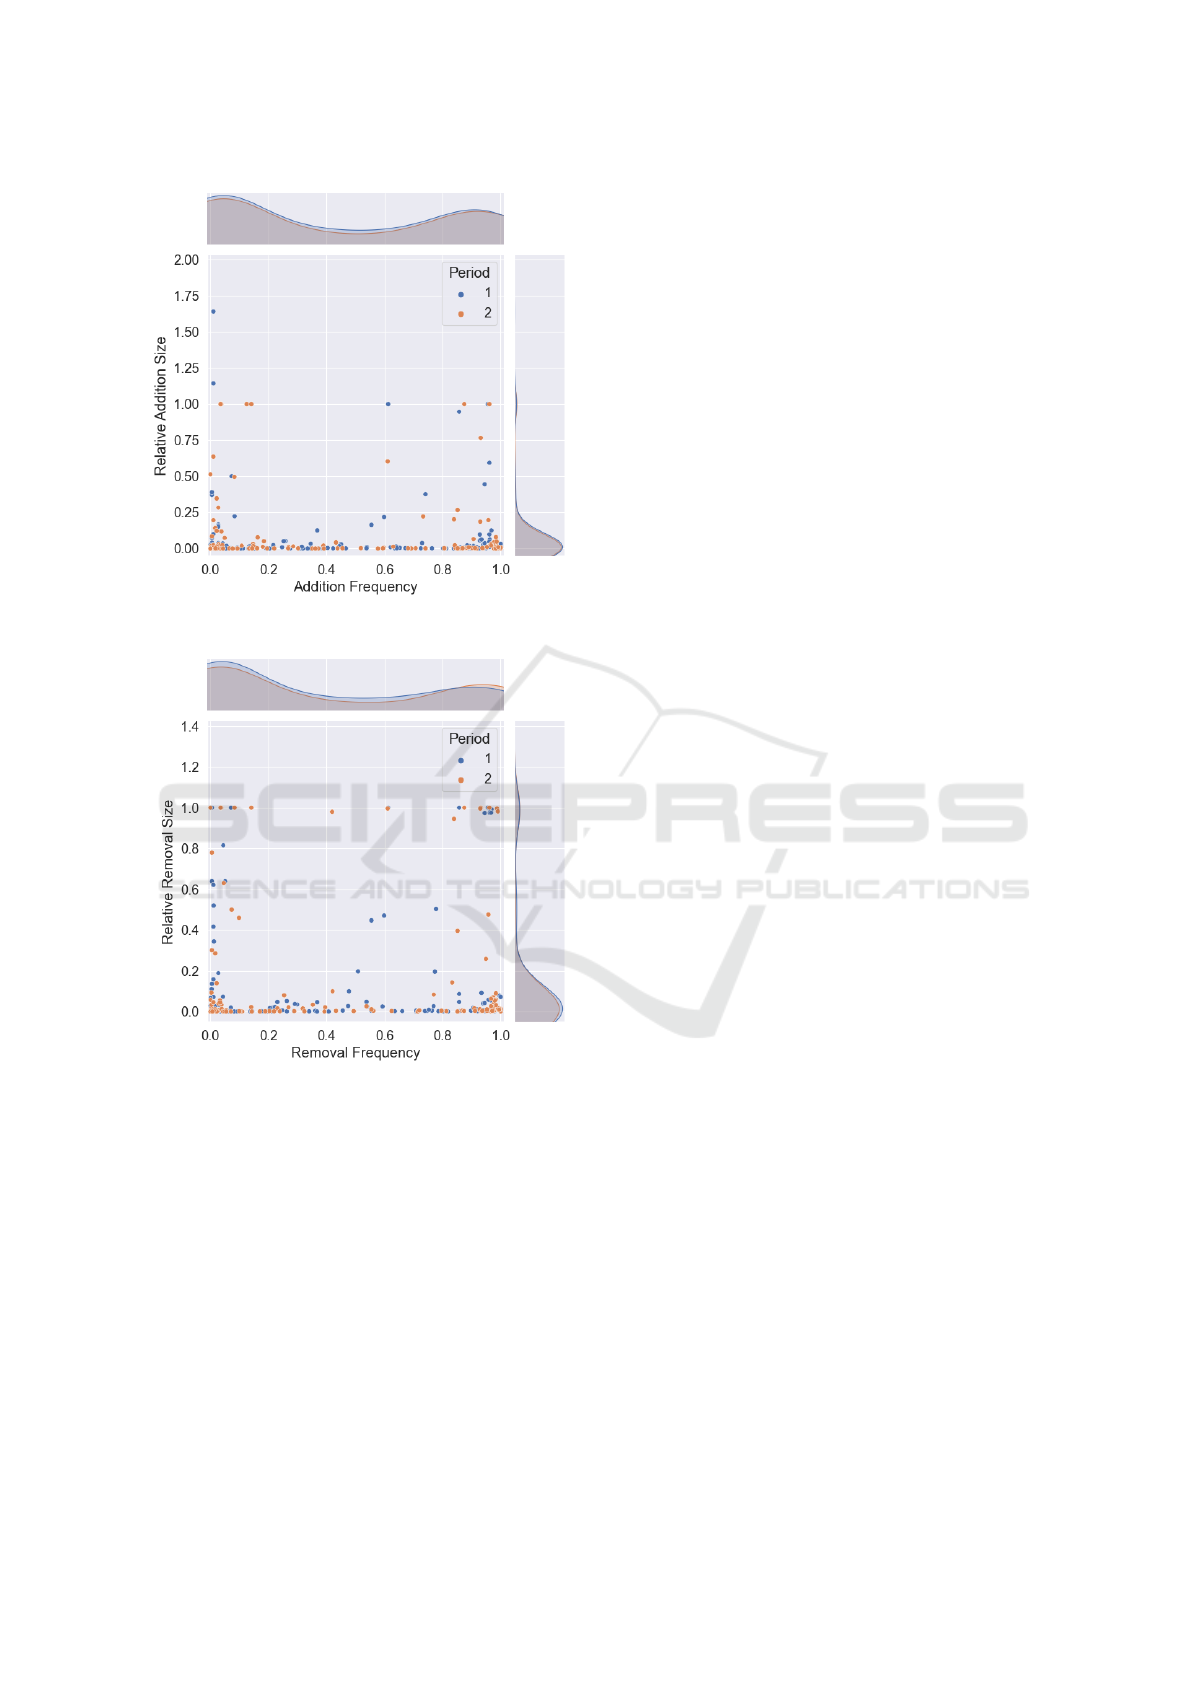
(a) Feed addition agility.
(b) Feed removal agility.
Figure 5: Feed agility addition and removal distribution
with the marginal frequency and relative size marginal dis-
tribution.
FeedRank. In Table 4, we list for both periods the
top 3 for the contribution and the correlation met-
ric. In general, we can see that feeds with a good
contribution also have a good FeedRank. In contrast,
the feeds with the best correlation cannot outweigh a
mediocre contribution performance and end up in the
upper-middle range of the FeedRank ranking.
By definition, FeedRank aims to provide a tamper
resilient combination metric. However, our evalua-
tion shows that large feeds are favored, and tampering
attempts by including fake entries could be a problem.
To efficiently detect tampering attempts, this metric
alone is not enough. Nevertheless, to decide between
two feeds in the same feed size order, the metric is
considered accurate.
ASN and Country Distribution. To obtain reference
distributions, we approximate the ratio of an ASN and
a country by dividing the number of IPv4 addresses
allocated by the total number of allocated IPv4 ad-
dresses for an ASN and a country, respectively. Ta-
ble 5 lists all the ASNs that had a share of > 10%
on at least two feeds in one of the evaluation periods.
Many of them are known large service providers with
a substantial share of several million IPv4 addresses.
Still, high ratios far above the reference ratio like the
ones in the max columns should be considered as an
anomaly most likely originating in a network bias of
the feed provider.
For the country distribution, we expect the US to
dominate in the feeds since its ratio of allocated IPs is
over 40%. Table 6 lists the prominent countries with
at least two feeds having a country ratio of > 10%
in a period. The US is confirmed to be listed very
prominent by almost all IP feeds. The other promi-
nent countries are also mostly represented according
to their reference ratio as can be seen by the median
ratios. But the very high maximum ratios again indi-
cate that there might be a network bias in the under-
lying feed. Table 7 lists the most suspicious feeds for
such a bias, with a median ratio of > 40% for one of
the countries (except US).
Entry Age and Retention. Only 9 feeds had more
than 50% fresh entries. Still, the freshness of the en-
tries were substantial for 32 of the feeds with more
than 50% recent entries. On the other hand, about half
of the analyzed feeds contain more than 75% stale en-
tries. In the case where threat indicators have long
lifetime, such stale entries are legitimate and even
desirable. In contrary, in the context of short-lived
threats, stale entries can be seen as a sign of lacking
curation. This is another important reason for proper
labeling of CTI feeds, as the semantic meaning is im-
portant for the significance of indicators being stale.
Regarding retention, the times after which entries
get removed from the feeds vary widely. There are
what we call fast removers, 15 feeds where 90% of the
removed entries are being removed in the first three
days after being added. Another 25 feeds (40 in pe-
riod 2) have at most 30 days retention for 90% of the
removed entries. And there are the slow removers, 53
feeds (38 in period 2) in which more than half of the
removed entries have a retention of over 100 days.
DNS Age. In our evaluation, which was done for
this metric using the DNS sample as described in Ta-
ICISSP 2024 - 10th International Conference on Information Systems Security and Privacy
60
Table 4: FeedRank table excerpt listing the top 3 (bold-faced) feeds for contribution and correlation in either period 1 (P1) or
period 2 (P2), sorted by the average FeedRank.
Feed Contribution Correlation FeedRank
P1 P2 P1 P2 P1 P2 Avg
blocklist.site porn 1 1 142 128 1 1 1
missdeer blocklist 3 4 10 13 3 4 3.5
abuse.ch URLhaus database 2 8 13 17 2 8 5
blocklist.site malware 5 3 78 67 5 5 5
Mitchell Krog - Ultimate Hosts File 8 2 128 121 9 2 5.5
aggregated hosts file by Steven Black 26 116 3 1 15 18 16.5
anti-webminer crypto 116 85 1 2 16 23 19.5
torproject.org exit addresses 83 24 2 6 20 19 19.5
phishing.army blocklist 40 29 4 3 23 22 22.5
Table 5: List of prominent ASN on IP threat feeds.
ASN Median Max # Feeds > 10% Reference
P1 P2 P1 P2 P1 P2
14061 DigitalOcean (US) 4% 3% 36% 57% 17 12 0.1%
45090 Shenzen Tencent Computer Systems (CN) 0% 0% 19% 21% 12 2 0.2%
16276 OVH (FR) 4% 1% 20% 20% 5 2 0.1%
4134 Chinanet (CN) 1% 1% 18% 18% 3 4 3.0%
14618 Amazon (US) 0% 0% 40% 39% 1 2 0.4%
4837 China Unicom (CN) 1% 1% 10% 31% 1 2 1.6%
24086 Viettel (VN) 0% 0% 0% 19% 0 2 0.0%
7552 Viettel (VN) 0% 0% 0% 12% 0 2 0.1%
12876 Online (FR) 0% 0% 12% 7% 2 0 0.0%
15169 Google (US) 0% 0% 11% 7% 2 0 0.4%
ble 3, we see that more than 70% of the added SLDs
(for which the matching TLD zone file was available)
were covered by our zone files. Looking at the SLDs
in all added FQDN and URL entries, the coverage was
even higher than 85% and thus we can conclude that
we have a representative data set to evaluate the new
metric.
One of the benefits of the new DNS age metric is
the possibility to analyze the ratio of not registered
entries. For the evaluated feeds, most of them had a
ratio of not registered entries of below 5%. A higher
ratio is most prominently visible on DGA feeds. It
is, however, the intent of these feeds to list domains
that were generated by an algorithm and that could
potentially be used by a C2 server for communica-
tion. As only a few of these generated domains are
actually used in practice, this high ratio of domains
not in the DNS zone is expected. To be of any op-
erational benefit, such a feed should still have a sub-
stantial part of its entries appearing in the DNS zone.
Table 8 shows the largest DGA feeds and the DNS
zone registration status of their new entries, compar-
ing period 1 and period 3. netlab.360.com dircrypt
DGA list has a high ratio of 86% registered entries in
the first period, whereas in period 3 the ratio dropped
significantly. Many added domains were expired or
future entries. Also, netlab.360.com matsnu DGA list
had a decent registered ratio of new entries in period
1 and a drop in period 3, whereas the other two feeds
in the table show very low ratios of registered entries
in all analyzed periods.
Looking at the fresh and stale entries on the feeds,
we see that the phishing related feeds have a high
ratio of fresh or even 0-day entries. This is desir-
able in the context of rapidly changing and short-
lived phishing campaigns, but could not be taken as
granted for OSINT feeds. For the stale entries, we
see that some feeds have a high number of added en-
tries that were already added to the DNS zone more
than a year ago, which can be a sign of untimely en-
tries or for threats that are stable over a long period of
time. In this case, ideally, it would have been listed
from when it appeared in the DNS zone. Figure 6 vi-
sualizes the cumulative DNS age distribution of the
feeds with mainly fresh and stale entries respectively.
Feeds were added to Figure 6 (a) if the ratio of fresh
FeedMeter: Evaluating the Quality of Community-Driven Threat Intelligence
61

Table 6: List of prominent countries on IP threat feeds.
Country Median Max # Feeds > 10% Reference
P1 P2 P1 P2 P1 P2
US 16% 22% 68% 67% 62 61 41%
CN 5% 10% 41% 49% 27 25 9%
DE 4% 6% 39% 26% 10 11 3%
FR 3% 3% 23% 21% 6 2 3%
RU 3% 4% 23% 21% 10 6 1%
IN 3% 3% 28% 13% 4 3 1%
BR 2% 2% 56% 17% 3 1 1%
NL 2% 3% 100% 20% 3 2 1%
GB 2% 3% 13% 40% 3 1 3%
VN 1% 2% 10% 31% 1 2 0%
Table 7: List of feeds with unnaturally prominent country.
Feed Country Median ratio
P1 P2
greensnow.co attack blocklist CN 41% 21%
gpf-comics.com DNS blocklist IPv6 NL 100% 0%
gpf-comics.com DNS blocklist IPv6 CZ 0% 100%
charles.the-haleys.org SMTP attack list BR 56% 17%
alienvault.com brute force list CN 37% 49%
darklist.de Ips CN 39% 43%
entries was > 0.3, and added to Figure 6 (b) if the ra-
tio of stale and unknown entries was > 0.5. All the
feeds in the figure have > 100 added entries covered
by our DNS zone files during the evaluation period.
Unknown entries are treated like stale entries in this
figure. We do not know the exact DNS age of them
but we know that they were in the DNS zone since we
started to collect the data, and thus they must be older
than all the other entries. For simplification, we used
a placeholder age of 1000 days in the figure, resulting
in a steep increase at age 1000 for many of the feeds.
For this evaluation, we used the metric variant first-
seen DNS age distribution and the data from period 2.
In general, we see from the results that all three metric
variants (SLD, all, and first-seen) produce comparable
results and none of them seems to outperform the oth-
ers. But depending on the use-case of an evaluation,
one of the variants could still be preferable, due to
some of its unique characteristics.
4.2 Comparison with Commercial Feed
To evaluate the proposed metrics further and to set
the previous results in the context of the results of a
professionally maintained feed, we analyze the com-
parison sample including the commercial feed in the
following. The commercial feed contains only FQDN
entries and renders the evaluation of ASN and coun-
try distribution obsolete. In general, the commercial
feed showed promising results for most of the met-
rics. The feed size was large for its spam feed, com-
parably large for its phishing feed, but rather small for
its malware and cracked sites feed. The agility of the
feeds was good with frequent updates for all of the
sub feeds except malware, and reasonably good up-
date sizes. The uniqueness and overlap showed that
the feed has a real benefit by providing data that no
other feeds already contains. The high uniqueness of
the feeds also renders the timeliness analysis obso-
lete. In the FeedRank evaluation, the contribution was
the best of the analyzed feeds, whereas the correlation
was negligible due to the lack of shared entries. Still,
the overall and the large spam sub feed were ranked
at the top of the FeedRank ranking. The results of
the commercial feed regarding age and retention dis-
tribution are slightly worse than for the previous met-
rics. The age distribution shows 75% of stale entries
and only 4% of recent entries. Evaluating the reten-
tion distribution, we see a big difference between the
spam sub feed and the others. On the spam feed, 25%
of the removed entries were on the feed for more the
116 days. In contrary, the median retention of mal-
ware, cracked sites and phishing were 3, 13, and 22
days respectively. This is likely due to a generally
higher retention policy for spam entries.
If the age distribution results might be a sign for
ICISSP 2024 - 10th International Conference on Information Systems Security and Privacy
62
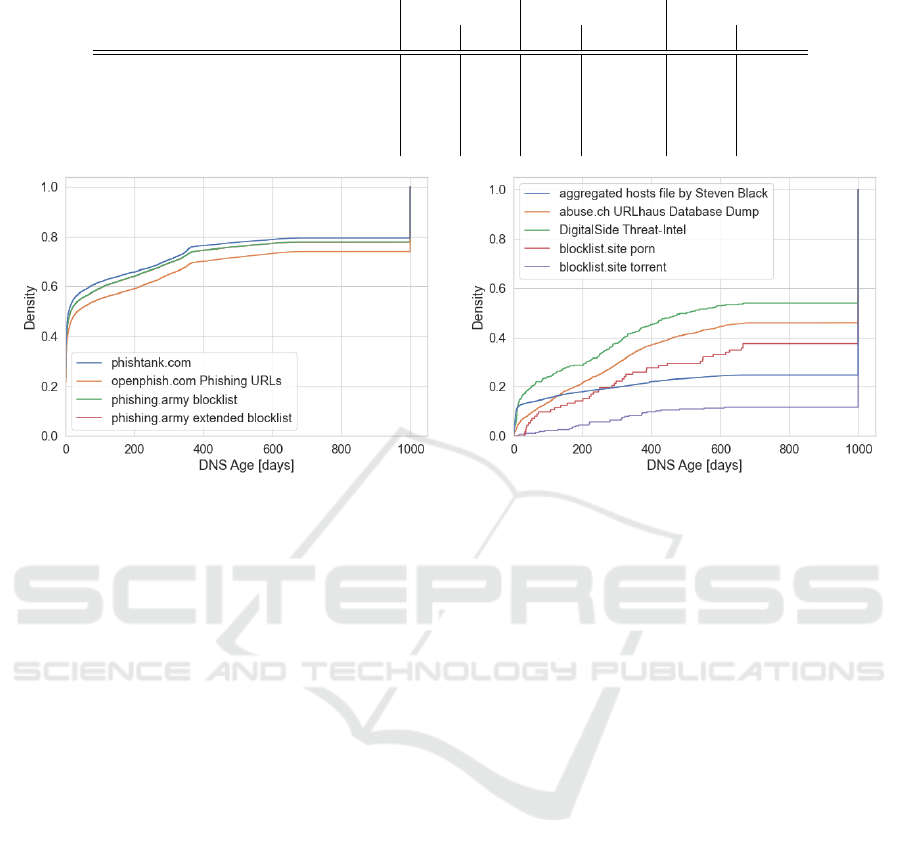
Table 8: List of DGA feeds and the zone registration status of their new entries.
Feed Registered Expired/Future Not Registered
P1 P3 P1 P3 P1 P3
netlab.360.com conficker DGA list 1% 1% 0% 1% 99% 99%
netlab.360.com dircrypt DGA list 86% 48% 14% 52% 0% 0%
netlab.360.com matsnu DGA list 33% 6% 2% 2% 65% 92%
netlab.360.com tofsee DGA list 0% 0% 0% 1% 100% 99%
(a) DNS age distribution of feeds with > 30% fresh entries. (b) DNS age distribution of feeds with > 50% stale entries.
Figure 6: Cumulative DNS age distribution of feeds of chosen feeds.
untimely information on the commercial feed, the
analysis of the DNS age, shows noteworthy results
that suggests that at least what is added to the feed
is timely and fresh information. As can be seen in
Table 9, especially the spam and phishing sub feeds
added many entries that were recently added to the
DNS zone. The ratio of stale and not registered en-
tries were low on all sub feeds.
The commercial feed showed good results in al-
most all metrics. Since we assume good quality of
the commercial threat feed we conclude that the met-
rics are actually well suited to assess the quality of a
threat feed.
5 DISCUSSION
5.1 Selected Metrics
Due to the lack of perfect knowledge and the often
subjective nature of threat information, it is challeng-
ing to evaluate OSINT CTI feeds objectively and au-
tomatically. In this work, we can show that the eight
selected metrics work reasonably well and are solid
measures for feed quality in the real world. It is im-
portant to note that the significance of negative state-
ments is generally much stronger. Feeds that are rel-
atively untimely are indeed untimely, whereas rela-
tively timely feeds are not necessarily timely in a
global context. Other metrics show similar proper-
ties of favoring negative statements: domains not reg-
istered in the DNS zone are irrelevant, and the ab-
sence of additions is a lack of information about new
threats. Positive statements are much harder to make,
and even if some can be found, there will always be
uncertainty without a ground truth. Despite these dif-
ficulties with positive statements, the metrics work
well in a generalized context and even better for spe-
cific use-cases. For example, the evaluation results
show that the DNS age metric works well for phish-
ing detection, as the freshness of entries is high for
some feeds. Using them in a platform like FeedMeter
would result in a tangible benefit compared to today’s
state of OSINT CTI feed deployment.
5.2 Labeling
A feed can quickly become unfit for operational use,
if the labeling of a feed does not provide enough de-
tail. Additionally, normalizing the various labels used
by different feed providers is laborious and challeng-
ing, especially for per-indicator labels. A platform
such as FeedMeter could be a significant contributor
to establishing a taxonomy, and we believe that our hi-
erarchical approach, briefly described in Section 2.1,
is a sound and extensible basis.
FeedMeter: Evaluating the Quality of Community-Driven Threat Intelligence
63

Table 9: DNS age results of the commercial feed.
Sub feed 0-Day Fresh Recent Stale Not registered
Spam 25% 37% 47% 0% 4%
Phishing 16% 30% 47% 0% 2%
Malware 1% 3% 12% 0% 0%
Cracked Sites 0% 2% 9% 0% 0%
5.3 Limitations
While we can show that the selected metrics do pro-
vide a tangible benefit, there are some questions our
study does not answer. The high uniqueness and small
overlap between the feeds confine its significance pri-
marily to consolidation feeds and negatively impact
the relative timeliness and FeedRank metrics. Per-
haps it is an inherent property of the vast threat land-
scape, or it could simply root in our feed selection
and implementation. Further work should handle the
inclusion of additional sources, nontrivial normaliza-
tion cases, unidirectional overlap checks (such as IP
subnets and IP addresses), and the adjustment of Fee-
dRank weights.
Our approach for building a corpus of DNS data is
incomplete: not all registries provide access to their
zone files, operators of country code top-level do-
mains (ccTLD) in particular. Additionally, these zone
files only contain information about SLDs but not
third- and lower-level domains. Despite these limita-
tions, the DNS age works well as a metric. We know
that the data in the accessible zone files provides a
full picture of its SLDs, whereas this is not certain
with additional third-party data. Nonetheless, includ-
ing additional sources in the future could be benefi-
cial.
In our prototype, we only use descriptions by the
feed provider to assign labels to entire feeds. How-
ever, some feeds contain additional metadata, such as
malware names in the abuse.ch ThreatFox Database
5
.
Mapping such metadata to more specific labels on a
per-indicator basis is challenging, but could provide
more detailed insight into the metrics and feeds.
The fourth limitation is the constricted compari-
son with commercial CTI feeds. We only compared
the metrics of the OSINT feeds to a single commer-
cial feed, which is a result of commercial feeds of-
ten being expensive. The feed used in this study was
kindly provided to us free of charge. Further research
into comparing the quality of OSINT and commercial
CTI feeds and where they provide tangible benefits
respectively would be advantageous.
5
https://threatfox.abuse.ch/
6 RELATED WORK
The quality of CIT feeds is of high interest and has
been studied intensively since the very beginning of
using threat intelligence in the form of blocklists. In
Section 2.2, we introduced the theoretical quality cri-
teria defined by ENISA (Pawlinski et al., 2014). Calt-
agirone (Caltagirone, 2016a, Caltagirone, 2016b) and
the NIST (Johnson et al., 2016) also define and dis-
cuss the fundamental quality properties of valuable
threat intelligence and come to very similar crite-
ria. These quality criteria have been studied exten-
sively and applied in practice to existing CTI feeds
by approximating them using proprietary or manu-
ally crafted reference data. Table 10 relates these
studies to the quality criteria they studied and the
threat type they focused on. Due to the limited prac-
ticability of these criteria, various new metrics have
been introduced to approximate the quality of CTI
in a more simple and reproducible manner. Metcalf
and Spring studied the overlap (Metcalf and Spring,
2013) as well as the feed size, uniqueness, intersec-
tion, and pairwise timeliness (Metcalf and Spring,
2015) of CTI feeds. Pinto et al. (Pinto and Maxwell,
2014, Pinto and Sieira, 2015, Pinto and Maxwell, )
formally defined the metrics novelty, overlap, pop-
ulation, country and ASN distribution, aging, and
uniqueness and applied the metrics to several CTI
feeds in two evaluation periods. Meier et al. (Meier
et al., 2018) propose FeedRank and apply and evalu-
ate it using a set of CTI feeds. The recent work of Li
et al. (Li et al., 2019) had a very similar goal to our
work regarding the requirements of suitable metrics.
The proposed metrics volume, contribution, latency,
coverage, and accuracy should be simple and repro-
ducible using public data. The metrics are applied and
evaluated using several IP and hash CTI feeds, and a
longitudinal study a year later evaluates the stability
of the metrics.
Other studies focused more on a high-level
or multi-dimensional rating of CTI (Qiang et al.,
2018),(Sauerwein et al., 2019),(Schlette et al., 2021).
Regarding automated monitoring of threat intelli-
gence feeds, several pioneers have been sharing their
platforms with the community. Makey (Makey, 2014)
ICISSP 2024 - 10th International Conference on Information Systems Security and Privacy
64

Table 10: Overview of quality criteria studies for different threat types.
Threat type Completeness Accuracy Timeliness
Spam (Jung and Sit, 2004),(Ramachan-
dran and Feamster, 2006),(Ra-
machandran et al., 2006),(Sinha
et al., 2008),(Pitsillidis et al.,
2012)
(Sinha et al., 2008) (Ramachandran et al.,
2006),(Pitsillidis et al.,
2012)
Phishing (Ludl et al., 2007),(Zhang et al.,
2007),(Sheng et al., 2009),(Oest
et al., 2019)
(Zhang et al., 2007),(Sheng
et al., 2009)
(Sheng et al., 2009)
Malware (K
¨
uhrer et al., 2014) (K
¨
uhrer et al., 2014)
Various (Pawli
´
nski et al., 2016) (Pawli
´
nski et al., 2016) (Pawli
´
nski et al., 2016)
monitored the completeness of public spam DNS
blocklists (DNSBL) for 13 years by comparing their
hits to SMTP logs of a mail server. The firewall soft-
ware developer of FireHOL created a monitoring plat-
form of OSINT CTI feeds (FireHOL, ) and has main-
tained it since 2015. The platform includes several
metrics we used in our work but only includes sources
listing IP addresses. Also, to our knowledge, there has
not been any scientific study of the platforms and the
results they produce.
7 CONCLUSION
There is no state-of-the-art method to assess the qual-
ity of the numerous and heterogeneous OSINT threat
intelligence feeds available. In this paper, we have
proposed FeedMeter, a platform that collects, nor-
malizes, and consolidates OSINT threat intelligence
feeds into an aggregate feed. We introduced eight de-
scriptive metrics for automated and continuous moni-
toring, evaluated them on a large corpus of more than
150 OSINT CTI feeds collected over four years, and
made the data publicly accessible. Despite the small
overlap of feeds in our data set and the resulting chal-
lenges in the uniqueness, relative timeliness, and Fee-
dRank metrics, we were able to show the descriptive
metrics’ potential in helping find ones that are suit-
able or unsuitable for operational use. Predominantly
negative assurance of unsuitability is a strength of
some of the metrics. With the continuous and auto-
mated evaluation of these metrics, FeedMeter could
provide a tangible benefit to end-users. We addition-
ally collected a prevalent commercial CTI feed for six
months and repeated the metrics evaluation on this
feed. The results are very similar to a subset of OS-
INT feeds in our corpus, further reinforcing the previ-
ous findings, in both potential and limitations of these
metrics. By providing the resulting aggregate feed re-
taining all source information, applying these metrics
continuously, and making this information about them
transparent, the FeedMeter platform reduces individ-
ual efforts and can make the Internet a more secure
place.
ACKNOWLEDGEMENTS
Innovation project supported by Innosuisse.
REFERENCES
Caltagirone, S. (2016a). CART: The 4 qualities of good
threat intelligence. http://www.activeresponse.org
/the-4-qualities-of- good-threat-intelligence/. Ac-
cessed: 2022-05-05.
Caltagirone, S. (2016b). Questions for evaluating an exter-
nal threat, intelligence source. http://www.activere
sponse.org/questions- for-evaluating- an- external-
threat-intelligence-source/. Accessed: 2022-05-05.
Connolly, J., Davidson, M., and Schmidt, C. (2014). The
trusted automated exchange of indicator information
(taxii). The MITRE Corporation, pages 1–20.
FireHOL. FireHOL IP Lists. http://iplists.firehol.org.
Accessed: 2022-05-05.
Griffioen, H., Booij, T., and Doerr, C. (2020). Quality eval-
uation of cyber threat intelligence feeds. In Interna-
tional Conference on Applied Cryptography and Net-
work Security, pages 277–296. Springer.
Johnson, C., Badger, L., Waltermire, D., Snyder, J., Sko-
rupka, C., et al. (2016). Guide to cyber threat infor-
mation sharing. NIST special publication, 800(150).
Jung, J. and Sit, E. (2004). An empirical study of spam traf-
fic and the use of dns black lists. In Proceedings of
the 4th ACM SIGCOMM conference on Internet mea-
surement, IMC ’04, pages 370–375. Association for
Computing Machinery.
K
¨
uhrer, M., Rossow, C., and Holz, T. (2014). Paint it black:
Evaluating the effectiveness of malware blacklists. In
International Workshop on Recent Advances in Intru-
sion Detection, pages 1–21. Springer.
FeedMeter: Evaluating the Quality of Community-Driven Threat Intelligence
65

Li, V. G., Dunn, M., Pearce, P., McCoy, D., Voelker, G. M.,
and Savage, S. (2019). Reading the tea leaves: A
comparative analysis of threat intelligence. In 28th
USENIX Security Symposium (USENIX Security 19),
pages 851–867.
Ludl, C., McAllister, S., Kirda, E., and Kruegel, C. (2007).
On the effectiveness of techniques to detect phishing
sites. In International Conference on Detection of In-
trusions and Malware, and Vulnerability Assessment,
pages 20–39. Springer.
Makey, J. Blacklists compared. https://www.sdsc.edu/
∼
jef
f/spam/Blacklists Compared.html. Accessed: 2022-
05-05, not available anymore.
Meier, R., Scherrer, C., Gugelmann, D., Lenders, V., and
Vanbever, L. (2018). Feedrank: A tamper-resistant
method for the ranking of cyber threat intelligence
feeds. In 2018 10th International Conference on Cy-
ber Conflict (CyCon), pages 321–344.
Metcalf, L. and Spring, J. M. (2013). Everything you
wanted to know about blacklists but were afraid to
ask. Software Engineering Institute, CERT Coordi-
nation Center, Pittsburgh, PA, Tech. Rep. CERTCC-
2013-39.
Metcalf, L. and Spring, J. M. (2015). Blacklist ecosystem
analysis: Spanning jan 2012 to jun 2014. In Proceed-
ings of the 2nd ACM Workshop on Information Shar-
ing and Collaborative Security, pages 13–22.
Oest, A., Safaei, Y., Doup
´
e, A., Ahn, G.-J., Wardman, B.,
and Tyers, K. (2019). Phishfarm: A scalable frame-
work for measuring the effectiveness of evasion tech-
niques against browser phishing blacklists. In 2019
IEEE Symposium on Security and Privacy (SP), pages
1344–1361. IEEE.
Pawlinski, P., Jaroszewski, P., Kijewski, P., Siewierski, L.,
Jacewicz, P., Zielony, P., and Zuber, R. (2014). Ac-
tionable information for security incident response.
Technical report, ENISA.
Pawli
´
nski, P., Kijewski, P., and Kompanek, A. D. (2016).
Towards a methodology for evaluating threat intelli-
gence feeds. FIRST.
Pinto, A. and Maxwell, K. tiq-test - threat intelligence
quotient test. https://github.com/mlsecproject/tiq-test.
Accessed: 2022-05-05.
Pinto, A. and Maxwell, K. (2014). Measuring the IQ of
your threat intelligence feeds. Defcon-22.
Pinto, A. and Sieira, A. (2015). Data-driven threat intel-
ligence: Useful methods and measurements for han-
dling indicators. FIRST.
Pitsillidis, A., Kanich, C., Voelker, G. M., Levchenko, K.,
and Savage, S. (2012). Taster’s choice: a comparative
analysis of spam feeds. In Proceedings of the 2012
Internet Measurement Conference, pages 427–440.
Qiang, L., Zhengwei, J., Zeming, Y., Baoxu, L., Xin,
W., and Yunan, Z. (2018). A quality evaluation
method of cyber threat intelligence in user perspec-
tive. In 2018 17th IEEE International Confer-
ence On Trust, Security And Privacy In Computing
And Communications/12th IEEE International Con-
ference On Big Data Science And Engineering (Trust-
Com/BigDataSE), pages 269–276. IEEE.
Ramachandran, A., Dagon, D., and Feamster, N. (2006).
Can dns-based blacklists keep up with bots? In CEAS.
Ramachandran, A. and Feamster, N. (2006). Understanding
the network-level behavior of spammers. In Proceed-
ings of the 2006 conference on Applications, technolo-
gies, architectures, and protocols for computer com-
munications, SIGCOMM ’06, pages 291–302. Asso-
ciation for Computing Machinery.
Ramanathan, S., Mirkovic, J., and Yu, M. (2020). Blag:
Improving the accuracy of blacklists. In NDSS.
RSA, The Security Division of EMC (2012). Getting ahead
of advanced threats: Achieving intelligence-driven
information security, recommendations from global
1000 executives. Security for Business Innovation
Council.
Sauerwein, C., Pekaric, I., Felderer, M., and Breu, R.
(2019). An analysis and classification of public in-
formation security data sources used in research and
practice. Computers & security, 82:140–155.
Sauerwein, C., Sillaber, C., Mussmann, A., and Breu, R.
(2017). Threat intelligence sharing platforms: An
exploratory study of software vendors and research
perspectives. Proceedings der 13. Internationalen
Tagung Wirtschaftsinformatik (WI 2017), pages 837–
851.
Schlette, D., B
¨
ohm, F., Caselli, M., and Pernul, G. (2021).
Measuring and visualizing cyber threat intelligence
quality. International Journal of Information Security,
20(1):21–38.
Sheng, S., Wardman, B., Warner, G., Cranor, L., Hong, J.,
and Zhang, C. (2009). An empirical analysis of phish-
ing blacklists. In CEAS 2009 - Sixth Conference on
Email and Anti-Spam.
Sinha, S., Bailey, M., and Jahanian, F. (2008). Shades of
grey: On the effectiveness of reputation-based “black-
lists”. In 2008 3rd International Conference on Ma-
licious and Unwanted Software (MALWARE), pages
57–64. IEEE.
Zhang, Y., Egelman, S., Cranor, L., and Hong, J. (2007).
Phinding phish: Evaluating anti-phishing tools. In
Proceedings of The 14th Annual Network and Dis-
tributed System Security Symposium (NDSS ’07).
ICISSP 2024 - 10th International Conference on Information Systems Security and Privacy
66
