
Visualizing Plasma Physics Simulations in Immersive Environments
Nuno Verdelho Trindade
1 a
,
´
Oscar Amaro
2 b
, David Br
´
as
3
, Daniel Gonc¸alves
1 c
,
Jo
˜
ao Madeiras Pereira
1 d
and Alfredo Ferreira
1 e
1
INESC-ID, Instituto Superior T
´
ecnico, University of Lisbon, Rua Alves Redol, 9, 1000-029 Lisbon, Portugal
2
Group of Lasers and Plasma (GoLP), Instituto Superior T
´
ecnico, University of Lisbon,
Complexo Interdisciplinar, Av. Rovisco Pais, 1049-001 Lisbon, Portugal
3
Department of Computer Science and Engineering (DEI), Instituto Superior T
´
ecnico, University of Lisbon,
Av. Rovisco Pais, 1, 1049-001 Lisbon, Portugal
Keywords:
Virtual Reality, Immersive Visualization, Scientific Visualization, Plasma Physics, Data Analysis.
Abstract:
Plasma physics simulations create complex datasets for which researchers need state-of-the-art visualization
tools to gain insights. These datasets are 3D in nature but are commonly depicted and analyzed using 2D
idioms displayed on 2D screens. These offer limited understandability in a domain where spatial awareness
is key. Virtual reality (VR) can be used as an alternative to conventional means for analyzing such datasets.
This study presents PlasmaVR, a proof-of-concept VR tool for visualizing datasets resulting from plasma
physics simulations. It enables immersive multidimensional data visualization of particles, scalar, and vector
fields. The study includes user evaluation with domain experts where PlasmaVR was employed to assess the
possible benefits of immersive environments in plasma physics visualization. Participants manifested a high
level of engagement when using the prototype, considering it more enjoyable than conventional means. The
participant’s perception of the usefulness of VR in plasma simulations also increased after experiencing the
prototype.
1 INTRODUCTION
Plasma is a physical state of matter where a signif-
icant fraction of particles is charged (Fridman and
Kennedy, 2021). These particles, usually electrons
and ions, interact via long-range forces and sustain
rich, collective motion, waves, and instabilities (Piel,
2010). Modeling these systems requires complex
simulations that can be performed using Particle-in-
Cell (PIC) codes (Ljung et al., 2000). An example of
such a code is the fully relativistic, massively paral-
lel OSIRIS PIC code (Fonseca et al., 2002) used to
generate the data presented in this work. The datasets
obtained from these simulations consist most notably
of particle data (e.g., position, momentum, energy),
scalar field data (e.g., energy density), and vector
field data (e.g., electric and magnetic fields) (Fitz-
patrick, 2022). The generated datasets are 3D in
nature but commonly depicted and analyzed by re-
sorting to 2D idioms (Munzner and Maguire, 2015).
a
https://orcid.org/0000-0001-6621-0287
b
https://orcid.org/0000-0003-0615-0686
c
https://orcid.org/0000-0002-5121-6296
d
https://orcid.org/0000-0002-8120-7649
e
https://orcid.org/0000-0001-9278-142X
While there are applications to create and analyze
3D idioms for plasma physics (Ahrens et al., 2005;
Bethel et al., 2016), these mostly use conventional
visualization and interaction means (2D screen, key-
board, and mouse), which are not particularly engag-
ing (Guo et al., 2017). In that sense, virtual reality
(VR) can be used as an alternative to these conven-
tional means in the analysis of plasma simulations.
VR has been known to offer improved depth and spa-
tial relationship perception (Guo et al., 2022; Vienne
et al., 2020), which are fundamental for obtaining in-
sights into 3D plasma morphology. It provides a dif-
ferent perspective that results from the users’ immer-
sion in the physical constructs they are trying to ob-
serve (Millais et al., 2018). Likewise, VR can po-
tentially increase user engagement by offering more
immersive and enjoyable experiences.
This study presents PlasmaVR, a VR interactive
prototype tool to visualize the data resulting from
plasma physics simulations. The tool provides re-
searchers with an immersive environment for explor-
ing scientific datasets using natural interaction. It en-
ables multidimensional data visualization of particles,
scalar, and vector fields. The tool includes specific
functionalities for data annotation and segmentation.
Verdelho Trindade, N., Amaro, Ó., Brás, D., Gonçalves, D., Madeiras Pereira, J. and Ferreira, A.
Visualizing Plasma Physics Simulations in Immersive Environments.
DOI: 10.5220/0012357100003660
Paper published under CC license (CC BY-NC-ND 4.0)
In Proceedings of the 19th International Joint Conference on Computer Vision, Imaging and Computer Graphics Theory and Applications (VISIGRAPP 2024) - Volume 1: GRAPP, HUCAPP
and IVAPP, pages 645-652
ISBN: 978-989-758-679-8; ISSN: 2184-4321
Proceedings Copyright © 2024 by SCITEPRESS – Science and Technology Publications, Lda.
645
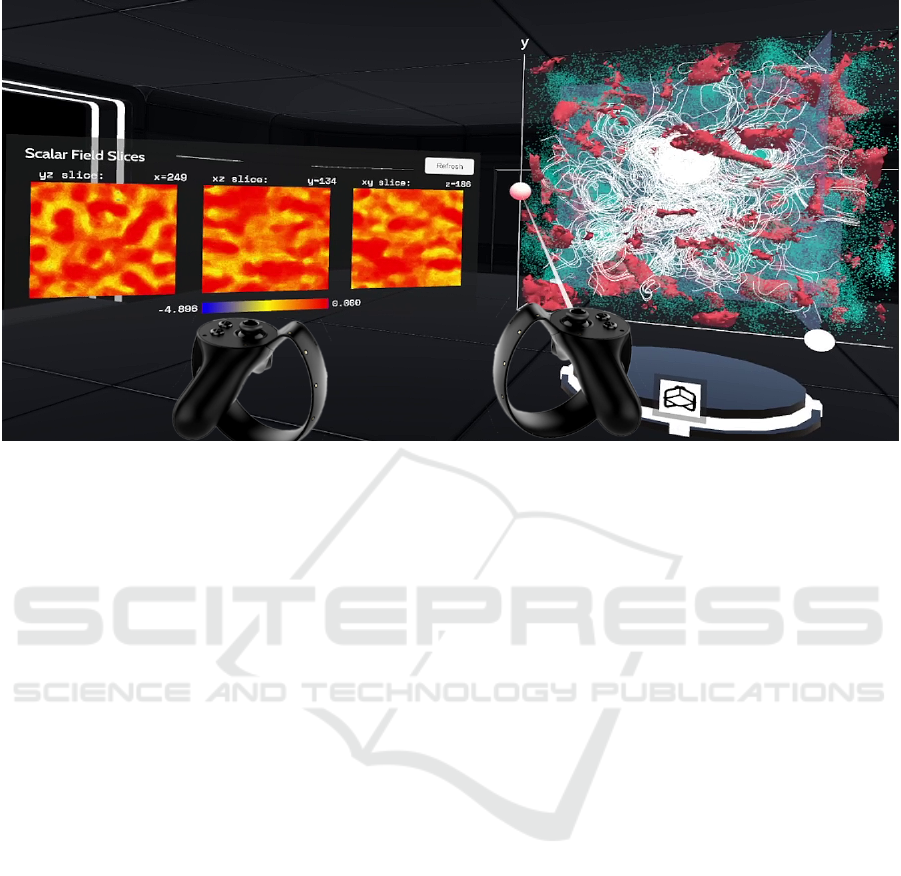
Figure 1: The immersive environment (mockup) of PlasmaVR emulates a sci-fi-themed laboratory. The idiom and the slicing
planes control mechanism are visible on the right of the figure. The resulting slices are on the left of the figure.
It allows multiaxial dynamic slicing of the 3D id-
ioms with a real-time representation of corresponding
scalar 2D energy heatmaps (Figure 1).
2 RELATED WORK
Immersive technologies have been widely accepted as
an aspect of paramount relevance and a future trend
in scientific visualization (Gallagher, 2023). In that
scope, extended reality (XR) has been applied in a
wide range of domains, including in research stud-
ies related to natural, formal, and social sciences (Ko-
rkut and Surer, 2023; Mathur et al., 2023; Fombona-
Pascual et al., 2022; Yeung et al., 2021).
The application of XR technologies to plasma
physics data visualization has also been addressed in
previous research work. An example is the system
developed by Foss et al. (Foss et al., 2018), where
plasma simulation data was visualized in an aug-
mented reality (AR) environment. This work focuses
on the scalar data obtained from plasma simulations
and uses isosurfaces for its representation. The visu-
alization is presented in a time-varying format, and as
such, 3D models corresponding to the timesteps were
pre-rendered and then displayed in sequence to create
an animation. The system is limited in what concerns
interactivity, as possible user interaction mainly con-
sists of walking around the visualization. However,
researchers who tested the system found the possi-
bility of observing the isosurfaces from different per-
spectives in an AR environment very valuable. The
integration of plasma physics simulations with VR
was equally explored by Danielov
´
a et al. (Danielov
´
a
et al., 2019). They proposed a system that allows
researchers to visualize plasma simulation datasets.
The web-based system offers a new perspective on
complex interactions of intense laser beams with var-
ious forms of targets. It enables the analysis of parti-
cles and fields and the modification of environmental
properties to enhance spatial features.
Ohtani et al. (Ohtani et al., 2010; Ohtani et al.,
2011b; Ohtani et al., 2011a) used a CAVE system for
visualizing plasma simulation results and device data.
They addressed the virtual representation and inter-
action with magnetic field lines, particle trajectories,
and isosurfaces of plasma pressure. The study fo-
cused on the virtues of VR in understanding the three-
dimensional positional relationship between plasma
elements. In that scope, researchers also addressed in
a later work (Ohtani et al., 2016) how VR promoted
users’ understanding of dust particle positioning in
plasma simulation experiments. They concluded that
VR could improve understanding of the relative po-
sitional relationship between the dust particles’ tra-
jectories and the magnetic field’s structure. In an
earlier study, Hayashi (Hayashi, 2001) had also al-
ready conceptualized how CAVE systems could be
used to simulate nonlinear phenomena in plasmas.
Ohno et al. (Ohno et al., 2006) had previously pre-
sented VFIVE, a VR visualization software for CAVE
systems, capable of representing scalar and vector
data. Lastly, the application developed by Br
´
as (Br
´
as,
2022), which was used as a base for the current study,
IVAPP 2024 - 15th International Conference on Information Visualization Theory and Applications
646
uses VR headsets in the scope of scientific visualiza-
tion of plasma physics simulations.
The present study builds upon visualization and
interaction concepts addressed in earlier work and
further explores the potential of immersive environ-
ments in plasma physics scientific visualization. In
particular, it fills in the gaps concerning the useful-
ness and usability of VR in that scope. While Foss et
al. (Foss et al., 2018) and Ohtani et al. (Ohtani et al.,
2010; Ohtani et al., 2011b; Ohtani et al., 2011a)
used CAVE and AR systems, we set out to find out
how a system capable of a potentially more immer-
sive experience (designed for VR headsets) could per-
form in that sense. Also, unlike the study conducted
by Foss et al. (Foss et al., 2018), we used an inter-
face with integrated analytics features. These features
share some of the characteristics of the work devel-
oped by Danielov
´
a et al. (Danielov
´
a et al., 2019) but
were designed natively for VR interaction instead of
the web interface proposed by these researchers.
3 SYSTEM OVERVIEW
PlasmaVR is an interactive tool for scientific visu-
alization and exploration of datasets that result from
plasma physics simulations in an immersive environ-
ment. The tool was born from the need of the Group
of Lasers and Plasma (GoLP) (at Instituto Superior
T
´
ecnico (IST), University of Lisbon) researchers to
have an improved depth and spatial relationship per-
ception when analyzing 3D plasma idioms. The
general requirements for PlasmaVR were established
from interviews with these researchers. They in-
cluded animated visualization of the changing dy-
namics of the simulated systems (particle positions,
scalar fields, and vector fields - Figure 2) and play-
back control over these animations. They also in-
cluded the ability to perform dynamic time-dependent
annotation and slice and segment the 3D idioms into
2D energy heatmaps.
The system aggregates two complementary mod-
ules: the data processing and VR modules. The first
aims to process the high volume of raw data from
plasma simulation experiments. This raw data is gen-
erated in the HDF5 (The HDF Group, 2007) format,
and the processing module transforms it into a model
that can be used inside the graphical engine (Unity).
This module can process point clouds as well as scalar
and vector volumes. The second module handles the
representation of the different virtual elements inside
the immersive environment and the user interaction.
When the users put on their VR headsets, they are
inserted into an environment that simulates a sci-fi
laboratory-themed room. This virtual room is where
the plasma exploration takes place (Figure 1). In the
center, the chosen type of plasma structure fluctuates
above a platform and can be animated, rotated, re-
sized, sectioned, or annotated. The user can move
around the room, enter inside the plasma structure,
slice it, and observe the intricacies of its morphology.
PlasmaVR uses a floating panel (which can be
shown or hidden) attached to the left VR controller to
access the different features. It includes buttons that
lead to the playback control, slicing, rotation/resizing
features, annotation, and the immersive environment
configuration. The first of these features is the play-
back control, which incorporates play/pause buttons
and a timeline. This timeline can be used to jump to
a specific frame in the idiom’s animation or observe
step-by-step modifications of the plasma structure.
When analyzing the idioms, the users can rotate
and resize them to view the data from different an-
gles and perspectives. The rotation of the idioms is
performed with a mapping to the controllers’ motion.
When the rotation mode is activated, a virtual model
of a hand holding a sphere appears in place of the
model of a standard controller. This sphere works as a
’proxy’ for the 3D idiom. The user can then press the
controller trigger to grab the sphere and rotate it with
their virtual hand. The idiom follows the sphere’s ro-
tation with three degrees of freedom.
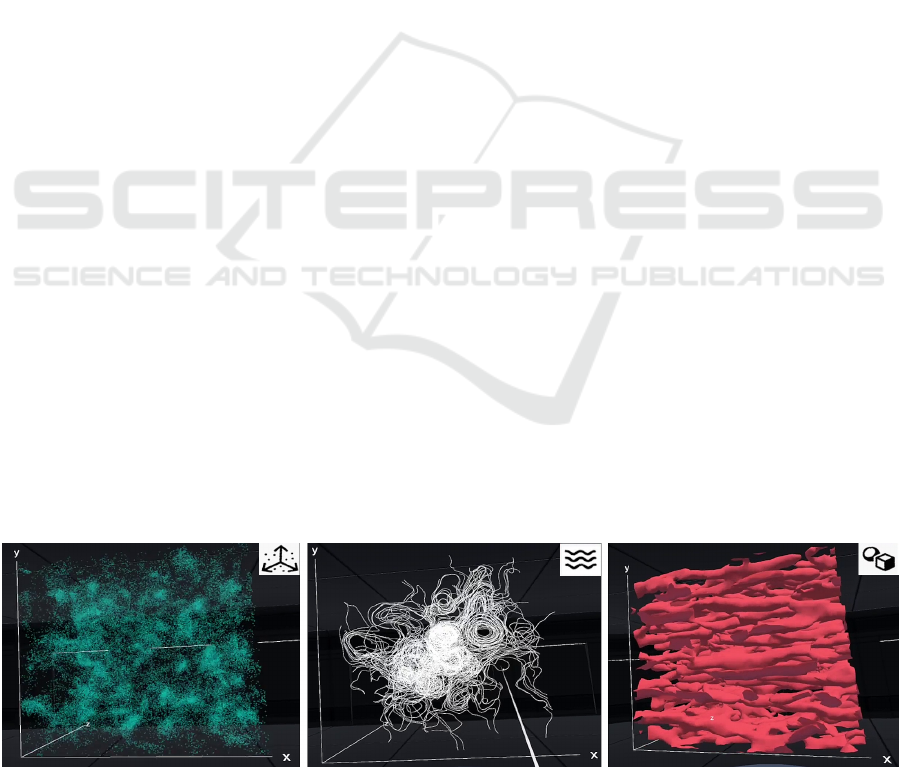
Figure 2: Particles (left), streamlines (center), and isosurfaces (right) idioms represented in the immersive environment and
corresponding symbols used in the interface (top-right corners).
Visualizing Plasma Physics Simulations in Immersive Environments
647
PlasmaVR also includes a slicing feature, which is
directed at producing formal results of data analysis.
To extract the slices, the users can move small spher-
ical handles attached to each axis of the 3D plasma
idiom. These handles are, in turn, linked to planes
that bisect the idiom and will move along its respec-
tive axis. The position of each plane determines the
sections that will be extracted (Figure 3). A 2D panel
displays the heatmaps corresponding to the bisection
from the three planes. This real-time multiaxial rep-
resentation of energy heatmaps allows the researchers
to document how the values change inside the repre-
sented fields.
When analyzing a plasma idiom, researchers may
want to highlight specific aspects of what is happen-
ing in the simulation. However, annotating some-
thing in a 3D idiom using a keyboard, mouse, and 2D
screen may be tedious and counterintuitive. Thus, re-
searchers usually either make 2D annotations or gen-
erate and move 3D objects (e.g., arrows) to the area
they want to highlight. On the contrary, 3D annota-
tion fits particularly well within the PlasmaVR en-
vironment and interaction. The annotation feature
takes advantage of VR’s increased depth and spa-
tial relationship perception. The researcher can enter
inside the plasma structure and make geometrically
complex and precise 3D annotations, thus highlight-
ing valuable simulation insights. Due to the ability
to draw freely in 3D, it is easy to draw annotations
like in Figure 4 (right), where the purple annotation
wraps around a volumetric protuberance in the struc-
ture, thus providing information more comprehen-
sively. The annotations can be aggregated in groups,
and their colors can be customized using the annota-
tions menu (Figure 4, left), accessible from the main
panel. This feature is also adapted to the dynamic na-
ture of the plasma idiom. Because the plasma struc-
ture representation changes with time, the users can
select a specific time frame where the annotation will
be visible. This possibility allows researchers to make
dynamic annotations that track, for example, the path
of a particular anomaly as the plasma animation pro-
gresses.
4 EVALUATION
Domain experts from GoLP interacted with the ap-
plication and performed a set of predefined tasks. An
array of objective metrics was recorded during this in-
teraction. They were then asked to answer question-
naires concerning the prototype’s usability and use-
fulness. This section details how that evaluation was
carried out.
4.1 Methodology
The study was conducted with an experimental group
of five domain experts, from which informed consent
was obtained. As plasma researchers, the participants
were ideal to measure the possible benefits of Plas-
maVR in the visualization of the data resulting from
plasma physics simulations. The hardware consisted
of an Oculus Quest 2 VR headset with a pair of con-
trollers. The headset was connected to a desktop com-
puter with an Intel Core i7-8700 CPU @ 3.20GHz
processor, 16GB of RAM, and a NVIDIA GeForce
GTX 1060 3GB graphics card. A monitor, keyboard,
and mouse were also used (for filling out question-
naires).
The participants were asked to perform a set of
three tasks that were designed to be realistic and, at
the same time, would allow them to have contact with
the extended scope of the prototype’s functionalities.
In the first task, the participants were required to draw
a wide circle of a specific color surrounding a pre-
drawn isosurface idiom and then define a time inter-
val for when the annotation would be visible in the
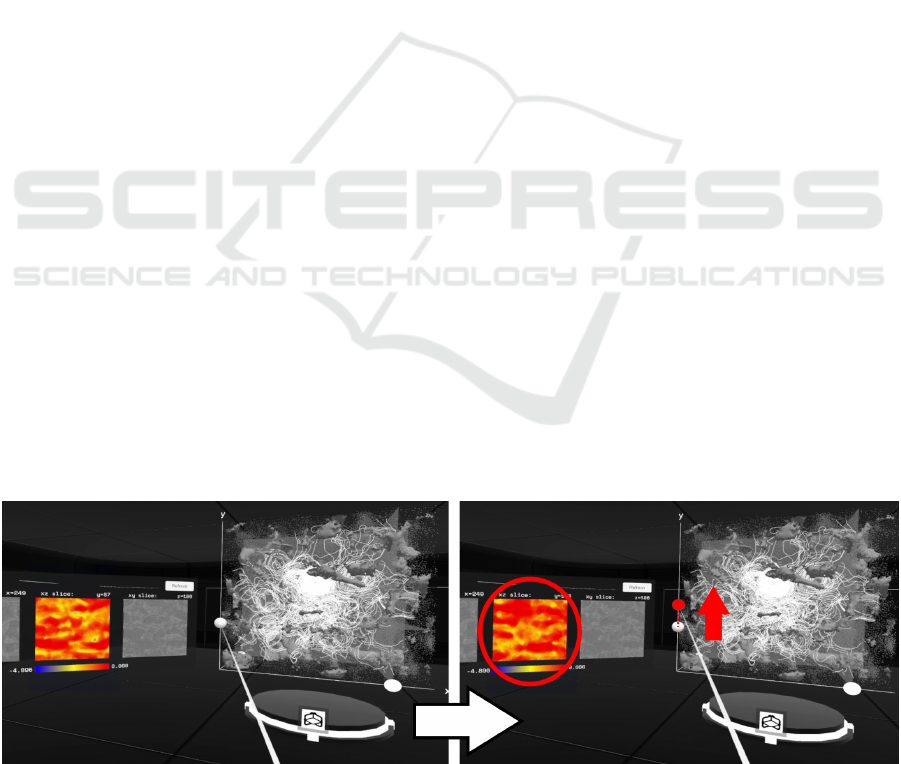
Figure 3: The three intersecting planes can be moved along its axis to generate the corresponding slices. In the example of
the figure, moving the handle of the horizontal plane up the YY axis (red arrow and small red circle) results in the real-time
update of the corresponding energy heatmap for the XZ slice (large red circle).
IVAPP 2024 - 15th International Conference on Information Visualization Theory and Applications
648
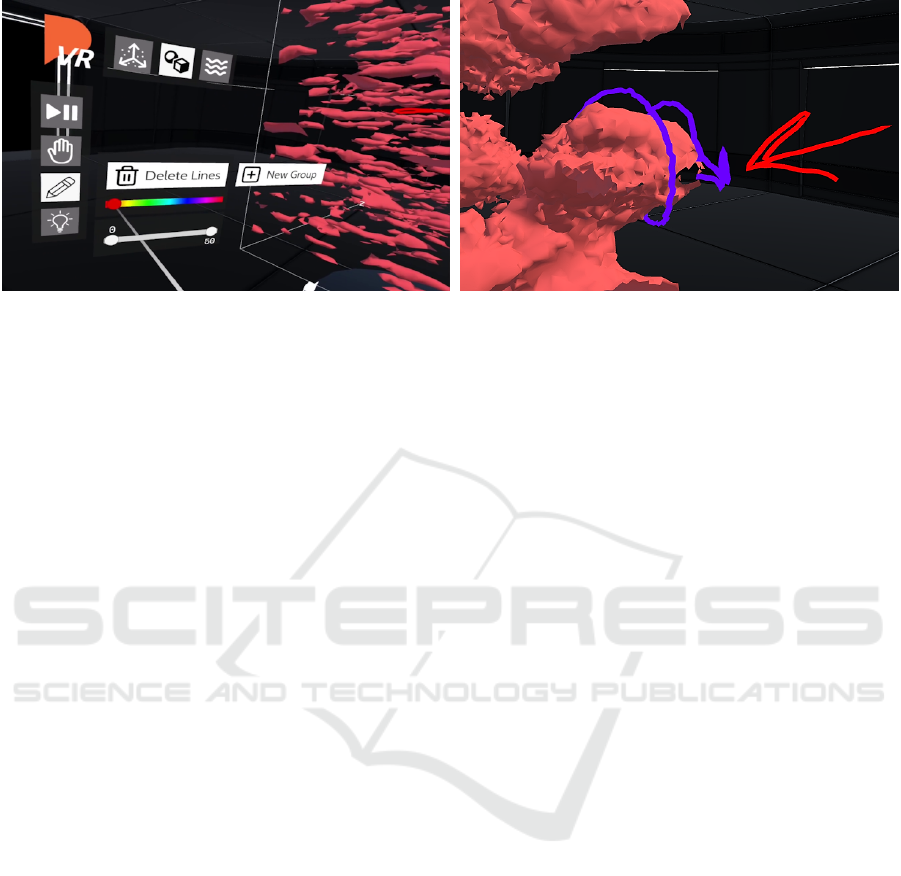
Figure 4: The annotations menu allows users to define its characteristics, including the range of animation frames where they
will be shown (left). Users can do 3D annotations to highlight relevant portions of the idioms (right) (Br
´
as, 2022, p. 35).
simulation. This task was aimed at testing the an-
notation and the corresponding timeline performance.
Namely, it was introduced to assess the spatial percep-
tion within the immersive environment by testing how
easy and intuitive it was to use the annotation tool to
draw in space. It equally allowed the assessment of
how the participants would perform in changing the
color of an annotation element and specifying a time-
line interval within the simulation using the interface
panels.
For the second task, the participants were asked
to rotate the isosurface to have the y-axis pointing to-
wards the right. This more straightforward task was
aimed at testing the rotation functionality’s perfor-
mance. In particular, in assessing how the proxy ro-
tation would perform in terms of precision in rela-
tion to the VR controller’s movement. This perfor-
mance would indicate how well the rotation mecha-
nism transmitted depth perception to the user.
In the third task, the participants were asked to
find the portion of an isosurface with the lowest
charge density value. This task was designed to as-
sess the analytics performance of the prototype. It
required participants to use the slicing tool to extract
the energy heatmaps to be able to figure out the por-
tion with the lower density. Such a sequence of op-
erations adequately estimated how well spatial rela-
tionship was perceived in the isosurface visualization.
Likewise, it provided a good indicator of how well
users can match this 3D visualization of data with
the 2D representation in slices. After completing the
three tasks, the participants were asked to complete
a 10-item System Usability Survey (SUS) (Brooke,
1995) questionnaire.
4.2 Results and Discussion
The group of five participants was composed of re-
searchers with ages ranging from 18-50 years old.
All had experience with plasma simulations and
OSIRIS/PiC Codes (20% more than five years, 60%
between one and five years, and 20% less than one
year experience). Most (80%) had earlier experience
with using VR technologies.
To assess the suitability of the prototype for dif-
ferent types of tasks, a set of objective metrics, such
as completion time and number of errors, were ana-
lyzed. Regarding the time participants took to com-
plete each task type (annotation, rotation, and slic-
ing, as described in the previous section), the rota-
tion task corresponded to a shorter (mean time in min-
utes ± standard error) completion time (1.32 ± .153)
when compared to annotation (2.87 ± .321) and slic-
ing (3.50 ± .224).
While the slicing task had a marginally higher
completion time, it corresponded to a much lower
(mean number of errors ± standard error) number of
mistakes (0.60 ± .179) than the annotation task (1.80
± .219). This difference may indicate that the pro-
totype is better fitted to handle analytics tasks than
annotation tasks. The rotation task had similar errors
(0.60 ± .110) to the slicing task.
To assess the usability of PlasmaVR, the partic-
ipants were asked to complete a ten-question stan-
dard SUS questionnaire with a five-level Likert scale
for agreement (1: Strongly disagree and 5: Strongly
agree) after interacting with the prototype. An aver-
age SUS score of 75.5 (SD = 5.5) was obtained. Such
a score can be paired with a rating of ’Good’ (Bangor
et al., 2009) or ’B’ (74.1 - 77.1) (Lewis and Sauro,
2017). Although the small number of participants im-
pacts the accuracy of the usability evaluation (< 35%
accuracy, based on the sample size threshold proposed
Visualizing Plasma Physics Simulations in Immersive Environments
649
by Tullis and Stetson (Tullis and Stetson, 2004)), the
majority had a positive perception and found the sys-
tem usable.
We also wanted to identify the specific aspects
where the system performed well and where it could
be enhanced in the scope of future development ef-
forts. With that objective, the SUS questions were
broken down into eight categories. These reflect the
different usability areas that were addressed. The cat-
egories include cohesiveness (how well-integrated the
prototype’s features are), learnability (how easily it
can be learned), and intuitiveness (how simple and
easy to use). They also include concision (how un-
complicated the interface is), reliability (how few in-
consistencies are in the prototype), and comfort (how
non-frustrating its use is). Furthermore, they include
trustworthiness (how confident participants were us-
ing the prototype) and usage intention (how much par-
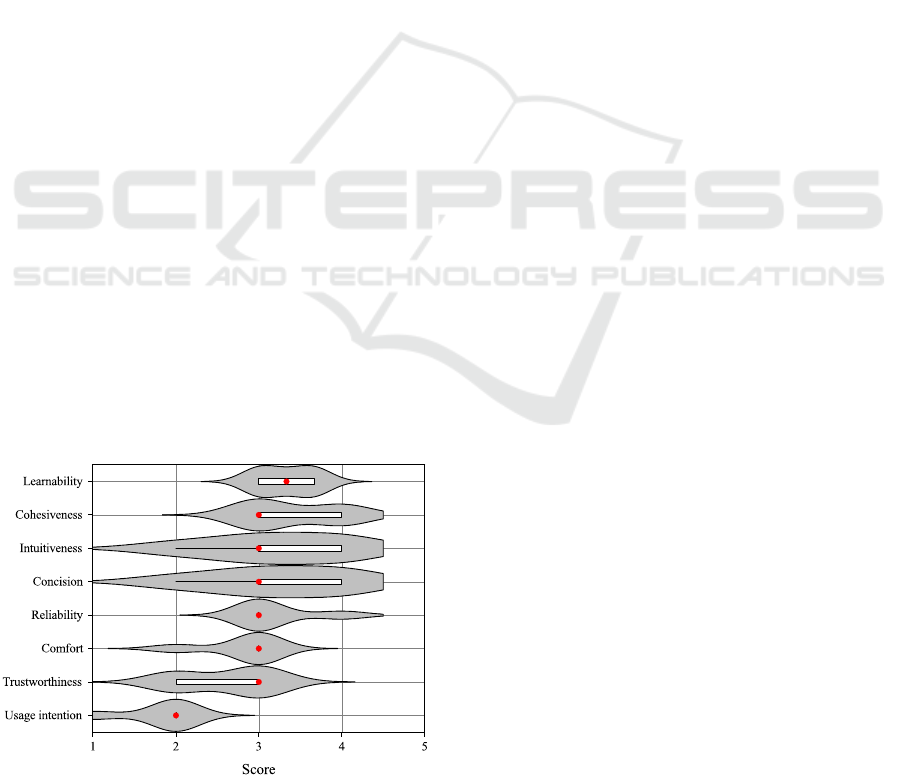
ticipants expected to use it). Results show that the
aspects that performed better (mean (standard error);
median (interquartile range) for the SUS score) were
cohesiveness (3.40 (.110); 3.00 (1.00)), learnability
(3.33 (.067); 3.33 (0.67)), intuitiveness (3.20 (.167);
3.00 (1.00)), concision (3.20 (.167); 3.00 (1.00)), and
reliability (3.20 (.089); 3.00 (0.00)). Aspects that per-
formed below average include comfort (2.80 (.089);
3.00 (0.00)) and trustworthiness (2.60 (.110); 3.00
(1.00)). The lowest contribution came from usage in-
tention (1.80 (.089); 2.00 (0.00)). These results are
illustrated in Figure 5.
The results are mainly within a relatively narrow
range. The aspects that performed better are those
related to the overall experience with the prototype
and how simple and easy the system is to use. Par-
ticipants found the interface reliable, well-structured,
and cohesive. A good level of learnability was also
observed, which seems to be a direct consequence of
how intuitive the participants considered the interface.
Figure 5: Distribution of participant’s score for each usabil-
ity category.
These results align with the participants’ increased
perception of the usefulness of VR after testing the
prototype, which will be addressed further.
Nevertheless, participants found that while the
prototype was reliable, they did not feel entirely con-
fident using it. This apparent contradiction might be
justifiable by interaction limitations pointed out by
participants (e.g., difficulties in doing a full rotation
of the idiom using a single controller motion, which
will be discussed later). The most unexpected result,
however, was the one corresponding to usage inten-
tion, which achieved the lowest score of all categories.
This lower classification might result from the more
localized role in their workflow that some researchers
identified as the main scope of the prototype. More
specifically, some participants positioned its useful-
ness in a faster preliminary visualization of the plasma
physics data as a first step before moving to a more
exhaustive analysis using conventional means.
Additionally, we wanted to determine if the partic-
ipant’s perception of the usefulness of VR in plasma
simulations had changed after experiencing the pro-
totype. Before using the prototype, the participants
were divided on the usefulness of VR in plasma sim-
ulations. Indeed, only 40% agreed that VR would be
useful in helping their workflow, 20% neither agreed
nor disagreed, and 40% disagreed (five-level Lik-
ert scale for agreement, 1: Strongly disagree and 5:
Strongly agree). After using the prototype, partici-
pants’ perception changed to much more positive val-
ues, with 60% strongly agreeing on the usefulness of
VR in plasma simulations, 20% agreeing, and 20%
neither agreeing nor disagreeing. This substantial
shift in opinion regarding the usefulness of VR in
plasma simulations suggests that the user experience
with the prototype was impactful and meaningful to
the participants. As such, it is consistent with a high
level of engagement despite the lower usage intention
previously addressed.
We also enquired users about the aspects of the
prototype they thought would contribute to mak-
ing VR application useful in their workflow. 20%
strongly agreed, and 80% agreed that VR could be
used to display data effectively. 60% strongly agreed,
20% agreed, and 20% neither agreed nor disagreed
that VR was useful for highlighting relevant informa-
tion. 20% strongly agreed, 40% agreed, 20% neither
agreed nor disagreed, and 20% disagreed that VR im-
proved the data exploration experience. Lastly, 80%
strongly agreed, and 20% agreed that VR was a more
enjoyable way of exploring plasma simulation data
than conventional means. It’s worth highlighting that
the highest of these scores corresponds to the way par-
ticipants found PlasmaVR enjoyable, which is, once
IVAPP 2024 - 15th International Conference on Information Visualization Theory and Applications
650

again, compatible with a high level of engagement.
4.3 Limitations and Future Work
When analyzing the results from this work, the ratio-
nale behind a few methodological decisions and their
corresponding limitations should be considered. The
first of these limitations is the small sample size used
in the study, which makes it harder to assert statisti-
cal significance. In that sense, the study could have
been carried out with more participants by extending
the sample selection to encompass non-expert users
or physics researchers from areas other than plasmas.
We chose instead to restrict the sample selection to
domain experts, which allowed us to ensure a consis-
tent baseline among the participants regarding plasma
experiments data analysis knowledge. Likewise, we
opted for using a more controlled experimental envi-
ronment instead of, e.g., making the application avail-
able online and asking users to download and execute
the application by themselves.
Another methodological issue that limits the scope
of this study is the absence of a comparative as-
sessment of conventional analysis means with VR,
namely by using an experimental control group. As
such, assumptions regarding improvements in perfor-
mance or usability can only be substantiated by par-
ticipants’ feedback (collected using questionnaires)
and not by differences in measured performance met-
rics. Nevertheless, while not in the scope of this study,
such comparative assessment can be addressed in fu-
ture work.
There are several opportunities to expand this
study beyond its current scope. Potential future re-
search directions may include overcoming some of
the limitations mentioned above. Such improvements
may mean extending the experimental group to in-
clude researchers from plasma physics research units
other than GoLP. They may also imply, e.g., the
comparison of PlasmaVR with augmented reality and
desktop versions of the prototype to further assess
the advantages and limitations of immersive environ-
ments in plasma physics simulations.
5 CONCLUSION
This work presents a novel prototype tool for visual-
izing plasma physics experiment datasets in VR. The
tool enables a multidimensional data visualization en-
vironment where users can travel around and inside
animated representations of plasma based on time-
dependent data. It allows them to observe the struc-
tural variations in morphology over time from several
points of view. The work shows the different char-
acteristics of the tool, including its architecture, raw
data processing capabilities, and user interface func-
tionalities. It addresses its evaluation with a group
of domain experts consisting of plasma physics re-
searchers. This evaluation is carried out using a set
of objective and subjective metrics. These metrics are
collected during testing through direct measurement
and after testing using questionnaires. The collected
metrics are used to support the research questions,
which aim to ascertain the usability and usefulness of
VR in plasma physics visualization. The findings sug-
gest that applying VR technologies to plasma physics
visualization can result in a usable experience. The
results also support the hypothesis that VR can be use-
ful in plasma physics visualization.
ACKNOWLEDGEMENTS
This work was supported by national funds
through FCT, Fundac¸
˜
ao para a Ci
ˆ
encia e a
Tecnologia, under project UIDB/50021/2020
(DOI:10.54499/UIDB/50021/2020) and under grants
2021.07266.BD and UI/BD/153735/2022. The
funding sources had no involvement in study design;
in the collection, analysis, and interpretation of data;
in the writing of the report; or in the decision to
submit the article for publication. This paper uses
the work of Br
´
as (Br
´
as, 2022) as a base and expands
it by considering additional factors and conducting
substantively different assessments.
REFERENCES
Ahrens, J., Geveci, B., and Law, C. (2005). Paraview: An
end-user tool for large-data visualization. In Visual-
ization Handbook, pages 717–731. Elsevier.
Bangor, A., Kortum, P., and Miller, J. (2009). Determining
what individual sus scores mean: Adding an adjective
rating scale. Journal of Usability Studies, 4(3):114–
123.
Bethel, E. W., Childs, H., and Hansen, C. D., editors (2016).
High Performance Visualization: Enabling Extreme-
Scale Scientific Insight. Chapman & Hall/CRC Comu-
tational Science Series. CRC Press, Chapman & Hall
Book, Boca Raton London New York, first issued in
paperback edition.
Br
´
as, D. (2022). A virtual reality platform for scientific
visualization of plasma physics simulation. Master’s
thesis, Instituto Superior T
´
ecnico, University of Lis-
bon, Portugal.
Brooke, J. (1995). Sus - a quick and dirty usability scale.
Usability Eval. Ind., 189.
Visualizing Plasma Physics Simulations in Immersive Environments
651

Danielov
´
a, M., Jane
ˇ
cka, P., Grosz, J., and Hol
´
y, A. (2019).
Interactive 3d visualizations of laser plasma experi-
ments on the web and in vr. EuroVis 2019 - Posters,
page 3 pages.
Fitzpatrick, R. (2022). Charged particle motion. In Plasma
Physics: An Introduction, volume 1, pages 15–41.
CRC Press, Boca Raton, 2nd edition.
Fombona-Pascual, A., Fombona, J., and V
´
azquez-Cano, E.
(2022). Vr in chemistry, a review of scientific research
on advanced atomic/molecular visualization. Chem-
istry Education Research and Practice, 23(2):300–
312.
Fonseca, R. A., Silva, L. O., Tsung, F. S., Decyk, V. K.,
Lu, W., Ren, C., Mori, W. B., Deng, S., Lee, S., Kat-
souleas, T., and Adam, J. C. (2002). Osiris: A three-
dimensional, fully relativistic particle in cell code for
modeling plasma based accelerators. In Goos, G.,
Hartmanis, J., van Leeuwen, J., Sloot, P. M. A., Hoek-
stra, A. G., Tan, C. J. K., and Dongarra, J. J., editors,
Computational Science — ICCS 2002, volume 2331,
pages 342–351. Springer Berlin Heidelberg, Berlin,
Heidelberg.
Foss, G., Solis, A., Bhadsavle, S., Horton, W., and
Leonard, L. (2018). Plasma simulation data through
the hololens. In Proceedings of the Practice and Expe-
rience on Advanced Research Computing, pages 1–2,
Pittsburgh PA USA. ACM.
Fridman, A. A. and Kennedy, L. A. (2021). Plasma in na-
ture, in the laboratory, and in industry. In Plasma
Physics and Engineering, pages 3–14. CRC Press,
Boca Raton, 3rd edition.
Gallagher, R. S. (2023). Future trends in scientific visual-
ization. In Computer Visualization: Graphics Tech-
niques for Engineering and Scientific Analysis, vol-
ume 1, pages 291–303. CRC Press, Boca Raton, 1st
edition.
Guo, J., Wang, Y., Du, P., and Yu, L. (2017). A novel
multi-touch approach for 3d object free manipulation.
In Chang, J., Zhang, J. J., Magnenat Thalmann, N.,
Hu, S.-M., Tong, R., and Wang, W., editors, Next
Generation Computer Animation Techniques, volume
10582, pages 159–172. Springer International Pub-
lishing, Cham.
Guo, M., Yue, K., Hu, H., Lu, K., Han, Y., Chen, S., and
Liu, Y. (2022). Neural research on depth perception
and stereoscopic visual fatigue in virtual reality. Brain
Sciences, 12(9):1231.
Hayashi, T. (2001). Computer simulation of nonlinear phe-
nomena in plasmas. Computer Physics Communica-
tions, 142(1-3):49–54.
Korkut, E. H. and Surer, E. (2023). Visualization in vir-
tual reality: A systematic review. Virtual Reality,
27(2):1447–1480.
Lewis, J. and Sauro, J. (2017). Can i leave this one out? the
effect of dropping an item from the sus. Journal of
Usability Studies, 13(1):38–46.
Ljung, P., Dieckmann, M., Andersson, N., and Ynnerman,
A. (2000). Interactive visualization of particle-in-
cell simulations. In Proceedings Visualization 2000.
VIS 2000 (Cat. No.00CH37145), pages 469–472,, Salt
Lake City, UT, USA. IEEE.
Mathur, M., Brozovich, J. M., and Rausch, M. K. (2023).
A brief note on building augmented reality models for
scientific visualization. Finite Elements in Analysis
and Design, 213:103851.
Millais, P., Jones, S. L., and Kelly, R. (2018). Exploring
data in virtual reality: Comparisons with 2d data vi-
sualizations. In Extended Abstracts of the 2018 CHI
Conference on Human Factors in Computing Systems,
pages 1–6, Montreal QC Canada. ACM.
Munzner, T. and Maguire, E. (2015). Visualization Analy-
sis & Design. A.K. Peters Visualization Series. CRC
Press, Boca Raton London New York.
Ohno, N., Kageyama, A., and Kusano, K. (2006). Virtual
reality visualization by cave with vfive and vtk. Jour-
nal of Plasma Physics, 72(06):1069.
Ohtani, H., Kageyama, A., Tamura, Y., Ishiguro, S.,
and Shohji, M. (2011a). Integrated visualization
of simulation results and experimental devices in
virtual-reality space. Plasma and Fusion Research,
6:2406027–2406027.
Ohtani, H., Ohno, N., Mizuguchi, N., Shoji, M., and Ishig-
uro, S. (2010). Simulation data analysis by virtual re-
ality system. Plasma and Fusion Research, 5:S2109–
S2109.
Ohtani, H., Shoji, M., Ohno, N., Suzuki, Y., Ishiguro, S.,
Kageyama, A., and Tamura, Y. (2016). Visualization
of dust particle data with plasma simulation results us-
ing virtual reality system. Contributions to Plasma
Physics, 56(6-8):692–697.
Ohtani, H., Tamura, Y., Kageyama, A., and Ishiguro, S.
(2011b). Scientific visualization of plasma simulation
results and device data in virtual-reality space. IEEE
Transactions on Plasma Science, 39(11):2472–2473.
Piel, A. (2010). Definition of the Plasma State, pages 29–
43. Springer Berlin Heidelberg, Berlin, Heidelberg.
The HDF Group (2007). Hdf5 user’s guide.
Tullis, T. S. and Stetson, J. N. (2004). A comparison of
questionnaires for assessing website usability. In Pro-
ceedings of the Usability Professionals Association
(UPA) 2004 Conference, pages 7–11. Usability Pro-
fessionals Association (UPA).
Vienne, C., Masfrand, S., Bourdin, C., and Vercher, J.-L.
(2020). Depth perception in virtual reality systems:
Effect of screen distance, environment richness and
display factors. IEEE Access, 8:29099–29110.
Yeung, A. W. K., Tosevska, A., Klager, E., Eibensteiner, F.,
Laxar, D., Stoyanov, J., Glisic, M., Zeiner, S., Kulnik,
S. T., Crutzen, R., Kimberger, O., Kletecka-Pulker,
M., Atanasov, A. G., and Willschke, H. (2021). Vir-
tual and augmented reality applications in medicine:
Analysis of the scientific literature. Journal of Medi-
cal Internet Research, 23(2):e25499.
IVAPP 2024 - 15th International Conference on Information Visualization Theory and Applications
652
