
Prediction in Pre-University Education System Using Machine Learning
Methods
Ioan-Daniel Pop
a
“Babes-Bolyai” University, Department of Computer Science, 400084, Cluj-Napoca, Romania
Keywords:
Educational Data Mining, Regression, Classification, Performance Prediction, Artificial Neural Network,
Random Forest.
Abstract:
This paper aims to present the results obtained from the experiments of predicting the academic performance of
students from the pre-university education system in Romania. The prediction of academic performance is an
extremely important topic in the field of educational data mining, the creation of such a system bringing many
benefits to the teaching-learning-evaluation process. The data set used in this paper is original and contains
real data collected from 24 educational institutions in the Romanian rural and urban environment. The sample
is composed of students who belong to all social categories and who had different academic performances.
The results obtained for Random Forest and Artificial Neural Network were good, more precisely following
the experiments performed, it resulted in an accuracy greater than 90%.
1 INTRODUCTION
In recent years, the field of education has made signif-
icant strides, with technology developments playing
a key part in the transformation of traditional teach-
ing and learning methods. The use of machine learn-
ing methods for predicting students’ performance in
school is one such breakthrough that has attracted a
lot of attention. In the framework of the Romanian
pre-university education system, this paper investi-
gates methods based on machine learning for predict-
ing students’ academic achievement.
The educational system in Romania, with its dis-
tinct potential and problems, makes for a fascinating
case study for examining how well machine learning
techniques can predict students’ academic achieve-
ment. This paper tries to find patterns and correlations
that may be used as predictors of academic achieve-
ment by utilizing large-scale data sets covering vari-
ous student profiles, academic records, and environ-
mental factors.
This paper will present the results obtained fol-
lowing the development of a system for predicting
the academic performance of Romanian secondary
school students using both classification and regres-
sion models.
Educational data mining (EDM) is extending the
a
https://orcid.org/0000-0002-3740-6579
application of data mining and machine learning tech-
niques to educational data. EDM’s purpose is to ex-
tract meaningful knowledge from educational data in
order to enhance academic results such as student per-
formance, teacher effectiveness, and the development
of curriculum. Predicting student achievement is an
essential use of educational data mining. The paper
constructs models that predict a student’s chance of
success in a course or program by examining past
data on student performance, such as grades, test
scores, and demographic data. These hypothetical
scenarios can aid in the identification of at-risk kids
who might need further support or intervention, as
well as informing instructional design and curricu-
lum preparation (Salloum et al., 2020). Academic
achievement may be influenced by a variety of vari-
ables, such as demographic characteristics such as
age, sexual orientation, and socioeconomic level, as
well as academic elements such as prior knowledge
and routine of study. EDM techniques may be em-
ployed to identify the most significant drivers of stu-
dent performance and develop models with these fac-
tors (Bakhshinategh et al., 2018).
In summary, EDM has an opportunity to signif-
icantly increase our comprehension of how students
perform while also informing educational policy and
practice. Researchers may discover elements that are
crucial to academic achievement and create strate-
gies to help every student reach their highest poten-
430
Pop, I.
Prediction in Pre-University Education System Using Machine Learning Methods.
DOI: 10.5220/0012356900003636
Paper published under CC license (CC BY-NC-ND 4.0)
In Proceedings of the 16th International Conference on Agents and Artificial Intelligence (ICAART 2024) - Volume 3, pages 430-437
ISBN: 978-989-758-680-4; ISSN: 2184-433X
Proceedings Copyright © 2024 by SCITEPRESS – Science and Technology Publications, Lda.

tial through exploring educational data with powerful
data mining and machine learning approaches (Mo-
hamad and Tasir, 2013).
2 LITERATURE REVIEW
Salloum et al. (Salloum et al., 2020) give a de-
tailed review of the topic of educational data mining.
The purpose of their paper is to examine the present
status of research in educational data mining, high-
lighting the important results, methodologies, and po-
tential applications of this topic. The authors begin
by emphasizing the significance of educational data
mining, which entails using data mining techniques
to obtain relevant knowledge from educational data.
Researchers next go through the many forms of ed-
ucational data that are typically utilized in studies,
such as student performance data, assessment data,
log data, and social network data. This research ad-
ditionally offers a thorough examination of the dif-
ferent types of data mining approaches that are typi-
cally employed in educational data mining research.
Association rule mining, classification, clustering and
sequential pattern mining are a few examples. The re-
searchers examine the advantages and disadvantages
of each approach, as well as stances on how they have
been applied in educational data mining research.
Lastly, the paper analyzes the area of EDM’s
present issues and prospective objectives. Among
these obstacles are the need for more uniform
data-gathering methods, more advanced analytic ap-
proaches, and greater study on the ethical aspects of
educational data mining. The researchers addition-
ally offer suggestions for future study in the subject
and the use of data mining to help teacher decision-
making (Salloum et al., 2020). All in all, this arti-
cle, is an excellent resource for anybody interested in
learning about the present status of educational data
mining and its prospective influence on education.
Mohamad and Tasir (Mohamad and Tasir, 2013)
provided an overview of the field of EDM. The au-
thors give a complete study of the study in this field,
describing the aims and techniques of EDM as well
as the data sources employed. They additionally talk
about the difficulties and moral dilemmas that occur
while dealing with educational data. Furthermore, the
study provides a thorough examination of the numer-
ous EDM approaches and algorithms, such as cluster-
ing, classification, and association rule mining. The
researchers come to the conclusion by suggesting sev-
eral essential study topics for the future of EDM, such
as data integration and the creation of tailored learn-
ing systems.
Pena-Ayala (Pe
˜
na-Ayala, 2014) gives a thorough
assessment of the topic of EDM as well as an in-depth
evaluation of the latest studies in the area of study.
The author outlines the many forms of data that may
be utilized in EDM, such as student performance data,
log data, and social network data, and offer demon-
strations of how to analyze this data to get insights
into student learning behavior and performance. Fol-
lowing that, the author gives a thorough study of con-
temporary EDM efforts, dividing them into multiple
sub-fields that include learning analytics, educational
process mining, and student modelling (Pe
˜
na-Ayala,
2014).
One of the reference works when it comes to
the analysis of student performance using machine
learning methods is made by Almarabeh (Almarabeh,
2017). In the study, using a college database, with 225
records, each with ten attributes, the authors applied
several classification methods such as naive Bayes,
BayesNet, ID3 (Iterative Dichotomiser), C4.5 ( J48)
and Neural Networks obtaining satisfactory results.
In Table 1 the results presented in the mentioned study
can be observed that the best results were obtained us-
ing Bayesian Network. In the Table 1 below, the fol-
lowing abbreviations: Naive Bayes as M1, Bayesian
Network as M2, Iterative Dichotomiser 3 as M3, J48
Classifier as M4 and Neural Network (MLP) as M5.
Table 1: The performances of the models presented in the
paper (Almarabeh, 2017).
Methods ACC PPV TPR F1 Score
M1 0.9110 0.9110 0.9110 0.9110
M2 0.9200 0.9200 0.9200 0.9200
M3 0.8840 0.8840 0.8840 0.8840
M4 0.9110 0.9140 0.9110 0.9120
M5 0.9020 0.9040 0.9020 0.9030
A paper that is part of the current state of the art
when it comes to predicting student performance us-
ing machine learning algorithms is (Oppong, 2023).
This article is a comprehensive study in which the au-
thor presents a brief review of the works that address
the problem mentioned before. The author analyzes
over 35 works, the study shows that over 87% of the
algorithms used in the prediction of academic perfor-
mance are from the category of supervised learning,
which indicates that most of the experiments were
done with labelled data. another interesting thing is
the fact that in the case of 59% of the experiments
feature selection techniques were also used.
More than 15 algorithms were used in the ana-
lyzed papers, according to (Oppong, 2023). The most
used algorithm in the prediction of academic perfor-
mance was Artificial Neural Network (ANN was used
Prediction in Pre-University Education System Using Machine Learning Methods
431

in 20 of the 35 papers analyzed), followed by Deci-
sion Tree, Naive Bayes, Support Vector Machine and
Random Forest.
All in all, this article (Oppong, 2023) is an excel-
lent resource for anybody interested in learning about
the present status of student performance prediction
and its prospective influence on education.
3 THEORETICAL BACKGROUND
3.1 Methods
In artificial intelligence, supervised learning aims to
provide a correct output for a new input, based on a
set of previously studied pairs of inputs and outputs.
There are two types of problems that can be solved
using supervised learning: regression and classifica-
tion (Sindhu Meena and Suriya, 2020). Both prob-
lems, from a mathematical point of view, come down
to determining an unknown relationship between the
inputs of a system and its outputs. Regression is the
process of finding a link between dependent and in-
dependent variables. The algorithm aims to predict a
result for new input data (Sindhu Meena and Suriya,
2020). The result is a continuous one, it is represented
by a real number. The classification is the labelling of
new input, so the result is a discrete one, being part of
a predefined set (Sindhu Meena and Suriya, 2020).
For each problem presented above, various algo-
rithms have been developed, some specific to each
problem, and others adaptable, with small modifica-
tions, to both problems. A good examples of this are
the decision trees and the artificial neural networks.
The paper created several supervised learning
models. For each model, both the architecture used
for the regression model and for the classification
model will be discussed.
Artificial Neural Networks (ANN) are a type of
machine learning model inspired by the structure and
function of the human brain. ANNs are extremely
adaptable and may be used for a variety of tasks such
as classification, regression, and pattern recognition
(Hutter et al., 2019).
ANNs are made up of linked nodes called neu-
rons that are structured in layers. The data is received
by the input layer and then goes through one or more
hidden layers before reaching the output layer. Each
neuron performs a mathematical operation on its in-
puts and sends the outcome to the next layer. ANNs
learn to modify the strength of connections between
neurons to enhance their performance on a particu-
lar task through a process known as training (Hutter
et al., 2019).
Random Forest (RF) is a flexible ensemble learn-
ing approach for making accurate predictions by com-
bining the predictions of numerous decision trees. It
is well-known for its resilience and scalability and
is commonly used for classification and regression
problems (Probst et al., 2019).
Multiple decision trees are trained separately on
distinct subsets of the training data in a RF. The fi-
nal forecast is determined by merging the various tree
predictions through voting (for classification) or aver-
aging (for regression) (Probst et al., 2019).
3.2 Performance Evaluation
To establish the best values of the parameters, a pop-
ular hyperparameter optimization method in machine
learning, named grid search was used. It entails me-
thodically going through a predetermined list of hy-
perparameters to identify the setting that gives the
greatest performance for a particular model. All the
parameters presented below were established follow-
ing the application of this method.
Considering that in this paper both regression and
classification models were created, performance eval-
uation is done differently for each category. For
the evaluation of the models were used both general
methods, the cross-validation and confidence inter-
vals, as well as specific methods for each approach.
To validate and establish the performance of the mod-
els created in the paper, it was decided to use K-fold
cross validation, where the value of k was set to 5.
For the regression, it was decided to use the fol-
lowing performance metrics as performance evalu-
ation methods: Mean Squared Error, Root Mean
Squared Error, Mean Absolute Error, Explained Vari-
ance Score and R-Squared (Naser and Alavi, 2020).
For the classification, the following performance
values were considered: Accuracy, Precision, Recall
and F1 Score (Grandini et al., 2020).
4 OUR APPROACH FOR
PREDICTING THE ACADEMIC
PERFORMANCE
4.1 Dataset
The data set is an original one, being collected by the
authors from 24 educational units in Romania, both
rural and urban. The data set contains 26.143 records,
each record having 69 features. The features can be
divided into three categories as follows: social and
environmental factors (school environment and the
ICAART 2024 - 16th International Conference on Agents and Artificial Intelligence
432
gender of the child), grades in the following subjects
for the four years of secondary school (Romanian lan-
guage and literature; first modern language; second
modern language; mathematics; biology; social ed-
ucation; history; geography; music; arts; sports and
physical education; technological sciences; informa-
tion and communication technology; behavior and
academic conduct), grades for three years of study
physics and two years for chemistry, the grade for
one year of study for Latin language and the last five
features are related to high school admission (and
are )grade in the Romanian language and literature
exam, grade in the math exam, high school profile,
high school brunch and high school environment).
The data set consists of both numeric and text
elements. All grades during the years of study are
represented by integer values from the range [1, 10],
while grades from exams are represented by posi-
tive real values from [1, 10]. The environment of
the school of origin, respectively the environment of
the high school are values from the {rural, urban}
set. The high school profile is part of the collec-
tion: Humanistic, Real, Technical, Services, Natural
Resources, Environmental Protection, Military, Theo-
logical, Sports, Artistic or Pedagogical, whereas the
high school brunch can be: Theoretical, Technologi-
cal or Vocational.
The data set is balanced when it comes to the gen-
der distribution. So the data set contains 53.55% fe-
male persons. When it comes to the ratio between
urban and rural people, the differences are not very
large, 63.11% of the people who form the data set are
from urban areas, and the remaining 36.89% from ru-
ral areas.
4.2 Proposed Architectures
Considering the form of the data, in order to be able
to make a classification the data set was divided into
classes, for that it was used the Romanian system for
classifying grades according to their value. For clas-
sification, the data set changes a little in the follow-
ing way, the output variable, which was initially a
grade from the interval [1, 10] becomes a class from
the set {low, medium, high}. The grades were divided
in the following way: grades in the interval [1.0, 6.5]
are low, grades in the interval (6.5, 8.5] are medium,
and grades in the interval (8.5, 10] represent the high
class. This class division was used for all classifica-
tion models created.
4.2.1 Artificial Neural Network
As stated above, in this paper were created both clas-
sification models and regression models, for each
model having a distinct architecture. Each model suc-
ceeds in predicting grades for both exam subjects. For
the ANN, the best results for the regression model
were obtained with the following architecture and net-
work parameter values, the architecture is presented
in Table 2.
Table 2: The set of values for the parameters of the ANN
Regression Model.
Parameter Value
model sequential
hidden layers 4
dropout layers 2
learning rate 0.0001
activation ReLu
optimizer SGD
batch size 512
epochs 2500
For the classification approach, the architecture
was completely different, the values of the parame-
ters used in the model are presented in Table 3.
Table 3: The set of values for the parameters of the ANN
Classification Model.
Parameter Value
model Multi-Layer Perceptron
hidden layers 5
dropout layers 2
learning rate 0.001
activation Softmax
optimizer Adam
batch size 1024
epochs 3000
4.2.2 Random Forest
Random Forest is an extremely useful method in solv-
ing both classification and regression problems. Con-
sidering the way a RF works, it was decided to create
a model for predicting each exam grade, so that four
models were created, as follows: a regression model
for predicting the math exam grade and one for the
prediction of the Romanian Language and Literature
exam grade, a classification model for the math exam
grade and a classification model for the Romanian
Language and Literature exam grade. The difference
between the two regression models is only the output,
otherwise the architecture, respectively the values of
the parameters were the same. The situation is similar
for the classification models.
The values set for each parameter from the regres-
sion model can be found in Table 4, and for classifi-
cation in Table 5.
Prediction in Pre-University Education System Using Machine Learning Methods
433
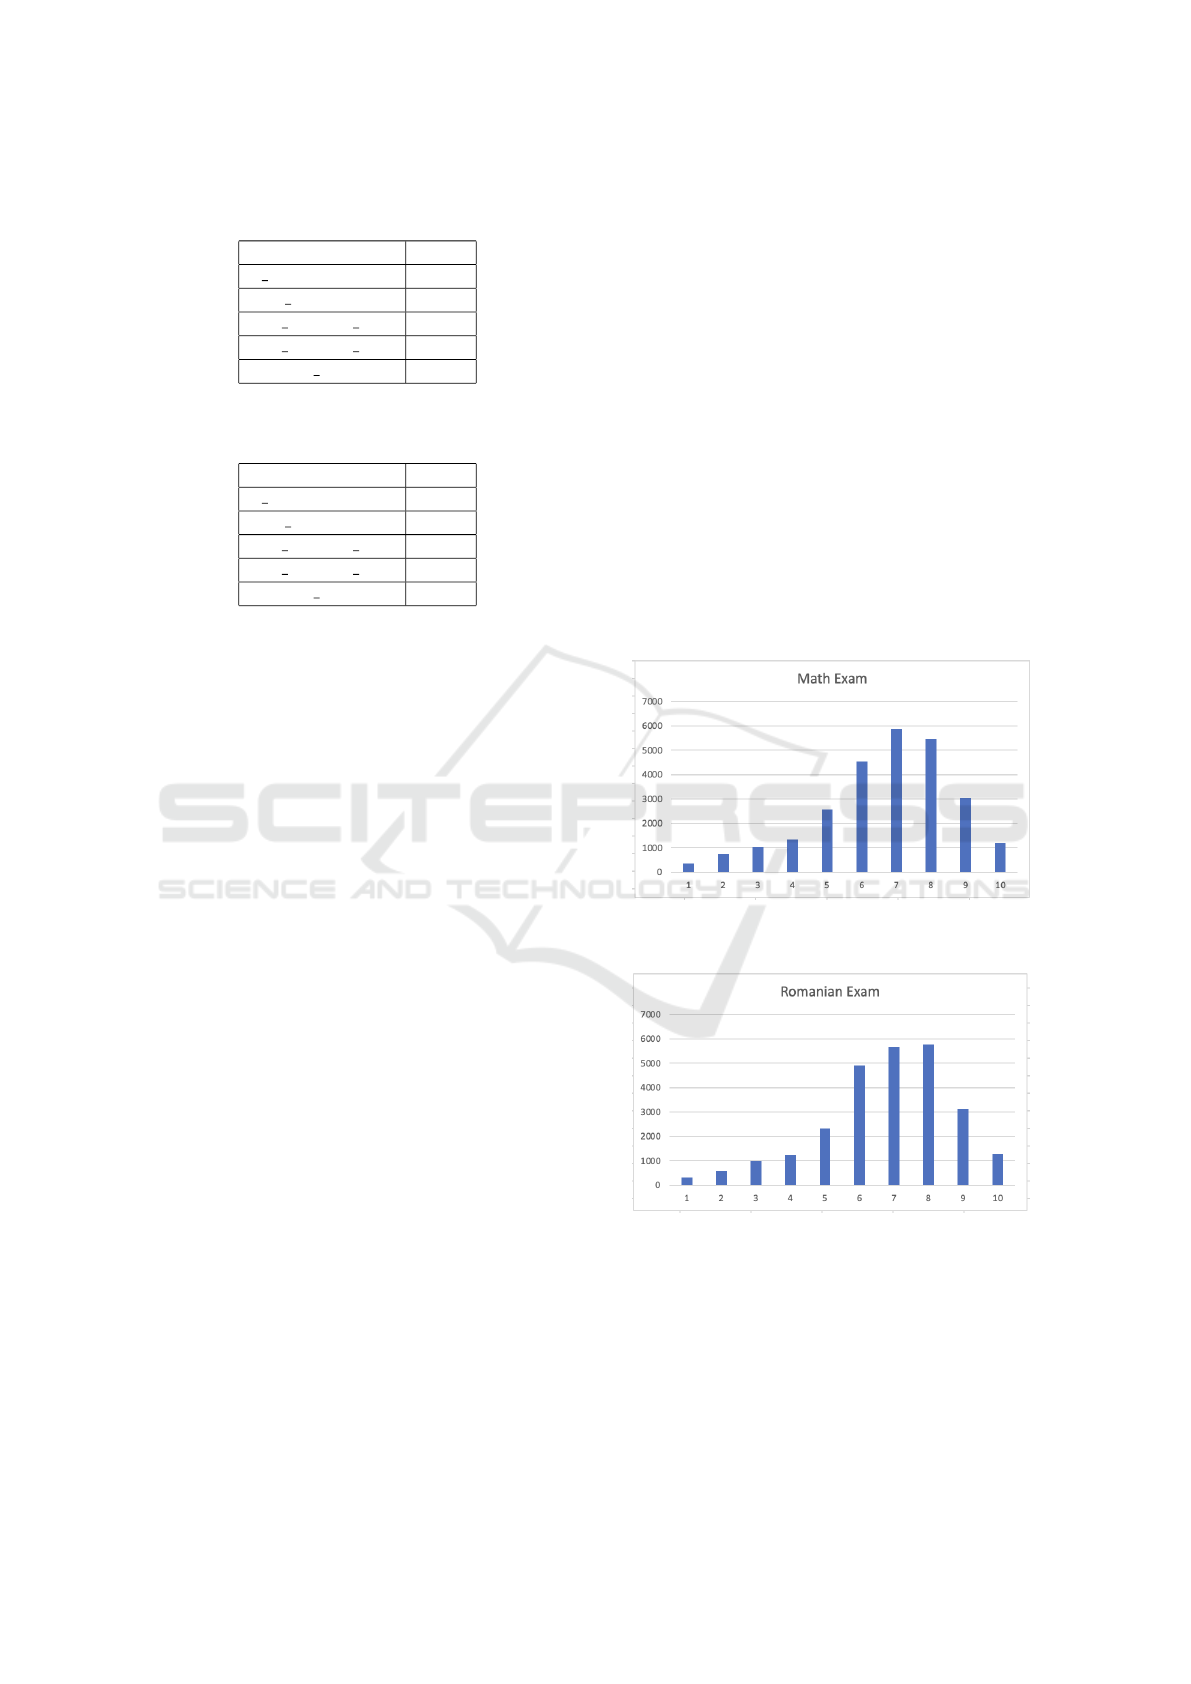
Table 4: The set of values for the parameters of the Random
Forest Regression Model
Parameter Value
n estimators 50
max depth 5
min samples split 2
min samples leaf 4
random state 42
Table 5: The set of values for the parameters of the Random
Forest Classification Model
Parameter Value
n estimators 100
max depth 10
min samples split 5
min samples leaf 2
random state 42
5 EXPERIMENTAL RESULTS
5.1 Data Analysis
Data analysis is essential to the creation of machine
learning techniques. It involves a number of stages
that help with analyzing the data, getting it ready
for modelling, and accumulating knowledge to create
powerful machine learning models.
In the data analysis part, several steps were fol-
lowed from the beginning, the first step was to collect
the data and create a unique data set. The next step
was represented by the data exploration and visual-
ization stage. Perform a preliminary analysis of the
data to comprehend its composition, trends, and fea-
tures. Plot, illustrate, and summarize statistical data to
obtain insights and spot possible problems like miss-
ing numbers, outliers, or imbalances. After this step
followed data preprocessing, where addressing miss-
ing numbers, managing outliers, and resolving dis-
crepancies will clean the data. To assess the effec-
tiveness of the model, divide the data into training,
validation, and test sets.
Before performing the selection stage of the
model and its evaluation, the part of feature engineer-
ing was done. This stage means developing innova-
tive accurate representations that effectively capture
pertinent data by analyzing and engineering charac-
teristics. Extract features from raw data, or combine
or change existing features to produce new ones. Sta-
tistical approaches, feature selection techniques or do-
main expertise were used to find useful features.
The first part of this paper consisted of the sep-
aration of input and output data. Features related to
the student’s environment of origin, respectively the
grades for the four years of study, were considered
as input data, while the last 5 features related to high
school admission were considered as output data.
Considering the problem that has to be solved, it
was decided in the data analysis part, to remove from
the data set the features related to the high school cho-
sen by the student. After this elimination, the output
data consisted of the grades for the two exams taken
by the student.
Another important thing was to see the distribu-
tion of the target variables. In Figures 1 and 2 it can
see the Gaussian distribution of the data both for the
grades from the mathematics exam and for the grades
from the Romanian Language and Literature exam.
The fact that the grades follow a Gaussian distribu-
tion is not surprising. Studies in the specialized lit-
erature, referring to pedagogical studies, note that in
general, students’ grades follow this type of distribu-
tion. Both graphs describe the Gaussian Bell curve.
Figure 1: The distribution of grades from the mathematics
exam.
Figure 2: The distribution of grades from the Romanian lan-
guage exam.
After viewing the data and understanding it, fea-
ture selection using ReliefF feature selection method
was performed, in parallel, it was checked the cor-
relation between the input data and the output data.
The correlation check was done using the Pearson
correlation coefficient. The correlation between each
study course and the grade from the Romanian Lan-
ICAART 2024 - 16th International Conference on Agents and Artificial Intelligence
434
guage and Literature exam and the grade from the
math exam were checked.
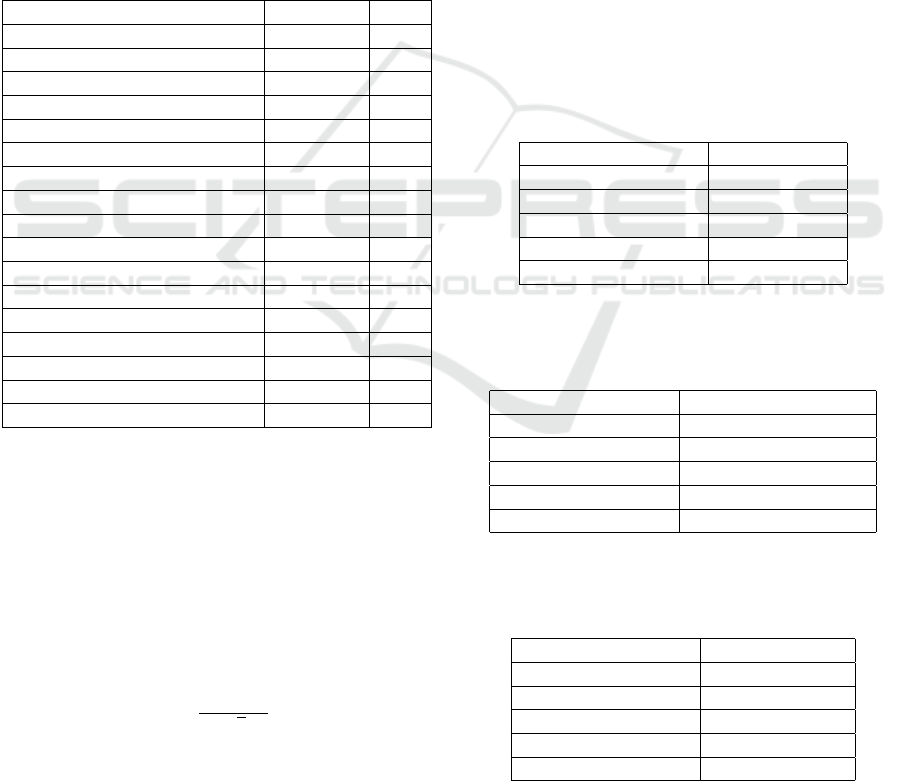
In Table 6 it can be seen the correlation index be-
tween each course and the exam grades. The results
of the function are found in the range [-1; 1], where -1
means a perfect negative correlation, 1 means a per-
fect positive correlation and 0 means that there is no
correlation between the tested data. In most special-
ized studies, it is specified that values exceeding 0.8
should be taken into account. Considering this, it was
decided to eliminate from the data set the courses that
have a Pearson index value lower than 0.8, taking this
decision led to eliminate the following courses: mu-
sic, arts, sports and physical education and behavior
and academic conduct.
Table 6: Pearson Correlation coefficients values between
the features and the target output.
Course Romanian Math
Romanian Language 0.960 0.873
First Modern Language 0.900 0.863
Second Modern Language 0.890 0.863
Latin Language 0.838 0.813
Mathematics 0.870 0.951
Physics 0.862 0.898
Chemistry 0.850 0.874
Biology 0.867 0.887
Social Education 0.891 0.863
History 0.892 0.864
Geography 0.893 0.865
Music 0.421 0.418
Arts 0.413 0.408
Sports and Physical Education 0.415 0.414
Technological Sciences 0.867 0.890
Communication Technology 0.867 0.891
Academic Conduct 0.708 0.695
5.2 Results and Discussion
After the data analysis and model creation part came
the performance verification and validation part to see
what results are obtained.
In all the tables below, the results are presented in
the form x ±α, where x is the mean value of a perfor-
mance metric obtained after applying the k-fold cross-
validation method with k = 5, and α is the confidence
value,
α =
1.96 ×σ
√
k
(1)
where k represents the number of groups the dataset
is split into and σ represents the standard deviation
of the values. The k-fold cross-validation method
and the determination of the confidence intervals were
carried out for both the classification and regression
models.
As was presented in the previous section, for re-
gression were created three architectures: an ANN
model that predicts both the grade from the math
and the Romanian Language and Literature exams, a
Random Forest model for the grade from the Roma-
nian Language and Literature exam, a Random Forest
model for the grade from the math exam.
Table 7 shows the performance of the regression
ANN model. In the Table 8 you can see the per-
formance for the regression model created with Ran-
dom Forest for the grade from the Romanian language
exam, and in the Table 8 the performance of the re-
gression model for the math exam grade. As it can
be seen, the performance of the regressor for math is
not as good as the regressor for Romanian exam, this
result is not surprising, since most of the input data
are part of the humanities branch and it was expected
that the regressor for the grade from the Romanian
language exam would be more accurate.
Table 7: Performance of the ANN Model for Regression.
95% CIs are used for the mean performance.
Performance Metric Value
MSE 0.289 ± 0.042
RMSE 0.538 ± 0.041
MAE 0.402 ± 0.043
R2 0.854 ± 0.039
EVS 0.861 ± 0.040
Table 8: Performance of the Random Forest Model for Re-
gression (Romanian Regressor). 95% CIs are used for the
mean performance.
Performance Metric Romanian Regressor
MSE 0.202 ± 0.039
RMSE 0.449 ± 0.039
MAE 0.318 ± 0.042
R2 0.902 ± 0.041
EVS 0.905 ± 0.039
Table 9: Performance of the Random Forest Model for Re-
gression (Math Regressor). 95% CIs are used for the mean
performance.
Performance Metric Math Regressor
MSE 0.212 ± 0.038
RMSE 0.460 ± 0.038
MAE 0.325 ± 0.041
R2 0.898 ± 0.041
EVS 0.901 ± 0.038
Unlike the approach to the regression problem, to
solve the classification problem it was decided to de-
Prediction in Pre-University Education System Using Machine Learning Methods
435
velop a separate model for each exam grade, so we
developed two ANN architectures and two RF, below
we can see the tables showing the performances of
each model from the perspective of the performance
metrics presented in the previous section.
In table 10 are presented the results obtained for
the Romanian classifier for both ANN model and RF,
while in the Table 11 you can see the results for the
math classifier, again for both architectures. The re-
sults obtained for the two methods are quite close.
If a comparison is made between the regression and
classification results, it can be seen that the classifi-
cation models have more satisfactory results, which
was expected. Overall, the performance differences
are easily noticeable, when it comes to the values of
the four performance metrics checked, both types of
approaches provided satisfactory results.
Table 10: Performance of the Romanian Classifier for both
Artificial Neural Network and Random Forest models
Metric ANN Random Forest
Accuracy 0.8992 ± 0.012 0.9118 ± 0.003
Precision 0.8976 ± 0.013 0.9336 ± 0.003
Recall 0.8908 ± 0.015 0.9069 ± 0.003
F1 Score 0.8912 ± 0.012 0.9172 ± 0.003
Table 11: Performance of the Math Classifier for both Arti-
ficial Neural Network and Random Forest models
Metric ANN Random Forest
Accuracy 0.8876 ± 0.014 0.8984 ± 0.003
Precision 0.8858 ± 0.013 0.9226 ± 0.004
Recall 0.8903 ± 0.014 0.8956 ± 0.003
F1 Score 0.8892 ± 0.012 0.9032 ± 0.003
5.3 Comparison with Related Work
One of the reference works when it comes to the pre-
diction of student performance was published by Hilal
Almarabeh, (Almarabeh, 2017) presents results ob-
tained for the classification of academic data using
various ML methods, such as Naive Bayes, Bayesian
Networks, ID3, J48 and Neural Network (multilayer
perceptron).The best results presented in the article
above were obtained using Bayesian Network. The re-
sults obtained by the authors of this paper are similar
to those obtained by us. In the Table 1 are presented
the results obtained in the paper mentioned above.
In the paper (Siddiqui et al., 2019), authors used
three machine learning methods (Naive Bayes, Deci-
sion Tree and ANN) to predict student performance
taking into account features such as student absence
days in class and parents’ involvement in the learning
process. To evaluate the models, the authors used the
following performance metrics: accuracy, precision,
recall and f1-score.
An interesting study that addresses the topic
of predicting students’ academic performance intro-
duced by Francis et al. (Francis and Babu, 2019) be-
gins with a presentation of the current state of the spe-
cialized literature when it comes to predicting the aca-
demic performance of students, after which it presents
their methodology used in an attempt to identify fea-
tures for which the best results are obtained in the
prediction of academic performance. Four machine
learning models were used for data classification, they
are Support Vector Machine, Naive Bayes, Decision
Tree and Neural Network. The best ones presented
were obtained when features related to the academic
side, behavioral features, respectively some extra fea-
tures were used without taking into account demo-
graphic features.
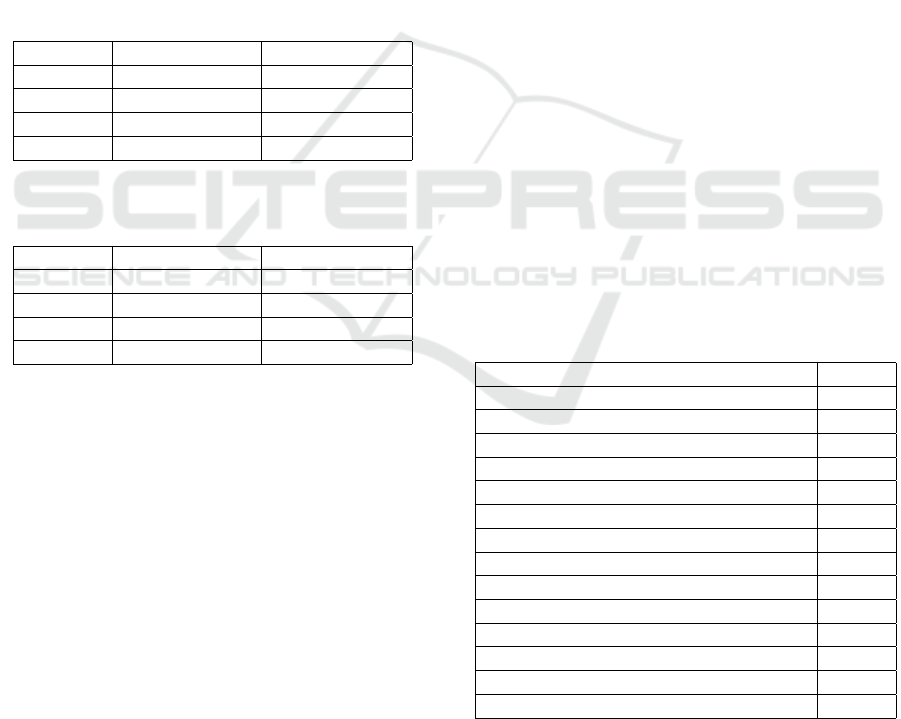
Most of the articles and studies in the related
works focus on the classification part, considering
this, the results from the classification models were
used to make the comparisons. In Table 12 you can
find the best performances presented in related work,
together with the best performances obtained by us
with the classification model. The data in the table
are ordered according to the accuracy value. It was
chosen to use this measurement in the paper because it
was the only performance measurement that appeared
in all the studies.
As can be seen in the table below, our results,
compare favourably with the literature.
Table 12: The accuracy of our models and the models from
the studies presented in related work
Machine Learning Approach Acc
Bayesian Network (Almarabeh, 2017) 0.9200
Our Random Forest model 0.9118
Naive Bayes (Almarabeh, 2017) 0.9110
J48 Classification (Almarabeh, 2017) 0.9110
NN (MLP) (Almarabeh, 2017) 0.9020
Our ANN model 0.8992
ID3 (Almarabeh, 2017) 0.8840
ANN (Siddiqui et al., 2019) 0.7810
Decision Tree (Francis and Babu, 2019) 07547
Decision Tree (Siddiqui et al., 2019) 0.7110
Naive Bayes (Siddiqui et al., 2019) 0.6760
SVM (Francis and Babu, 2019) 0.6604
Decision Tree (Francis and Babu, 2019) 0.6603
Naive Bayes (Francis and Babu, 2019) 0.5974
ICAART 2024 - 16th International Conference on Agents and Artificial Intelligence
436

6 CONCLUSIONS
In the current paper, the use of machine learning tech-
niques for predicting students’ academic performance
in the Romanian pre-university education system was
investigated. This research has offered helpful in-
sights into the effectiveness and promise of predictive
analytics in enhancing educational results by looking
at several ML algorithms and taking a variety of as-
pects into account.
This paper underlines the significance of incor-
porating technology breakthroughs into educational
practices by demonstrating the potential of machine
learning approaches. Predictive analytics may consid-
erably assist the Romanian pre-university education
system by optimizing resource allocation, enhancing
teaching methods, and eventually improving educa-
tional achievements for all students.
It is essential to acknowledge this study’s limita-
tions. The quality and representativeness of the given
datasets determine how accurate and generalizable the
prediction models are. Additionally, constant updates
and improvements to the models are required due to
the changing nature of the educational system in order
to maintain their usefulness and efficacy.
Within this paper it was obtained satisfactory re-
sults, making a comparison with related work it can
be seen that the results obtained are good. The find-
ings of this research contribute to the growing body of
knowledge on ML applications in education and pro-
vide a foundation for future studies aimed at enhanc-
ing educational practices and improving student out-
comes. Within the paper, it was managed to demon-
strate the efficiency of the Random Forest method
in comparison with other machine learning methods
when it comes to modelling academic problems.
Considering the importance of the educational
system, an application that manages to predict stu-
dents’ grades would be of real help, its use could help
in the early identification of students with problems,
so that they could be supported and helped to develop.
Future work would consist of creating a bigger
data set and testing and validating the models cre-
ated in this paper on this new data set, respectively,
trying to check what performance could be obtained
with other ML approaches. Considering the studies
presented in related work, the performance of models
such as Extreme Gradient Boosting, Bayesian Net-
work or Support Vector Machine could be checked.
Also, as future research, there is the aim to create
a recommendation system for students, which would
suggest which high school to attend based on their
academic performance in middle school. Such a rec-
ommendation system would be extremely beneficial
to the academic environment, being intended for both
teachers and students or parents. Considering the
openness shown by society towards software appli-
cations based on machine learning, it is believed that
such a system would catch on well and be used in the
academic environment.
REFERENCES
Almarabeh, H. (2017). Analysis of students’ performance
by using different data mining classifiers. Interna-
tional Journal of Modern Education and Computer
Science, 9(8):9.
Bakhshinategh, B., Zaiane, O. R., ElAtia, S., and Ipperciel,
D. (2018). Educational data mining applications and
tasks: A survey of the last 10 years. Education and
Information Technologies, 23:537–553.
Francis, B. K. and Babu, S. S. (2019). Predicting academic
performance of students using a hybrid data mining
approach. Journal of medical systems, 43:1–15.
Grandini, M., Bagli, E., and Visani, G. (2020). Metrics for
multi-class classification: an overview. arXiv preprint
arXiv:2008.05756.
Hutter, F., Kotthoff, L., and Vanschoren, J. (2019). Au-
tomated machine learning: methods, systems, chal-
lenges. Springer Nature.
Mohamad, S. K. and Tasir, Z. (2013). Educational data
mining: A review. Procedia-Social and Behavioral
Sciences, 97:320–324.
Naser, M. and Alavi, A. (2020). Insights into performance
fitness and error metrics for machine learning. arXiv
preprint arXiv:2006.00887.
Oppong, S. O. (2023). Predicting students’ performance
using machine learning algorithms: A review. Asian
Journal of Research in Computer Science, 16(3):128–
148.
Pe
˜
na-Ayala, A. (2014). Educational data mining: A sur-
vey and a data mining-based analysis of recent works.
Expert systems with applications, 41(4):1432–1462.
Probst, P., Wright, M. N., and Boulesteix, A.-L. (2019). Hy-
perparameters and tuning strategies for random for-
est. Wiley Interdisciplinary Reviews: data mining and
knowledge discovery, 9(3):e1301.
Salloum, S. A., Alshurideh, M., Elnagar, A., and Shaalan,
K. (2020). Mining in educational data: review and fu-
ture directions. In Proceedings of the International
Conference on Artificial Intelligence and Computer
Vision (AICV2020), pages 92–102. Springer.
Siddiqui, I. F., Arain, Q. A., et al. (2019). Analyzing stu-
dents’academic performance through educational data
mining. 3C Tecnologia.
Sindhu Meena, K. and Suriya, S. (2020). A survey on su-
pervised and unsupervised learning techniques. In
Proceedings of international conference on artificial
intelligence, smart grid and smart city applications:
AISGSC 2019, pages 627–644. Springer.
Prediction in Pre-University Education System Using Machine Learning Methods
437
