
Neural Bradley-Terry Rating: Quantifying Properties from Comparisons
Satoru Fujii
Kyoto University, Japan
Keywords:
Bradley-Terry Model, Rating, Neural Network.
Abstract:
Many properties in the real world doesn’t have metrics and can’t be numerically observed, making them diffi-
cult to learn. To deal with this challenging problem, prior works have primarily focused on estimating those
properties by using graded human scores as the target label in the training. Meanwhile, rating algorithms based
on the Bradley-Terry model are extensively studied to evaluate the competitiveness of players based on their
match history. In this paper, we introduce the Neural Bradley-Terry Rating (NBTR), a novel machine learning
framework designed to quantify and evaluate properties of unknown items. Our method seamlessly integrates
the Bradley-Terry model into the neural network structure. Moreover, we generalize this architecture further
to asymmetric environments with unfairness, a condition more commonly encountered in real-world settings.
Through experimental analysis, we demonstrate that NBTR successfully learns to quantify and estimate de-
sired properties.
1 INTRODUCTION
There are multitudes of properties humans can rec-
ognize. For some of them, we have well-defined
metrics: grams for weight, decibels for loudness, or
sometimes it’s just a number for counting. However,
most properties can’t be simply measured, and some
can’t be even directly observed: We don’t have met-
rics for the “attractiveness” of merchandise, nor can
we directly observe the “strength” of a deck in card
games. Our goal is to quantify those properties and
obtain an estimator of it.
One way to tackle this problem is to conduct a
survey and ask people to rate those properties on a
scale of 1 to 5, then use those scores as the target label
of supervised learning. However, those values don’t
have any meanings other than just being high or low,
making them rather superficial metrics.
On the other hand, many rating algorithms based
on Bradley-Terry Model (Bradley and Terry, 1952)
have been studied to estimate the strength of players
in a competitive environment. These methods allow
us to quantify the strength of players based on their
match histories: winning against other players makes
their estimated rating higher, more so if the oppo-
nent’s rating is high. However, those methods can be
used only on known items such as human players, and
thus can’t predict properties of unknown ones which
aren’t present in the comparison dataset.
In this paper, we introduce the Neural Bradley-
Terry Rating (NBTR), an ML framework that
seamlessly integrates traditional rating based on the
Bradley-Terry model into neural networks. This net-
work learns the quantification of properties based on
the results of comparisons. For example, our frame-
work can be used to obtain an estimator of:
• Appeal of the price and the description or pack-
age illustration of products, by learning what was
bought on e-commerce services or vending ma-
chines.
• Attractiveness of the name and the thumbnail im-
age or preview text, by learning what was clicked
on the internet search engine or online video plat-
form.
• Strength of a deck in card games, by learning
match histories.
• Beauty of a painting or palatability of a dish, by
learning a result of a human survey regarding their
preference.
We also introduce a generalization that discounts
the unfairness of the comparison to estimate ratings.
For instance, on internet search engine or e-commerce
platform, we usually prioritize the ones shown on the
upper side, and we rarely keep scrolling down and go-
ing next pages, resulting in unfair comparisons. Our
generalized NBTR architecture is designed to be ap-
plied to those asymmetric situations.
422
Fujii, S.
Neural Bradley-Terry Rating: Quantifying Properties from Comparisons.
DOI: 10.5220/0012355900003636
Paper published under CC license (CC BY-NC-ND 4.0)
In Proceedings of the 16th International Conference on Agents and Artificial Intelligence (ICAART 2024) - Volume 3, pages 422-429
ISBN: 978-989-758-680-4; ISSN: 2184-433X
Proceedings Copyright © 2024 by SCITEPRESS – Science and Technology Publications, Lda.

In some cases, comparison datasets can be ob-
tained without any surveys, like the first 3 examples
where we can automatically record users’ choices.
While learning some properties still requires a hu-
man survey, it’s easier to answer “which do you pre-
fer” questions than scoring them in a particular grade.
This makes the survey more reliable and precise. Fur-
thermore, since our method is based on the Bradley-
Terry model, the rating it yields is a scalar representa-
tion of competitiveness, which can be used to estimate
probabilities of winning or being selected over others.
We empirically show that our method is capable
of obtaining good quantification and estimator of the
target property. We also show the validity of our net-
work structure by comparing several possible variants
in our experiment.
2 BACKGROUND
2.1 Bradley-Terry Model
Bradley-Terry score π
i
is a scalar which represents
the competitiveness of player i. In this paper, we will
generalize this as the strength of a certain property of
item i. Let W
i j
be the winning probability of player
i against player j. Bradley-Terry model (Bradley and
Terry, 1952) assumes:
W
i j
=
π
i
π
i
+ π
j
Note that (π
1
,...,π
N
) is scale-free. In other
words, (π
1
,...,π
N
) is the same as (cπ
1
,...,cπ
N
) for
any constant c in terms of winning probabilities. We
simply can fix the average to uniquely determine
(π
1
,...,π
N
).
Given this model, we want to calculate the Max-
imum Likelihood Estimation (MLE) of (π
1
,...,π
N
)
from a match history among players 1,· · · ,N. How-
ever, there are situations where calculating MLE is
infeasible. For example, if player i won at least once
and never lost a single match, MLE of π
i
will diverge
to infinity. To calculate MLE, the following condition
should be met (Ford, 1957):
Condition 2.1. In every possible partition of the play-
ers into two nonempty subsets, some player in the sec-
ond set beats some player in the first set at least once.
Numerical approaches such as Minorization-
Maximization (MM) algorithm (Hunter, 2004) are
commonly used to approximately calculate these
MLE scores.
2.2 Generalizations of Bradley-Terry
Model
The Bradley-Terry model can be generalized for set-
tings where matches are held among more than 2
players by assuming the winning rate of player i in
a match among player 1,...,M to be:
π
i
∑
M
k=1
π
k
(1)
This can be also applied to a situation where the ranks
of players are decided rather than just a single winner,
by regarding the 2nd place to be the winner of the
competition of remaining M − 1 players.
For asymmetric environments where players com-
pete in unfair settings, a variant of the Bradley-Terry
model also has been proposed. It assumes
W
i j
=
ηπ
i
ηπ
i
+ π
j
(2)
where η > 0 is the strength of player i’s advantage.
Calculating MLE under those generalized mod-
els is also possible by using MM algorithms (Hunter,
2004).
2.3 Elo Rating
Elo Rating (Elo and Sloan, 1978) is an incremental
approach to estimate strength. It defines rating of
player i as
R
i
:= α log
10
π
i
+ β (3)
usually with α = 400,β = 1500,E[π
i
] = 1. Using a
logarithm for rating prevents the value from scaling
too much.
In Elo Rating, every player starts with a rating of
β. When player i wins w times among g matches
against player j, rating of player i will be refreshed
as
R
0
i
← R
i
+ k(w − gW
i j
)
where k is a learning rate. W
i j
is calculated from R
i
and R
j
.
Microsoft Research has proposed TrueSkill (Her-
brich et al., 2006), which combined the probability
graph model with Elo Rating and achieved increased
accuracy and convergence speed.
2.4 NN Modifications and Expansions
In some cases, we want to use shared weights for cer-
tain parameters of NN. This idea is introduced in the
context of natural language processing (Inan et al.,
2016).
Skip connection (He et al., 2016) is a method that
directly adds the output of some layer to another,
Neural Bradley-Terry Rating: Quantifying Properties from Comparisons
423

which was introduced and proved to be successful in
image recognition.
Using NN structure to transform the data into a
vector with lower dimensionality is a commonly ac-
cepted idea. Autoencoder (Hinton and Salakhutdi-
nov, 2006) is arguably the first one of those methods,
which learns dimensionality reduction by using the
input itself as a learning target with a small hidden
layer.
3 RELATED WORK
3.1 User Score Prediction
There has been extensive research in the area of user
score prediction such as 1-5 graded ratings. Collabo-
rative Filtering (Jalili et al., 2018) is an actively stud-
ied field, which aims to predict user ratings based on
past ratings. The problems of using user rating as
ground truth are also recognized in this field. Deep
Rating and Review Neural Network (DRRNN) (Xi
et al., 2022) uses review text as an additional target
for back-propagation to mitigate these problems.
3.2 Bradley-Terry Model and NN
There has been a small number of research that com-
bines the Bradley-Terry model with the neural net-
work.
NN Go rating model (Zhao et al., 2020) has been
proposed to estimate ratings of Go players present
in match history, combined with estimated intermedi-
ate winning rate during a match and history decay of
rating, and outperformed traditional rating algorithms
including Elo and TrueSkill. Both our objectives and
the network architecture are fundamentally distinct.
A previous research (Li et al., 2021) used a neu-
ral network to predict image beauty scores. They
calculated the MLE of Bradley-Terry scores of im-
ages by MM algorithm, then used winning proba-
bilities based on those scores as the target labels
in the training of NN. They focused on their spe-
cific image beauty task with their controlled dataset,
which resulted in important differences between our
approaches and theirs. Our method doesn’t require
any outside pre-calculation of Bradley-Terry scores,
which enables online learning and simplifies the im-
plementation. Furthermore, in a data-collecting envi-
ronment that isn’t statistically controlled, Condition
2.1 might not be held, which makes the calculation
of MLE impossible. Even if that’s not the case, since
Bradley-Terry scores for an item with a small num-
ber of matches would be less reliable, their method
will be unable to properly weigh the loss during the
training. We also generalized the architecture further
for asymmetric environments, where calculating the
MLE score is infeasible without using some simplifi-
cation like (2).
There also has been a work claiming to involve
Bradley-Terry artificial neural network model (Menke
and Martinez, 2008). It introduced a single-layer net-
work with 2 inputs fixed to -1 and 1 and was meant
to be an iterative algorithm to obtain individual rat-
ings, similar to Elo rating. Their structure is hardly a
“neural network model” as we call it today, and our
approach is simply different from theirs.
4 PROPOSED APPROACH
4.1 Symmetric Setting
In this section, we describe the architecture of NBTR.
The goal of NBTR is to estimate the rating, that is,
the quantification of a certain property of unknown
items that haven’t appeared in comparison histories.
Formally, we aim to obtain a NN we call rating es-
timator E : x
x
x
i
7→ R
i
, where scalar R
i
is the rating of
item i.
The training of NBTR uses a dataset where each
entry contains explanatory variables of M(≥ 2) items
(not necessarily human competitors), and the results
of comparison y
y
y, like which athlete won the match, or
which thumbnail was clicked. y
y
y is a M-dimensional
one-hot vector which represents what item won the
comparison. Formally, the shape of each entry of the
training data is (x
x
x
1
,· · · , x
x
x
M
,y
y
y), where x
x
x
i
is the vector
representation of item i.
To obtain E, we connect the outputs of M rating
estimators with shared weight via softmax function
(R
1
,· · · R
M
) 7→ (cπ
1
,· · · , cπ
M
) where
π
i
= e
R
i
, c =
1
∑
M
k=1
π
i
then use y
y
y as a target label with cross-entropy loss.
The output (cπ
1
,· · · , cπ
M
) is exactly the same as (1).
This structure is shown in Figure 1.
Since NN learns its parameters to minimize the
difference between (cπ
1
,· · · , cπ
M
) and actual com-
parison result y
y
y, π
i
will be the equivalent of Bradley-
Terry scores π
i
after enough training. For this rea-
son, we used the same notations for them. Since
R
i
= log π
i
, R
i
should be the equivalent of Elo Rating
values, where α = 1, β = log 10 with a certain scale
of π
i
in (3). Weight sharing forces rating estimators to
calculate the ratings of each item in the same manner,
allowing us to obtain a single rating estimator.
ICAART 2024 - 16th International Conference on Agents and Artificial Intelligence
424

Figure 1: The structure of NBTR for symmetric environ-
ments.
Figure 2: The structure of NBTR for asymmetric environ-
ments.
4.2 Asymmetric Setting
In many real-world environments, comparisons are
not made under fair conditions. However, we still
want to use NBTR in these asymmetric environments
to output ratings, whose value can be used to estimate
the results of comparisons as if items would be com-
pared on a fair condition.
To achieve this, we insert a NN A we call advan-
tage adjuster, which takes (cπ
1
,· · · , cπ
M
) as an in-
put, and aims to return the probability distributions of
each item winning the comparison, based on learned
unfairness of environment. We also use skip connec-
tion around it to prevent the situation where the rating
estimator deviates from the intended rating settings
due to the degree of freedom. For example, rating es-
timators may learn to output −R
i
instead of R
i
and
advantage adjuster will still be able to adapt to it and
properly predict the outcome. Skip connection is ex-
pected to solve this problem since A would learn to do
nothing if the environment turned out to be fair, and
otherwise change its parameters to somewhere around
there. This structure is shown in Figure 2.
As a benefit of using NN, advantage adjuster
should be capable of dealing not only with simple ad-
vantages such as (2) but also with relations between
positions. For instance, it should adapt to situations
where people tend to overrate an item sandwiched be-
tween less appealing items.
When external factors are believed to affect the
unfairness of the environment, it is possible to add
an environment vector e
e
e as an additional input to ad-
vantage adjuster. For example, home-court advantage
might be stronger on a sunny day due to more spec-
tators. In this case, the advantage adjuster should re-
ceive information about the weather as an additional
input.
5 EXPERIMENTS
5.1 Experiment for Symmetric Setting
Firstly, to measure the performance of our method in
a symmetric setting, we customized MNIST (LeCun
et al., 1998) dataset in a way that each entry has 2 im-
ages of handwritten letters and the result of the com-
parison, which is simply determined by which num-
ber is higher (random for ties).
For E, we used a simple NN with 2 hidden lay-
ers consisting of 512 nodes each. We used ReLU for
the activation function and Adam (Kingma and Ba,
2014) for the optimizer. We transformed 60000 and
10000 entries of the original data into the training and
test data with the same number of entries. Each im-
age on the original data was compared 2 times in our
transformation: with the image above and below. The
number of epochs was 5. We tried not to optimize net-
work parameters as that is not the goal of this paper.
Figure 3(a) is a scatter chart of the first 1000 en-
tries in test data with the actual number of the image
and the output of rating estimator R
i
. This shows that
our method successfully learned the quantification of
“number” only from the results of the comparisons,
despite the fact that this setting does not align well
with the assumption of the Bradley-Terry model.
In a world where we know all actual numbers of
the image, the ratio of π
i
: π
j
would be 1 : ∞ when the
actual number of image i lower than image j, since
there’s no chance i would win against j. However,
in our setting, the fuzziness of letters prevents this
from happening. For example, the average value of
R
i
on images of numbers 1 and 2 were 2.83 and 6.41
as shown in Table 1, which make π
i
16.86 and 610.37,
leading to 97.31% win rate of 2 against 1. This would
make sense considering the existence of a handwrit-
ten letter that looks like 1 while it’s actually 7 or 9
with an extremely small curve on top.
5.2 Experiment for Asymmetric Setting
Secondly, to measure the validity of our network
structure in asymmetric settings, we again customized
the MNIST dataset mostly in the same way, except
Neural Bradley-Terry Rating: Quantifying Properties from Comparisons
425
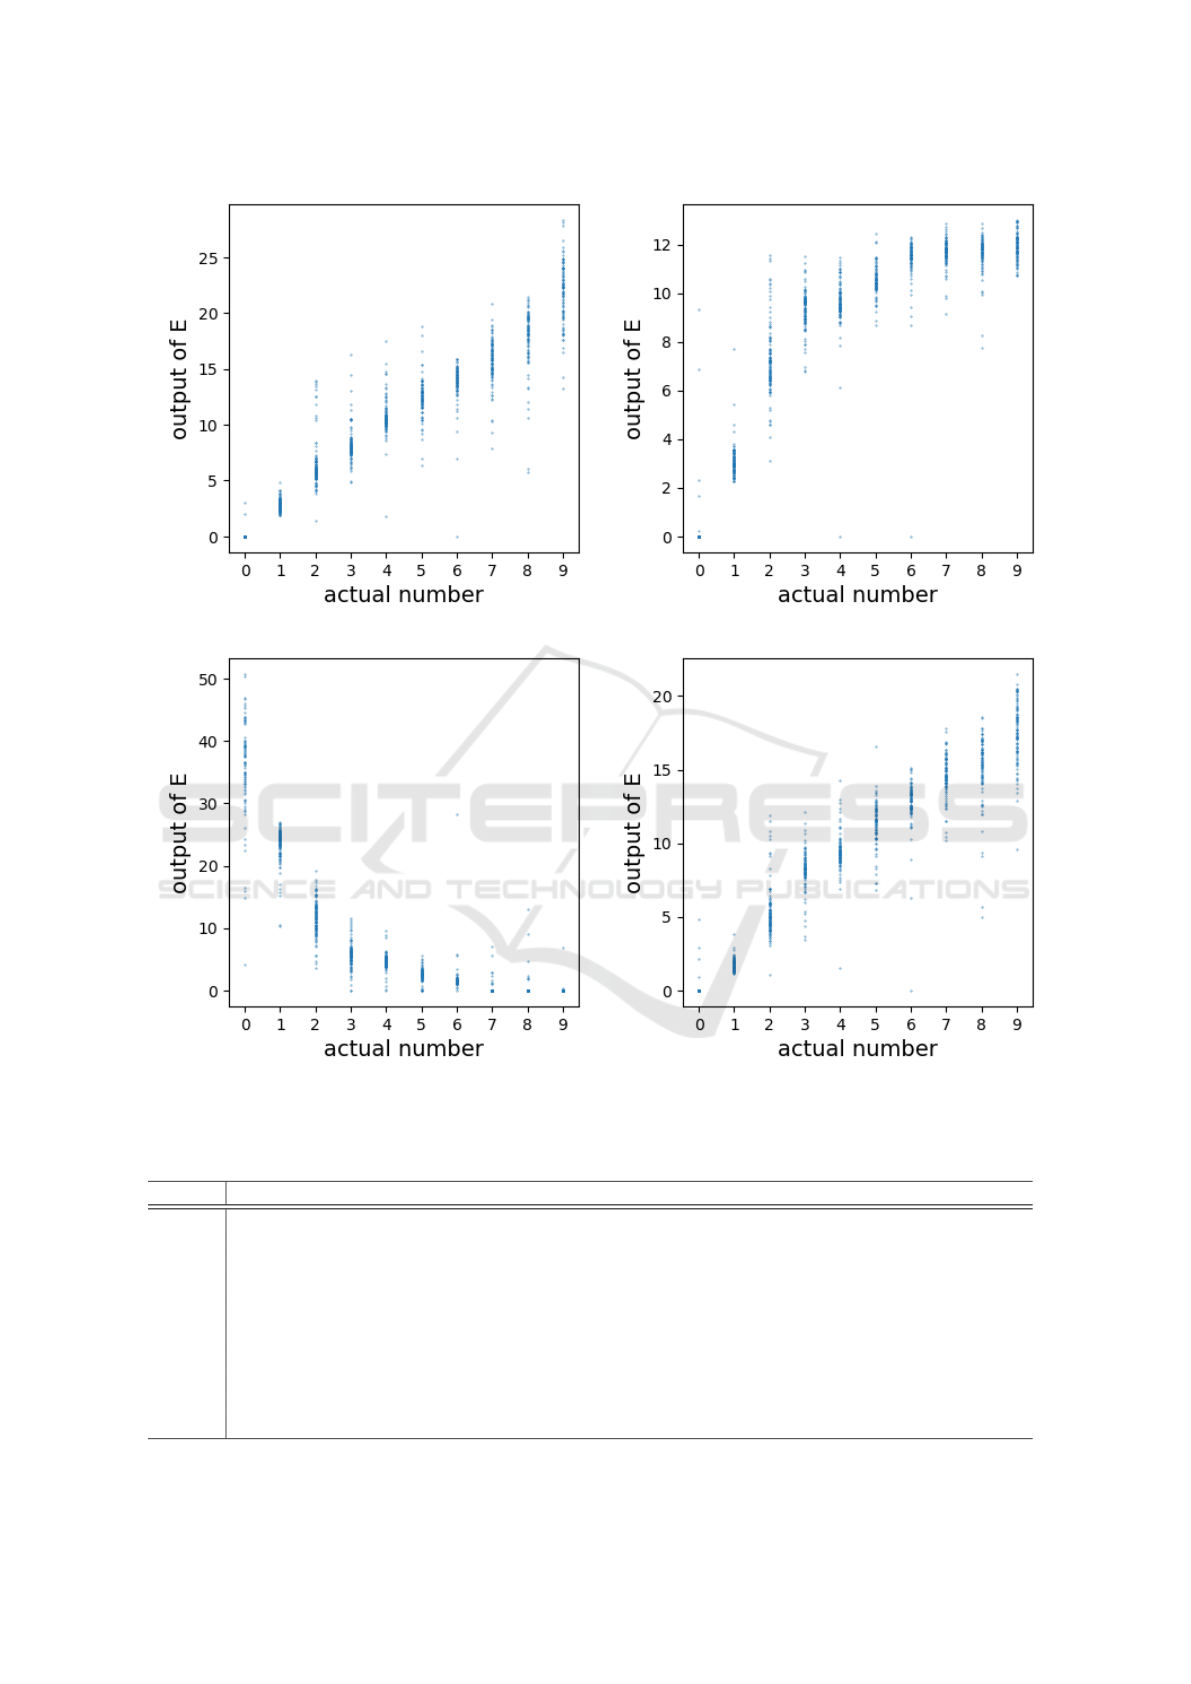
(a) Symmetric (b) Asymmetric without A
(c) Asymmetric with A without ⊕ (d) Asymmetric with A and ⊕
Figure 3: The results of MNIST expetiments.
Table 1: Average and standard deviation of E’s outputs.
Symmetric Asym wo/ A Asym with A wo/ ⊕ Asym with A and ⊕
0 0.06 ± 0.39 0.24 ± 1.27 35.71 ± 7.73 0.13 ± 0.65
1 2.83 ± 0.51 3.07 ± 0.61 23.46 ± 2.71 1.71 ± 0.38
2
6.41 ± 2.18 7.25 ± 1.47 11.68 ± 2.78 5.31 ± 1.69
3 8.20 ± 1.60 9.35 ± 0.80 5.7 ± 2.02 8.17 ± 1.31
4 10.72 ± 1.64 9.60 ± 1.17 4.61 ± 1.27 9.39 ± 1.30
5 12.40 ± 1.82 10.53 ± 0.62 2.48 ± 1.07 11.33 ± 1.51
6 13.73 ± 1.99 11.31 ± 1.37 1.9 ± 2.94 12.71 ± 1.84
7 15.69 ± 2.04 11.69 ± 0.55 0.26 ± 1.01 14.57 ± 1.40
8 17.71 ± 2.76 11.61 ± 0.75 0.39 ± 1.76 15.08 ± 2.31
9 21.85 ± 2.78 11.92 ± 0.54 0.08 ± 0.70 17.51 ± 2.05
ICAART 2024 - 16th International Conference on Agents and Artificial Intelligence
426
that this time the result labels were determined by the
comparison of (1.4 × the number of the left image +
0.1) with the number of the right image. We used a
simple 2-nodes linear layer for A, and the rest of the
settings were the same as the symmetric setting.
We compared three network structures in this ex-
periment: one without the advantage adjuster, one
with the advantage adjuster but without skip connec-
tion, and the one with both, which we propose. They
achieved 82.8%, 93.7%, and 94.6% accuracy on the
test dataset during the training, and the result of rat-
ing estimations are shown in Figure 3(b), 3(c), 3(d)
respectively. Note that due to the scale-free nature of
Bradley-Terry scores, we will focus on the shape of
the curve rather than the scale of the output values.
As shown in Figure 3(b), without the advantage
adjuster, rating estimations were distorted by envi-
ronmental unfairness. Although the structure without
skip connection achieved almost the same accuracy as
the full structure during the training, rating estimator
failed to learn desired quantification as shown in Fig-
ure 3(c). This kind of deviation is likely to happen
due to the degree of freedom as we discussed. Our
proposed structure was able to denoise the unfairness
of the environment and obtained a similar curve of
rating estimation to the one in a symmetric setting, as
shown in Figure 3(d).
5.3 Experiment on Pok
´
emon Dataset
Thirdly, we show a small example of the actual us-
age of our framework, closer to what we envision.
We used Weedle’s Cave (T7, 2017) dataset, which
contains 50000 match results between 800 Pok
´
emons,
generated by a custom algorithm that omits some me-
chanics of the game. As explanatory variables, we
used 6 base stats and an 18-dimensional 0-1 vector
which represents whether a Pok
´
emon has a certain
type or not. We separated 1/4 Pok
´
emons for the test
purpose, and only used matches that don’t involve
those Pok
´
emons for the training of NBTR (20% of
them were used for validation). Since Pok
´
emon battle
is a simultaneous game, we used symmetric NBTR
architecture. For E, We used a simple NN with 2 hid-
den layers consisting of 64 nodes each. The rest of
the settings are the same as the MNIST experiments.
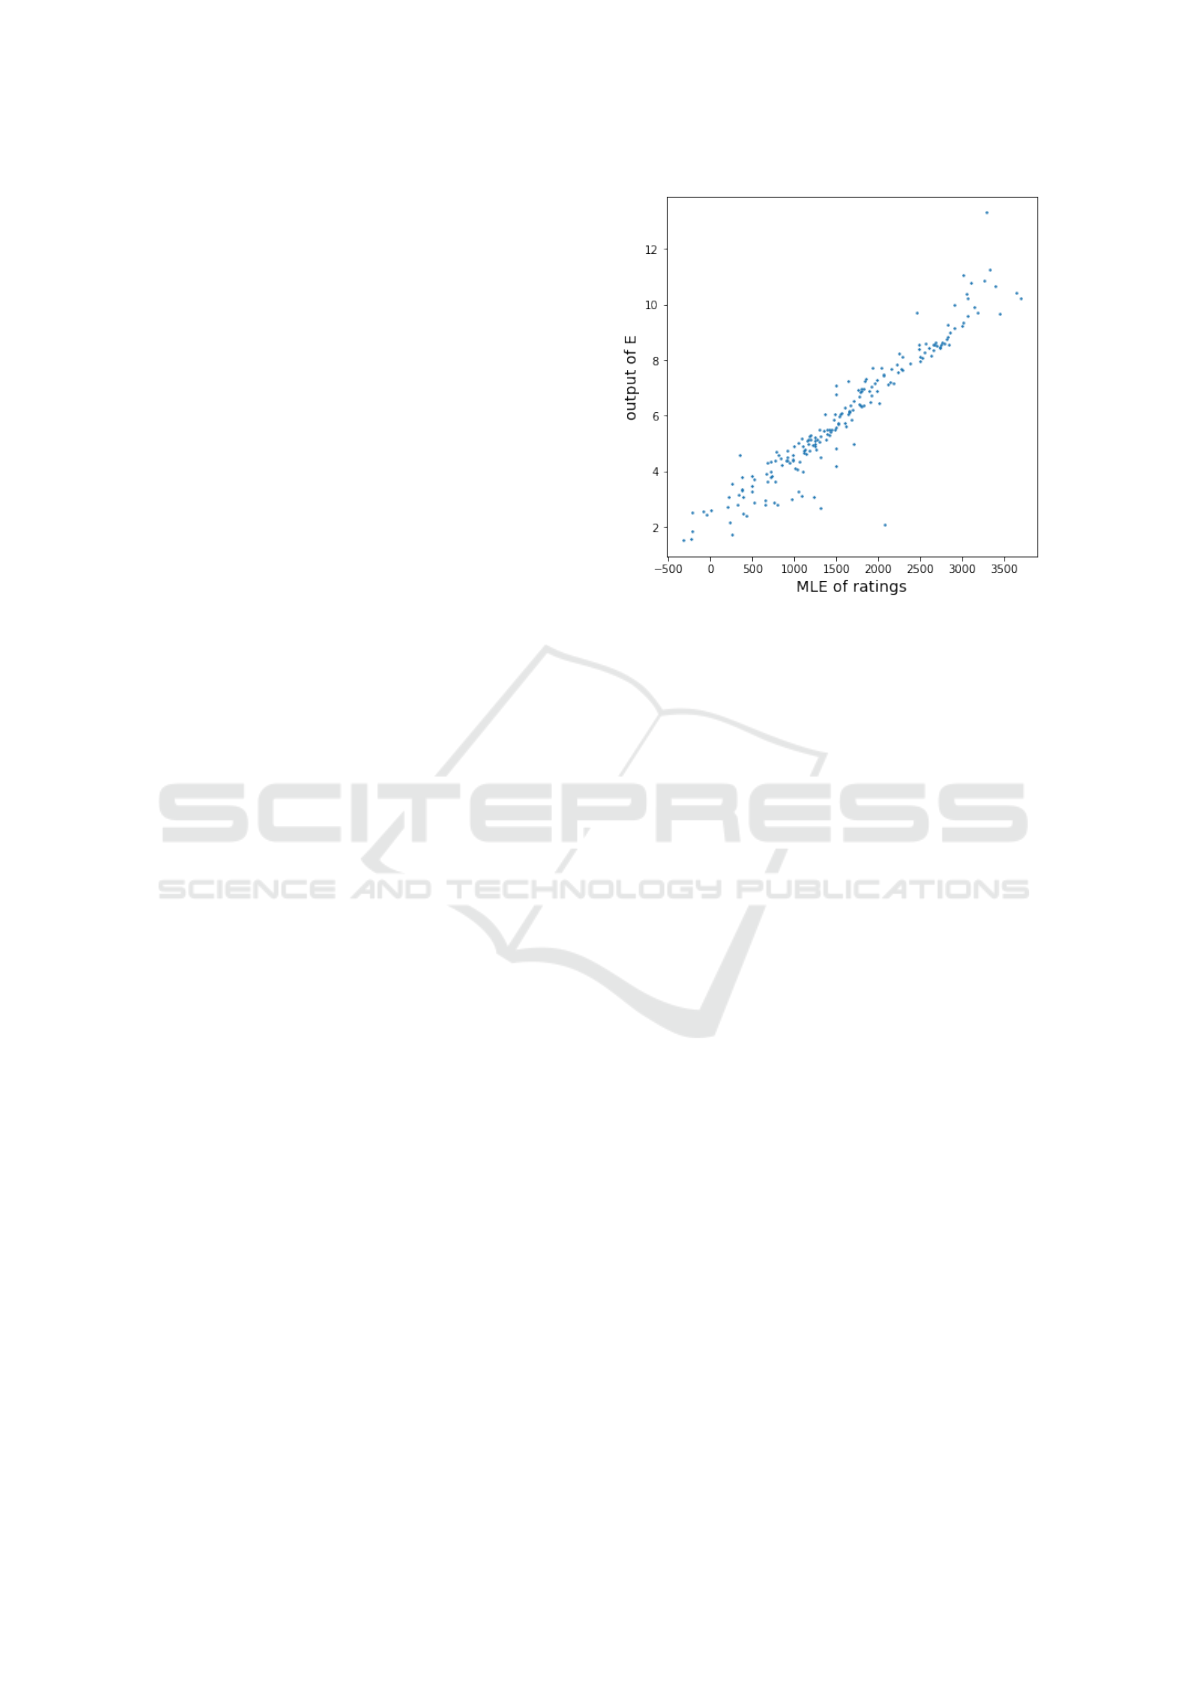
We compared the outputs of E and MLE ratings of
test Pok
´
emons (not included in the training dataset).
We calculated MLE scores from all match results us-
ing choix (Maystre, 2015), then transformed them in
the same manner as Elo rating. As shown in Figure
4, NBTR could estimate the proper ratings of unseen
Pok
´
emons with a 0.95 correlation coefficient. Table 2
shows the estimated strength of imaginary Pok
´
emons
Figure 4: The outputs of E and MLE ratings of test
Pok
´
emons.
or real Pok
´
emons not present in the dataset, obtained
by the same E as a showcase of the potential of our
method.
6 DISCUSSION
In asymmetric environments, the advantage adjuster
will help us to understand the strength of the unfair-
ness of the environment, since NBTR learns it simul-
taneously along with quantification of the property.
Using a small linear layer for A as we did in our ex-
periment should make it easily explainable.
Feature importance explanation methods such as
DeepSHAP (Lundberg and Lee, 2017) can be useful
to understand what feature matters more for strength
when used to a NBTR estimator. Unlike applying
it on a normal NN predictor of the winner, it will
prevent the feature relates to the intransitivities like
rock-paper-scissors mechanics from getting high im-
portance since their influence should be eliminated
from rating estimator’s scalar output. In other words,
feature importance on a normal classifier will tell you
what decides the winner of the match, while the one
on a NBTR estimator will tell you what decides over-
all strength.
7 CONCLUSION
In this paper, we proposed NBTR, an ML framework
to quantify properties and estimate those values of un-
known items by integrating the Bradley-Terry model
Neural Bradley-Terry Rating: Quantifying Properties from Comparisons
427

Table 2: Estimated strength of imaginary Pok
´
emons or real Pok
´
emons not present in the dataset. The last one is the Pok
´
emon
most frequently used in the official online single battles of the latest season at the time of the experiment, yielding higher
rating than others with the same or higher total stat.
HP Attack Defence Sp. Atk Sp. Def Speed Type Output of E
70 70 70 70 70 70 Steel 6.15
80 80 80 80 80 80 Steel 6.99
90 90 90 90 90 90 Steel 7.83
100 100 100 100 100 100 Steel 8.67
100 100 100 100 100 100 Fairy 8.65
100 100 100 100 100 100 Normal 8.58
100 100 100 100 100 100 Ice 8.54
100 100 100 100 100 100 Bug 8.52
100 134 110 70 84 72 Rock, Electric 6.28
55 55 55 135 135 135 Fairy, Ghost 9.84
into neural network structures. Our method success-
fully quantified desired properties in both symmetric
and asymmetric experimental settings.
Our framework provides a new ground for data
mining and poses an alternative to the format of
dataset, especially in environments where comparison
data is structurally easier to collect. In online plat-
forms where people choose and click something, we
can just record those choices as training data. The
same can be said for online multi-player games, as it
creates a lot of match results between decks or par-
ties. Even when a survey is required, gathering data
of comparisons can be a better option than graded
human scores, since comparisons are more precise
and reliable, and our rating based on it provides a
strong insight into the outcome of comparisons be-
tween items. We expect a lot of such applications be-
ing conducted in the future.
ACKNOWLEDGEMENTS
I would like to thank Professor Hideki Tsuiki for
meaningful discussions. I am also grateful to the
ICAART referees for useful comments.
REFERENCES
Bradley, R. A. and Terry, M. E. (1952). Rank analysis of in-
complete block designs: I. the method of paired com-
parisons. Biometrika, 39(3/4):324–345.
Elo, A. E. and Sloan, S. (1978). The rating of chessplayers:
Past and present.
Ford, L. R. J. (1957). Solution of a ranking problem
from binary comparisons. The American Mathemat-
ical Monthly, 64(8P2):28–33.
He, K., Zhang, X., Ren, S., and Sun, J. (2016). Deep resid-
ual learning for image recognition. In Proceedings of
the IEEE conference on computer vision and pattern
recognition, pages 770–778.
Herbrich, R., Minka, T., and Graepel, T. (2006).
Trueskill
TM
: a bayesian skill rating system. Advances
in neural information processing systems, 19.
Hinton, G. E. and Salakhutdinov, R. R. (2006). Reducing
the dimensionality of data with neural networks. sci-
ence, 313(5786):504–507.
Hunter, D. R. (2004). Mm algorithms for general-
ized bradley-terry models. The annals of statistics,
32(1):384–406.
Inan, H., Khosravi, K., and Socher, R. (2016). Tying word
vectors and word classifiers: A loss framework for
language modeling. arXiv preprint arXiv:1611.01462.
Jalili, M., Ahmadian, S., Izadi, M., Moradi, P., and Salehi,
M. (2018). Evaluating collaborative filtering recom-
mender algorithms: A survey. IEEE Access, 6:74003–
74024.
Kingma, D. P. and Ba, J. (2014). Adam: A
method for stochastic optimization. arXiv preprint
arXiv:1412.6980.
LeCun, Y., Bottou, L., Bengio, Y., and Haffner, P. (1998).
Gradient-based learning applied to document recogni-
tion. Proceedings of the IEEE, 86(11):2278–2324.
Li, S., Ma, H., and Hu, X. (2021). Neural image beauty
predictor based on bradley-terry model. arXiv preprint
arXiv:2111.10127.
Lundberg, S. M. and Lee, S.-I. (2017). A unified approach
to interpreting model predictions. Advances in neural
information processing systems, 30.
Maystre, L. (2015). choix.
https://choix.lum.li/en/latest/index.html.
Menke, J. E. and Martinez, T. R. (2008). A bradley–terry
artificial neural network model for individual ratings
in group competitions. Neural computing and Appli-
cations, 17:175–186.
T7 (2017). Pokemon- weedle’s cave.
https://www.kaggle.com/datasets/terminus7/pokemon-
challenge.
Xi, W.-D., Huang, L., Wang, C.-D., Zheng, Y.-Y., and Lai,
J.-H. (2022). Deep rating and review neural network
ICAART 2024 - 16th International Conference on Agents and Artificial Intelligence
428

for item recommendation. IEEE Transactions on Neu-
ral Networks and Learning Systems, 33(11):6726–
6736.
Zhao, R., Dang, R., and Zhao, Y. (2020). A neural network
go rating model considering winning rate. In Pro-
ceedings of the 2019 3rd International Conference on
Computer Science and Artificial Intelligence, CSAI
’19, page 23–27, New York, NY, USA. Association
for Computing Machinery.
Neural Bradley-Terry Rating: Quantifying Properties from Comparisons
429
