
Investigation of the Performance of Different Loss Function Types
Within Deep Neural Anchor-Free Object Detectors
Ala’a Alshubbak
1,2
and Daniel G
¨
orges
1
1
Institute of Electromobility, University of Kaiserslautern-Landau, Kaiserslautern, Germany
2
German Jordanian University, Amman, Jordan
Keywords:
Anchor-Free Object Detection, Deep Learning, ResNet, IOU Losses, Attention Mechanism, Saliency Map.
Abstract:
In this paper, an investigation of different IoU loss functions and a spatial attention mechanism within anchor-
free object detectors is presented. Two anchor-free dense predictor models are studied: FASF and FCOS
models. The models are tested on two different datasets: the benchmark COCO dataset and a small dataset
called OPEDD. The results show that some loss functions and using the attention mechanism outperform their
original counterparts for both the huge multi-class COCO dataset and the small unity-class dataset of OPEDD.
The proposed structure is tested over different backbones: ResNet-50, ResNet-101, and ResNeXt-101. The
accuracy of basic models trained over the coco dataset improves by 1.3% and 1.6% mAP for the FSAF and
FCOS models based on ResNet-50, respectively. On the other hand, it increases by 2.3% and 15.8% for the
same models when trained on the OPEDD dataset. The effect is interpreted using a saliency map.
1 INTRODUCTION
Deep learning is a new machine learning technique
that uses deep neural networks to perform various
tasks e.g in robotics, natural language processing, and
image recognition. In computer vision, these net-
works are trained on large datasets to learn patterns
and features in visual data, enabling them to perform
tasks such as object detection, image classification,
and segmentation. By leveraging the representational
power and robustness of deep learning models, com-
puter vision applications can achieve state-of-the-art
performance.
Deep learning-based object detection is divided
into two approaches: anchor-free and anchor-based
detectors (Liu et al., 2020). Anchor-free detectors
are different from anchor-based ones in the technique
used to produce the boundary box of objects. The lat-
ter approach relies on pre-defined anchor boxes, while
the first one uses mostly multi-level Feature Pyra-
mid Network (FPN) (Lin et al., 2017a) prediction to
extract the necessary features for each object. The
anchor-based approach is considered the more accu-
rate one, but with some disadvantages. It is more
complex and requires more time in the training phase.
On the other hand, an anchor-free approach is a new
approach that gets rid of some problems present in the
previous approach, such as creating multi-proposed
regions and the imbalance between negative and pos-
itive samples.
Anchor-free detectors are still an emerging area of
research and worth investigating further. Relatively
little effort has been spent so far in improving the
performance of anchor-free detectors and deploying
them in real-time applications. In this work, two of
the anchor-free dense predictors are used, the Feature
Selective Anchor-Free Module (FSAF) (Zhu et al.,
2019a) and the Fully Convolutional One-Stage Ob-
ject Detection (FCOS) (Tian et al., 2019), as those
two models are the most popular dense models that
are based on both FPN and Intersection over Union
(IoU) loss for bounding box regression. In this paper
the effect of using different types of IoU losses within
the anchor-free dense predictors is investigated, with
a focus on applications in rural environments, which
has rarely been discussed before. Figure 1 shows the
general structure of such dense anchor-free models.
In the investigations the spatial attention mechanism
(Zhu et al., 2019b) is included within the backbone of
the models to enhance their performance. It is shown
that by using such technique, anchor-free dense pre-
dictors can be improved depending on to their struc-
ture by 0.8% and 0.4% mAP for FSAF and FCOS
ResNet-50 models, respectively. Moreover this im-
provement does not increase the complexity of the
original deep neural network model.
Alshubbak, A. and Görges, D.
Investigation of the Performance of Different Loss Function Types Within Deep Neural Anchor-Free Object Detectors.
DOI: 10.5220/0012354900003636
Paper published under CC license (CC BY-NC-ND 4.0)
In Proceedings of the 16th International Conference on Agents and Artificial Intelligence (ICAART 2024) - Volume 3, pages 401-411
ISBN: 978-989-758-680-4; ISSN: 2184-433X
Proceedings Copyright © 2024 by SCITEPRESS – Science and Technology Publications, Lda.
401
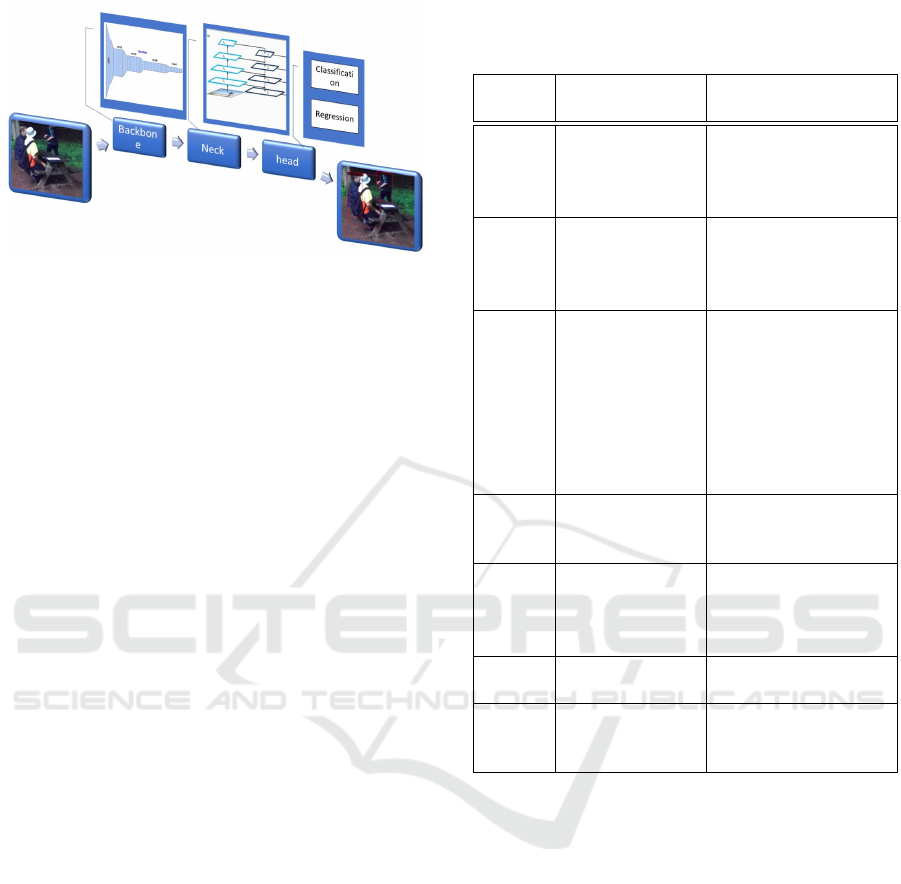
Figure 1: General structure of dense anchor-free model.
The paper is divided into five sections: the first
one introduces previous work while the second one
describes the architecture of the proposed approach.
The third section explains the setup of the environ-
ment, the datasets, and the evaluation criteria. The re-
sults and discussion section provides a detailed expla-
nation of the performance of the proposed approach.
Lastly, future directions are discussed.
2 RELATED WORK
Much previous work has focused on detecting hu-
mans in urban environments using various datasets
such as KITTI (Geiger et al., 2012), Caltech (Doll
´
ar
et al., 2009) Pedestrian Detection, and Oxford (Mad-
dern et al., 2017). However, the detection of humans
in rural environments remains a challenging task, with
fewer datasets and less effort put into this field. The
rural environment is highly unstructured, and its char-
acteristics are different from those of urban envi-
ronments, making it more challenging to detect hu-
mans. Table 1 shows a detailed comparison between
the two environments in terms of detecting humans.
Three approaches are reported in literature to detect
humans in orchards and suburban environments, in-
cluding classical machine learning approaches such
as rigid object detectors and deformable parts models,
as well as deep convolutional neural network mod-
els. Most of the state-of-the-art object detectors based
on deep neural networks have been trained on bench-
mark datasets such as COCO (Lin et al., 2014). Re-
lying on transfer learning between urban and rural
environments leads to low-performance results, and
researchers have had to train new models with new
datasets from the rural domain (Neigel et al., 2020;
Neigel et al., 2021).
The focus of this paper is to investigate models
that are based on a deep learning (DL) approach with
a less complex structure and enhance their perfor-
mance and speed to compete with existing detectors.
Table 1: Difference between urban environment and subur-
ban or rural environment in the detection of humans (Jiang
et al., 2021; Xiang et al., 2020; Kragh et al., 2017).
Items Urban environ-
ment
Suburban environ-
ment
Human
Pose
Limited poses,
such as walking,
standing, and
riding a bike.
More challenging
poses, such as jump-
ing, crouching, lying,
and bending.
HOG
Visual-
ization
Non-uniform,
easy to dis-
cover different
patterns.
Uniform patterns,
have repetitive tex-
ture.
Datasets Rich & multiple
datasets: KITTI,
Caltech-USA,
Oxford dataset .
Fewer datasets, such
as RELLIS-3D (Jiang
et al., 2021), OPEDD
(Neigel et al., 2020),
FieldSAFE (Kragh
et al., 2017), and KIT
MOMA(Xiang et al.,
2020).
Problem Mostly dense ob-
jects
More partially oc-
cluded, dense and
small objects
Back-
ground
Charac-
teristic
Low texture, rep-
resented by hori-
zontal and verti-
cal edges.
More complex texture
distributed over differ-
ent orientations.
Content
Relation
More contextual
information
Less contextual infor-
mation.
Detector
Paradigm
Traditional
methods (SVM,
DPM) and DL
Less work, mostly
DL with sensor fusion
(Jiang et al., 2021)
According to that, only anchor-free detectors are used
and tested with a small, specific dataset as well as a
benchmark dataset, which will enhance the reliability
of the proposed approach.
3 MODEL ARCHITECTURE
3.1 Model Structure
The architecture of object detectors mainly consists
of three components: the backbone, the neck, and the
head. The first two parts are responsible of feature
extraction, while the head part is used for classifica-
tion and regression of an object and its bounding box.
Dense anchor-free detectors share the same structure
using a backbone from the ResNet family (He et al.,
2016; Xie et al., 2017) and a neck using FPN (Lin
et al., 2017a).
The FSAF and FCOS models used in this paper
ICAART 2024 - 16th International Conference on Agents and Artificial Intelligence
402
are different in the way of regression of the bound-
ing boxes of the objects in their head part. The FSAF
model uses the idea of a 4-dimensional vector for re-
gression, while the FCOS model uses a centerness
loss to adjust the bounding box according to the cen-
ter of the object. Both of these models use focal loss
(Lin et al., 2017b) for classification.
3.2 Loss Functions
In object detection models, two types of loss func-
tions are used: one for classification and another for
regression of bounding boxes. Cross-entropy loss is
mostly used in anchor-based detectors for classifica-
tion, while focal loss is used in anchor-free detectors.
Regression loss is used to optimize the position of the
bounding boxes and smooth L1 loss or cross-entropy
loss is used in anchor-based detectors, while Intersec-
tion over Union (IoU) loss (Yu et al., 2016) is used in
dense predictors. Recently, modifications have been
proposed for IoU loss to improve its performance, in-
cluding GIoU (Rezatofighi et al., 2019), DIoU, and
CIoU loss (Zheng et al., 2020). The general defini-
tion of the Intersection over Union (IoU) loss is
IoUloss = 1 −
intersection(Bb
Predict
, Bb
Ground
)
union(Bb
Predict
, Bb
Ground
)
(1)
where Bb
Predict
is the bounding box of prediction
while Bb
Ground
is the bounding box of ground truth.
The modifications of IoU loss for improving its per-
formance are defined by
1. Generalized IoU (GIoU) (Rezatofighi et al., 2019)
G
IoU
= 1 − IoU +
|c \ union(Bb
Predict
, Bb
Ground
)|
|c|
(2)
where c is the smallest enclosing object covering
both Bb
Predict
and Bb
Ground
.
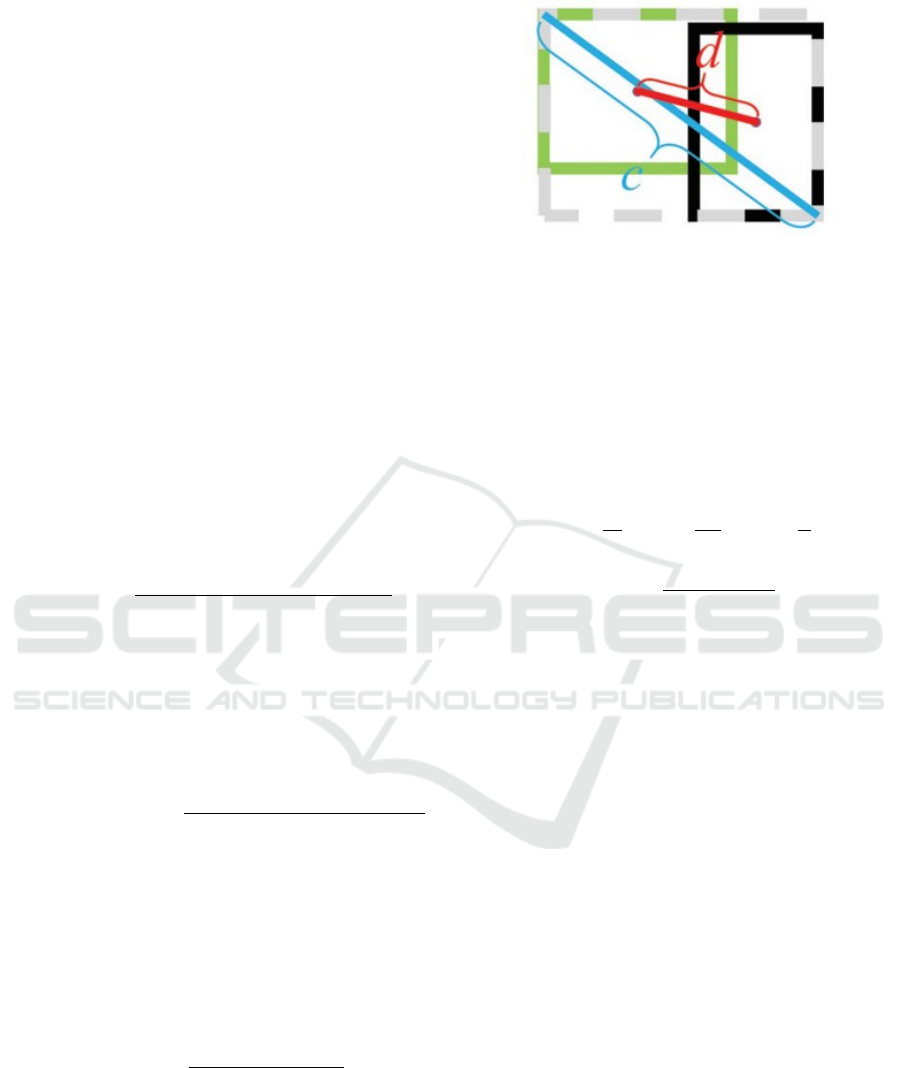
2. Distance IoU (DIoU) (Zheng et al., 2020)
D
IoU
= 1 − IoU + R
DIoU
(3)
where R
DIoU
is a penalty term of the central dis-
tance
R
DIoU
=
ρ
2
(b
Predict
, b
Ground
)
c
2
(4)
where b
Predict
and b
Ground
are the central points of
Bb
Ground
and Bb
Predict
, ρ is the Euclidean distance
between the two center points, and c is the diago-
nal length of the smallest enclosing box covering
the two boxes. Figure 2 shows all parameters that
are used in the adjustment of DIoU loss regres-
sion.
Figure 2: DIoU loss function representation with distance
d between central points of ground truth box (green) and
predicted box (black) and c as diagonal length of the small-
est enclosing box (grey) that covers those two boxes (Zheng
et al., 2020).
3. Complete IoU (CIoU) (Zheng et al., 2020)
C
IoU
= D
IoU
+ αυ (5)
where α is a trade-off parameter and υ is the as-
pect ratio which are described by
υ =
4
π
2
arctan
w
gt
h
gt
− arctan
w
h
2
(6)
α =
υ
(1 − IoU)+ υ
(7)
where w
gt
and h
gt
are the width and height of the
ground truth bounding box and w and h are the
width and height of the predicted bounding box.
The main difference between these losses is the in-
troduction of new terms, such as central point dis-
tance, overlap area, and aspect ratio. Most research
in anchor-based detectors shows that systems using
CIoU loss converge faster and provide more accurate
object localization results. The investigation of dif-
ferent IoU losses within anchor-free detectors has not
been covered yet. It is the topic of this paper.
3.3 Attention Mechanism
The attention mechanism has been inspired by the hu-
man visual system (Guo et al., 2022) with which hu-
mans can understand what is in the scene and where
it is from the initial glance. Essentially, deep neu-
ral network researchers try to further improve the per-
formance of CNNs by adding mechanisms to answer
questions such as what to pay attention to (channel
attention), where to pay attention (spatial attention),
when to pay attention (temporal attention), and which
to pay attention to (branch attention).
In this paper, a spatial attention mechanism (Zhu
et al., 2019b) in a plug-in manner is used instead
of using a combination of channel and spatial ones
Investigation of the Performance of Different Loss Function Types Within Deep Neural Anchor-Free Object Detectors
403
as most researchers mention that a spatial attention
mechanism is suited for dense prediction situations,
while channel attention is rather used for classifica-
tion tasks (Guo et al., 2022).
Figure 3: Plug-in attention block in purple within the resid-
ual block in ResNet (Zhu et al., 2019b).
The spatial attention mechanism in general has
four main factors from which the attention model as-
signs weights to the key with respect to the query (Zhu
et al., 2019b). Those factors are (i) the query and key
content ε1, (ii) the query content and relative position
ε2, (iii) the key content only ε3, and (iv) the relative
position only ε4.
This attention layer has been added into two stages
within the ResNet-50 model: stage 4 (Residual Block
4) and stage 5 (Residual Block 5). Its exact location is
shown in Figure 3, which is between the 3x3 convo-
lutional layer and the 1x1 convolutional layer for all
residual blocks in both stage 4 and stage 5.
Our model uses the factor of key content only (ε3)
which generates higher performance. Figure 4 shows
the modified structure of the proposed model after
adding the spatial attention block and with the loss
functions.
4 DATASETS AND TRAINING
ENVIRONMENT
4.1 Dataset and Evaluation Criteria
Different datasets have been produced in the field of
agriculture as well as suburban and rural settings,
even though those datasets are still fewer than the
ones used to detect and recognize objects in urban set-
tings. In this paper, the dataset OPEDD (Neigel et al.,
Figure 4: Modified structure of the FSAF model that used
in this work.
2020) is used, which consists of two types of suburban
environments: meadow areas or construction areas. It
consists of 1018 images captured by a stereo camera.
845 images are used for training purposes, 88 images
for testing and 82 images for validation. All samples
contain at least one human as a major category to be
detected.
Three main evaluation parameters are used in this
investigation: the mean average precision (mAP),
the floating-point operations FLOPs (GFLOPs), and
trained parameters as well as the average iteration
time (seconds per iteration).
The mean average precision is a representation of
the accuracy of the model while the iteration time is
an indication of training speed. On the other hand,
the FLOPs and trained parameters give an initial in-
dication of the complexity of each model. This factor
is not so accurate, as it does not include the attention
mechanism layers. Table 2 shows the FLOPs and the
parameters for different models for comparison. The
bar charts in Figure 5 show the differences in average
iteration time for different anchor-free model struc-
tures for both FSAF and FCOS models.
All methods presented in this paper are tested for
three main sizes of the object (small, medium, and
large) and under different threshold values for Inter-
section over Union (IoU) (50% and 75%). Tables 3,
4, and 5 show the performance of each of the models
used in this paper and the effect of using the spatial
attention mechanism within the structure.
4.2 Training Environment
The experiments are carried out on a machine with
one NVIDIA RTX A6000 GPU using the ResNet
family (He et al., 2016; Xie et al., 2017) for dense
ICAART 2024 - 16th International Conference on Agents and Artificial Intelligence
404
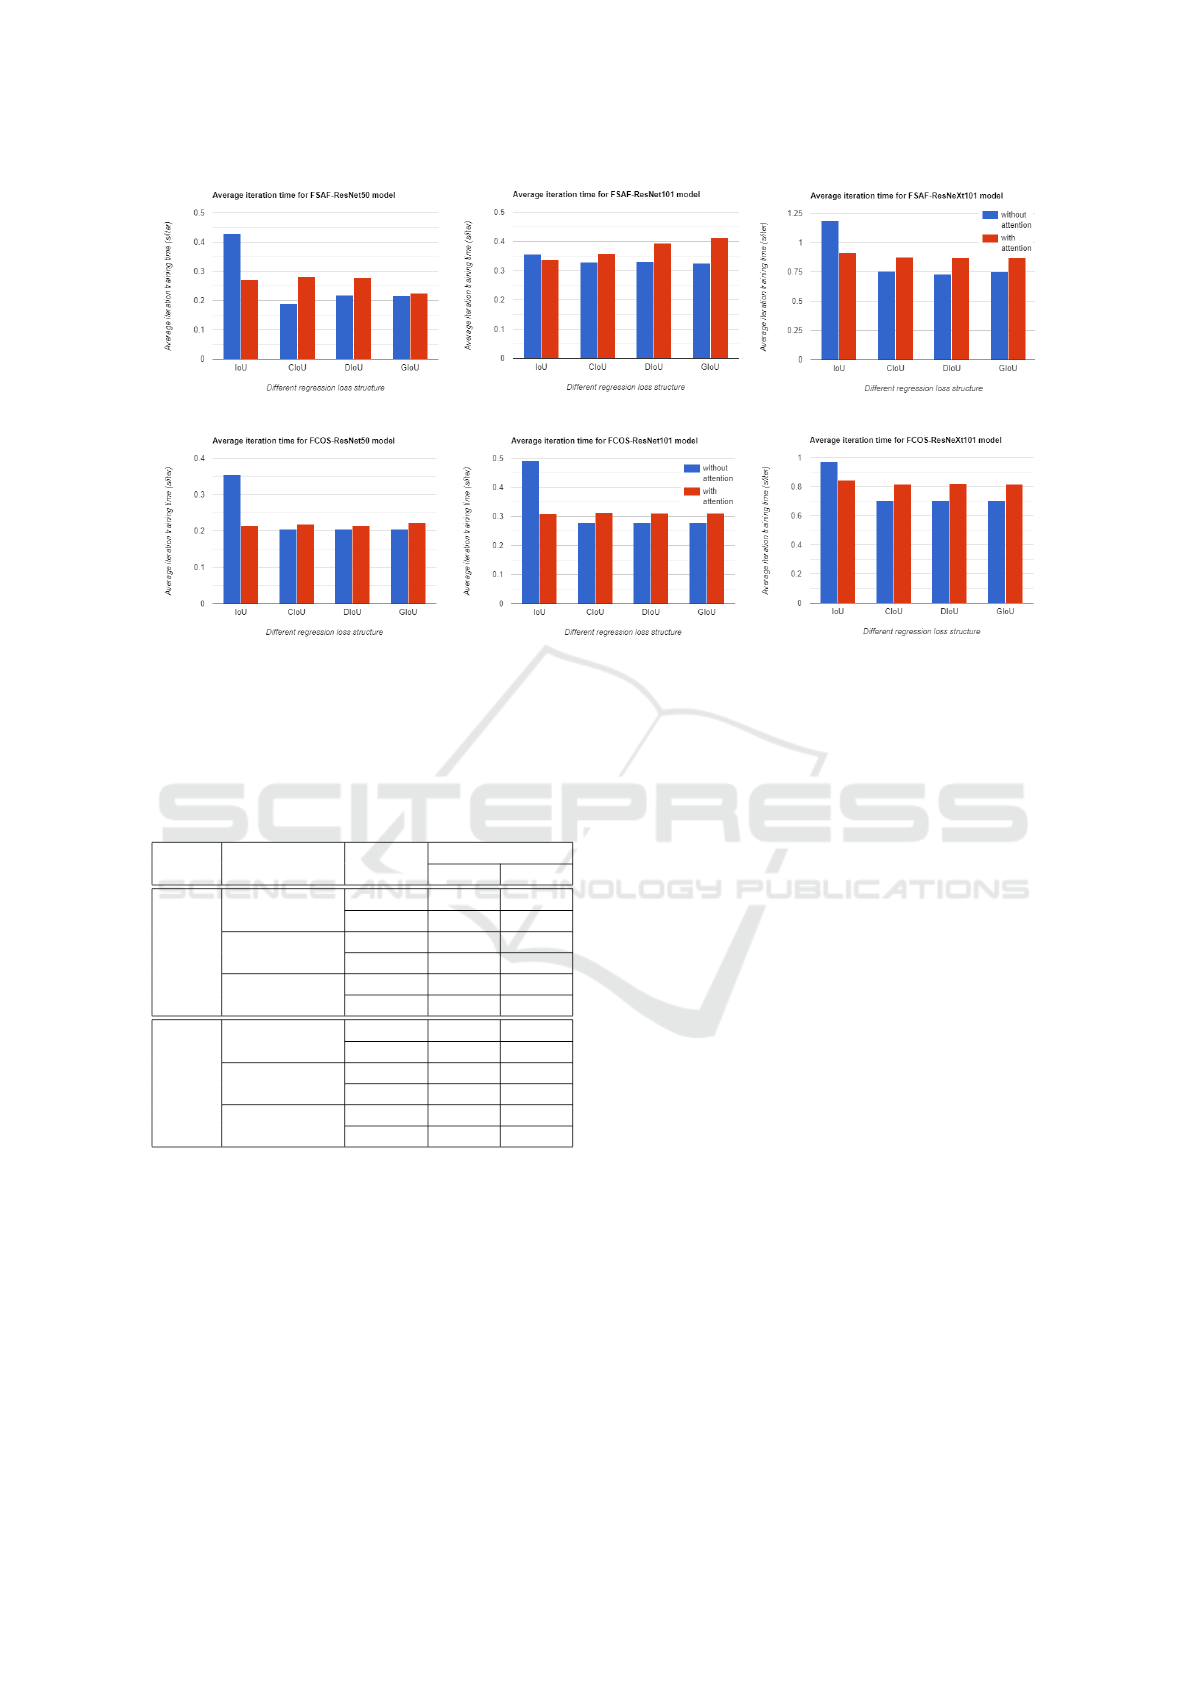
(a) The FSAF model
(b) The FCOS model
Figure 5: Average iteration time for both the FSAF and FCOS models with different structures trained on the COCO bench-
mark dataset.
Table 2: Complexity measurements for both FSAF and
FCOS model with different backbone structures with and
without Spatial Attention Mechanisms.
Model Backbone Structue
Complexity
Flops Param
FSAF
ResNet-50
w/o att 206.28 36.19
w att 207.48 39.74
ResNet-101
w/o att 282.35 55.19
w att 285.8 62.08
ResNeXt-101
w/o att 439.57 93.92
w att 494.49 204.08
FCOS
ResNet-50
w/o att 200.55 32.02
w att 201.75 35.56
ResNet-101
w/o att 276.62 50.96
w att 280.07 57.86
ResNeXt-101
w/o att 438.59 89.79
w att 493.5 199.95
detectors (Kong et al., 2020; Tian et al., 2019; Zhu
et al., 2019a). The original resolution of the input
images is 2208 x 1242, which is changed into differ-
ent sizes, mainly 1333 x 800 for anchor-free dense
predictors. The model is trained over 12 epochs for
the COCO benchmark dataset and over 30 epochs
for the OPEDD dataset. All models are trained on
a batch size of 2 except the FSAF model trained over
the OPEDD dataset where a batch size of 4 is used.
The MMDetection open-source toolbox (Chen et al.,
2019) is partially used to design the modified model
and plug in the attention mechanism block.
5 RESULTS AND DISCUSSION
5.1 Performance of Models on OPEDD
Dataset
The main result is presented in Table 3. It shows a
comparison in Mean Average Precision (mAP) be-
tween baseline structures of both FSAF and FCOS
dense object detectors and our proposed structures.
It is obviously seen that using the CIoU loss with
the spatial attention mechanism in an anchor-free de-
tector improves the detection accuracy with 2.3 %
mAP compared to the baseline structure of the FSAF
model. Additionally, it shows an increase of 16.1%
mAP compared to the baseline structure of the FCOS
model. Moreover, the result shows that the changes
within the structure and architecture of the FSAF
model enhance the detection of small objects which is
one of the challenging topics in computer vision and
object detection (Tong et al., 2020). The proposed
approach enhances the detection of small, medium,
and large objects by 2.8%, 5.9%, and 1.6% mAP re-
spectively. Corresponding results are obtained for the
FCOS model with a ratio of 2.9%, 11.9%, and 35.6%
mAP, respectively.
Further analysis is mentioned in Table 4. A base-
line structure for both FSAF and FCOS models pre-
trained on a benchmark COCO dataset is used as
a transfer learning stage for training all new pro-
Investigation of the Performance of Different Loss Function Types Within Deep Neural Anchor-Free Object Detectors
405
posed structures on the OPEDD dataset. The results
show that the modified structure with spatial attention
and GIoU loss outperforms the baseline structure by
0.4% for the FSAF model and by 0.7% for the FCOS
model.
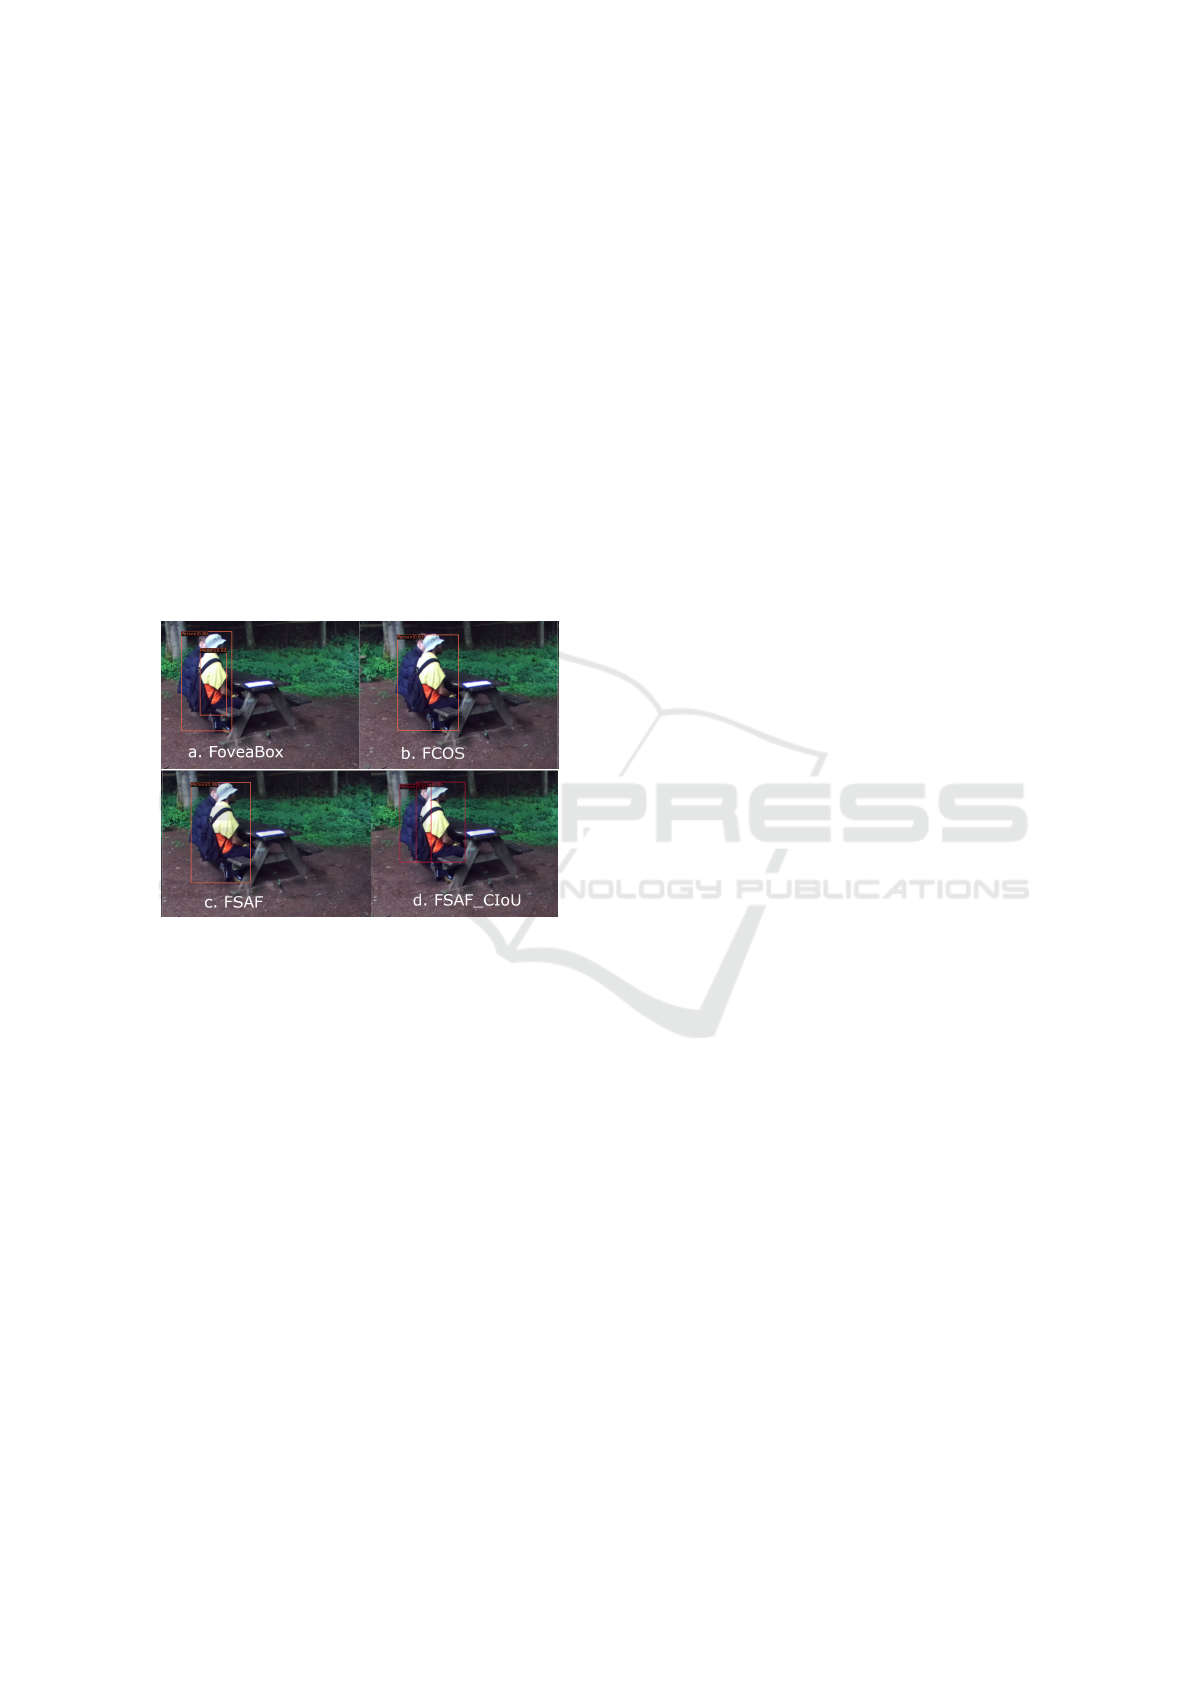
Figure 6 shows exemplary results of detecting hu-
mans using dense predictors. The figure illustrates
the improvement of the proposed FSAF model with
the new structure over the original structure as well
as over other dense predictor structures such as Fove-
aBox (Kong et al., 2020) and FCOS all of which have
the same backbone of ResNet-50 (He et al., 2016). It
is noticeable that both the FSAF and FCOS models
in their original structure which contains an IOU loss
can not detect humans in occluded situations, while
the proposed modification in the FSAF model makes
it more accurate without huge changes in the deep
structure of the neural network.
Figure 6: Results of detecting a human in a dense (oc-
cluded) situation using different dense predictors, a. Fove-
aBox, b. FCOS, c. FSAF with normal IoU loss, and d. new
FSAF structure with an attention mechanism. All models
have the backbone of ResNet-50. .
5.2 Saliency Map for an Explanation of
Deep Neural Network Behavior
A saliency map is a technique used to highlight the
most important features in computer vision that af-
fect the detection process. The D-RISE saliency map
(Petsiuk et al., 2021) is used in this work to give a
clear overview of what is going on behind the models
and their structure. It shows how each model looks
at the features within the images, and how to detect
each category. The D-RISE approach has been cho-
sen over other saliency methods as it has the ability to
explain different types of object detectors, both one-
stage and two-stage detectors. Figure 7 shows the
different saliency maps produced after changing the
FCOS ResNeXt-101 and FSAF ResNet-50 models.
The saliency maps of the ResNeXt backbone model
are darker and more accurate as the model is deeper
with a huge number of layers in its backbone.
5.3 Ablation Study
In order to assess the reliability of the proposed struc-
tures, the proposed modifications are designed with
both FSAF and FCOS and tested with the huge bench-
mark COCO dataset. The results of two different
backbones are recorded and compared with the origi-
nal structure. Table 5 contains the accuracy of FSAF
and FCOS with a ResNet-50 backbone, respectively.
The results show that both models that have DIoU
and CIoU losses give the most accurate results in
comparison with the theoretical baseline structures,
even when changing the backbone from ResNet-50
to a deeper one such as ResNeXt-101 (see Appendix
A). The modification structures show an increasing
of mAP by 1.3% for FSAF model and 1.6% for the
FCOS model. Figure 8 presents some results of the
FCOS model trained on the COCO dataset with dif-
ferent IoU loss functions. It shows that the model with
DIoU detects more objects and enhances the detection
of occluded objects such as humans in the same im-
age. More results of different structures with different
backbones are given in Appendix A.
6 CONCLUSION AND FUTURE
DIRECTIONS
The paper discusses the use of object detection in ru-
ral and suburban areas. It summarizes the existing
efforts to detect objects efficiently and describes the
datasets and state-of-the-art anchor-free models used
in this field. Furthermore, new anchor-free model
structures are investigated based on different types
of regression losses. Training over the benchmark
COCO dataset with both FSAF and FCOS ResNet-50
models based on CIOU and a spatial attention mech-
anism shows an improvement of the accuracy by 1.3
% and 1.6 % mAP, respectively. The object detection
results with different structures have been interpreted
using a saliency map, which shows the area at which
each model is focused to discover and detect the nec-
essary object. On the other hand, the modified struc-
tures have been investigated using a specific dataset
from construction fields (OPEDD). The results show
that structure based on spatial attention and CIoU loss
for both FSAF and FCOS models increase the accu-
racy by 2.3% and 16.1% mAP respectively.
Moreover, in a comparison between such ap-
proaches and the State-Of-the-Art (SOTA) YOLO
object detection versions, the results show that the
ICAART 2024 - 16th International Conference on Agents and Artificial Intelligence
406
(a) FCOS ResNeXt-101 saliency maps
(b) FSAF ResNet-50 saliency maps
Figure 7: The saliency maps for different models that are tested in this research.
Figure 8: Object detection results for different structures of
FCOS ResNeXt-101 model trained on COCO dataset.
anchor-free models with such a modification give
FLOPs values less or slightly higher than YOLO
models. For example, the literature mentions that
the YOLOv5x (Jocher, 2020) has a FLOPs value of
205.7, and the one for YOLOv8x (Hussain, 2023) is
257.8, while the FLOPs for both the FSAF and the
FCOS model based on ResNet-50 mentioned in Table
2 are 207.48 and 201.75; respectively. Even though
those models have inherited an attention mechanism
in their structure. More detailed results for differ-
ent backbone structures in both the FSAF and FCOS
models are mentioned in Appendix A and B. Those
results prove that using either CIoU and DIoU losses
with attention gives more accurate results compared
to the theoretical baseline structure with IoU loss.
For future work, more anchor-free detectors can
be investigated for the different types of loss functions
and different types of attention mechanisms such as
the convolutional block attention module (CBAM)
(Woo et al., 2018) which could enhance their perfor-
mance and accuracy with less change in complexity.
From the authors’ point of view, anchor-free models
are still a springboard for future research. They can
be developed in a semi-supervised approach as well.
Models that contain FPN in their structure are more
compatible with the future direction toward biologi-
cal plausibility (Helmstaedter, 2015).
ACKNOWLEDGEMENTS
This research was supported by German Academic
Exchange Service (DAAD).
Investigation of the Performance of Different Loss Function Types Within Deep Neural Anchor-Free Object Detectors
407

Table 3: Performance of different structures of dense object detectors: FSAF and FCOS models based on ResNet50 backbone
trained directly on the OPEDD dataset. The highest values are mentioned in bold.
Model Backbone Attention Reg loss Bbox-mAP Bbox-mAP-50 Bbox-mAP-75 Bbox-mAP-s Bbox-mAP-m Bbox-mAP-l
Anchor-Free Detectors: Dense Predictors
FSAF ResNet-50
Baseline IoU 22.7 36.1 24.8 5.5 36.5 30.0
ε3(our) IoU 24.8 39.0 26.4 8.0 40.8 31.1
ε3(our) CIoU 25.0 38.4 26.6 8.3 42.4 31.6
ε3(our) DIoU 24.7 38.5 27.5 7.0 41.8 31.2
ε3(our) GIoU 24.4 39.0 26.8 6.3 41.7 31.1
FCOS ResNet-50
Baseline IoU 13.6 28.8 11.2 1.1 12.5 22.6
ε3(our) IoU 24.5 50.1 23.8 1.3 23.9 44.6
ε3(our) CIoU 29.7 54.8 30.7 4.0 24.4 58.2
ε3(our) DIoU 28.9 54.3 29.9 3.8 23.9 56.9
ε3(our) GIoU 27.6 51.2 27.0 1.7 22.8 56.3
Table 4: Performance of different structures of dense object detectors: FSAF and FCOS models based on ResNet50 backbone
pre-trained on COCO dataset, then transfer learning using the OPEDD dataset. The highest values are mentioned in bold.
Model Backbone attention Reg loss Bbox-mAP Bbox-mAP-50 Bbox-mAP-75 Bbox-mAP-s Bbox-mAP-m Bbox-mAP-l
Anchor-Free Detectors: Dense Predictors
FSAF ResNet-50
N IoU 24.1 35.9 26.8 6.7 41.1 31.6
ε3(our) IoU 24.5 38.2 25.5 7.6 39.5 32.0
ε3(our) CIoU 24.1 37.4 26.5 9.2 40.7 30.5
ε3(our) DIoU 23.4 35.7 24.7 6.1 42.0 29.0
ε3(our) GIoU 24.5 37.3 26.8 7.9 38.4 31.8
FCOS ResNet-50
N IoU 24.9 37.0 25.9 3.4 38.2 34.1
ε3(our) IoU 23.7 36.3 25.8 3.1 35.7 32.5
ε3(our) CIoU 24.8 37.8 26.8 3.9 37.3 34.2
ε3(our) DIoU 25.4 39.2 27.1 4.7 38.1 34.9
ε3(our) GIoU 25.6 39.2 26.9 4.7 39.9 34.6
Table 5: Performance of different structures of dense object detectors: FSAF and FCOS models based on ResNet50 backbone
trained on the benchmark COCO dataset. The highest values are mentioned in bold.
Model Backbone Attention Reg loss Bbox-mAP Bbox-mAP-50 Bbox-mAP-75 Bbox-mAP-s Bbox-mAP-m Bbox-mAP-l
Anchor-Free Detectors: Dense Predictors
FSAF ResNet-50
N IoU 36.0 55.5 37.7 19.6 39.6 48.2
ε3(our) IoU 36.3 55.4 38.6 20.1 39.4 47.7
ε3(our) CIoU 37.3 56.8 39.2 21.1 40.0 49.0
ε3(our) DIoU 37.3 56.9 39.2 21.2 40.1 48.6
ε3(our) GIoU 37.2 56.4 39.6 21.0 40.0 49.0
FCOS ResNet-50
N IoU 36.6 56.0 38.8 21.1 40.7 47.1
ε3(our) IoU 37.4 56.3 40.0 21.6 41.1 49.0
ε3(our) CIoU 38.2 57.1 40.6 21.5 42.1 50.0
ε3(our) DIoU 37.8 56.8 40.2 22.0 41.7 49.4
ε3(our) GIoU 38.1 56.9 40.5 22.3 41.9 49.7
REFERENCES
Chen, K., Wang, J., Pang, J., Cao, Y., Xiong, Y., Li, X., Sun,
S., Feng, W., Liu, Z., Xu, J., et al. (2019). Mmdetec-
tion: Open mmlab detection toolbox and benchmark.
arXiv preprint arXiv:1906.07155.
Doll
´
ar, P., Wojek, C., Schiele, B., and Perona, P. (2009).
Pedestrian detection: A benchmark. In 2009 IEEE
Conference on Computer Vision and Pattern Recogni-
tion, pages 304–311. IEEE.
Geiger, A., Lenz, P., and Urtasun, R. (2012). Are we ready
for autonomous driving? the kitti vision benchmark
suite. In 2012 IEEE conference on computer vision
and pattern recognition, pages 3354–3361. IEEE.
Guo, M.-H., Xu, T.-X., Liu, J.-J., Liu, Z.-N., Jiang, P.-T.,
Mu, T.-J., Zhang, S.-H., Martin, R. R., Cheng, M.-M.,
and Hu, S.-M. (2022). Attention mechanisms in com-
puter vision: A survey. Computational Visual Media,
pages 1–38.
He, K., Zhang, X., Ren, S., and Sun, J. (2016). Deep resid-
ual learning for image recognition. In Proceedings of
the IEEE conference on computer vision and pattern
recognition, pages 770–778.
Helmstaedter, M. (2015). The mutual inspirations of ma-
chine learning and neuroscience. Neuron, 86(1):25–
28.
Hussain, M. (2023). Yolo-v1 to yolo-v8, the rise of yolo
and its complementary nature toward digital manu-
facturing and industrial defect detection. Machines,
11(7):677.
Jiang, P., Osteen, P., Wigness, M., and Saripalli, S. (2021).
Rellis-3d dataset: Data, benchmarks and analysis. In
2021 IEEE International Conference on Robotics and
Automation (ICRA), pages 1110–1116. IEEE.
Jocher, G. (2020). Yolov5 by ultralytics.
ICAART 2024 - 16th International Conference on Agents and Artificial Intelligence
408

Kong, T., Sun, F., Liu, H., Jiang, Y., Li, L., and Shi,
J. (2020). Foveabox: Beyound anchor-based object
detection. IEEE Transactions on Image Processing,
29:7389–7398.
Kragh, M. F., Christiansen, P., Laursen, M. S., Larsen, M.,
Steen, K. A., Green, O., Karstoft, H., and Jørgensen,
R. N. (2017). Fieldsafe: dataset for obstacle detection
in agriculture. Sensors, 17(11):2579.
Lin, T.-Y., Doll
´
ar, P., Girshick, R., He, K., Hariharan, B.,
and Belongie, S. (2017a). Feature pyramid networks
for object detection. In Proceedings of the IEEE con-
ference on computer vision and pattern recognition,
pages 2117–2125.
Lin, T.-Y., Goyal, P., Girshick, R., He, K., and Doll
´
ar, P.
(2017b). Focal loss for dense object detection. In
Proceedings of the IEEE international conference on
computer vision, pages 2980–2988.
Lin, T.-Y., Maire, M., Belongie, S., Hays, J., Perona, P.,
Ramanan, D., Doll
´
ar, P., and Zitnick, C. L. (2014).
Microsoft coco: Common objects in context. In Euro-
pean conference on computer vision, pages 740–755.
Springer.
Liu, S., Zhou, H., Li, C., and Wang, S. (2020). Analy-
sis of anchor-based and anchor-free object detection
methods based on deep learning. In 2020 IEEE Inter-
national Conference on Mechatronics and Automation
(ICMA), pages 1058–1065. IEEE.
Maddern, W., Pascoe, G., Linegar, C., and Newman, P.
(2017). 1 year, 1000 km: The oxford robotcar
dataset. The International Journal of Robotics Re-
search, 36(1):3–15.
Neigel, P., Ameli, M., Katrolia, J., Feld, H., Wasenm
¨
uller,
O., and Stricker, D. (2020). Opedd: Off-road pedes-
trian detection dataset.
Neigel, P., Rambach, J. R., and Stricker, D. (2021). Offsed:
Off-road semantic segmentation dataset. In VISI-
GRAPP (4: VISAPP), pages 552–557.
Petsiuk, V., Jain, R., Manjunatha, V., Morariu, V. I., Mehra,
A., Ordonez, V., and Saenko, K. (2021). Black-box
explanation of object detectors via saliency maps. In
Proceedings of the IEEE/CVF Conference on Com-
puter Vision and Pattern Recognition, pages 11443–
11452.
Rezatofighi, H., Tsoi, N., Gwak, J., Sadeghian, A., Reid, I.,
and Savarese, S. (2019). Generalized intersection over
union: A metric and a loss for bounding box regres-
sion. In Proceedings of the IEEE/CVF Conference on
Computer Vision and Pattern Recognition, pages 658–
666.
Tian, Z., Shen, C., Chen, H., and He, T. (2019). Fcos:
Fully convolutional one-stage object detection. In
Proceedings of the IEEE/CVF international confer-
ence on computer vision, pages 9627–9636.
Tong, K., Wu, Y., and Zhou, F. (2020). Recent advances
in small object detection based on deep learning: A
review. Image and Vision Computing, 97:103910.
Woo, S., Park, J., Lee, J.-Y., and Kweon, I. S. (2018). Cbam:
Convolutional block attention module. In Proceed-
ings of the European conference on computer vision
(ECCV), pages 3–19.
Xiang, Y., Wang, H., Su, T., Li, R., Brach, C., Mao, S. S.,
and Geimer, M. (2020). Kit moma: A mobile ma-
chines dataset. arXiv preprint arXiv:2007.04198.
Xie, S., Girshick, R., Doll
´
ar, P., Tu, Z., and He, K. (2017).
Aggregated residual transformations for deep neural
networks. In Proceedings of the IEEE conference on
computer vision and pattern recognition, pages 1492–
1500.
Yu, J., Jiang, Y., Wang, Z., Cao, Z., and Huang, T. (2016).
Unitbox: An advanced object detection network. In
Proceedings of the 24th ACM international confer-
ence on Multimedia, pages 516–520.
Zheng, Z., Wang, P., Liu, W., Li, J., Ye, R., and Ren, D.
(2020). Distance-iou loss: Faster and better learn-
ing for bounding box regression. In Proceedings of
the AAAI Conference on Artificial Intelligence, vol-
ume 34, pages 12993–13000.
Zhu, C., He, Y., and Savvides, M. (2019a). Feature selec-
tive anchor-free module for single-shot object detec-
tion. In Proceedings of the IEEE/CVF Conference on
Computer Vision and Pattern Recognition, pages 840–
849.
Zhu, X., Cheng, D., Zhang, Z., Lin, S., and Dai, J. (2019b).
An empirical study of spatial attention mechanisms
in deep networks. In Proceedings of the IEEE/CVF
International Conference on Computer Vision, pages
6688–6697.
APPENDIX
Further results from training the anchor-free dense
model over the OPEDD dataset and the COCO bench-
mark dataset are presented in this Appendix. These
results show more information about using different
IoU loss functions without the plugin spatial attention
as well as with the integration of such an attention
mechanism.
Appendix A
Results of training different backbones of FSAF and
FCOS models over the COCO dataset are mentioned.
Table 6 shows the results of the training FSAF model
with different IoU loss without an attention mecha-
nism in part (a) as well as with an attention mecha-
nism in part (b). Table 7 shows the same but for the
FCOS model.
Appendix B
FSAF and FCOS models based on different back-
bones are investigated with and without spatial atten-
tion mechanism. Those models are trained over a spe-
cific OPEDD dataset. Table 8 and Table 9 show de-
tailed results, which express that using another regres-
sion loss rather than IoU improves the accuracy of the
models.
Investigation of the Performance of Different Loss Function Types Within Deep Neural Anchor-Free Object Detectors
409

Table 6: Ablation studies for the FSAF model trained on COCO dataset using different structures of backbones, loss types
and attention.
(a) FSAF model structure with different loss types without using an attention mechanism.
Model Backbone loss
bbox-
mAP
bbox-
mAP-50
bbox-
mAP-75
bbox-
mAP-s
bbox-
mAP-m
bbox-
mAP-l
FSAF ResNet-50
IoU [lit] 36.0 55.5 37.7 19.6 39.6 48.2
CIoU 36.8 55.7 38.9 19.8 39.7 48.0
DIoU 35.3 54.1 37.4 19.2 37.9 46.0
GIoU 35.2 54.0 37.3 18.9 37.8 45.9
FSAF ResNet-101
IoU [lit] 39.3 58.6 42.1 22.1 43.4 51.2
CIoU 38.5 57.7 41.0 20.6 41.7 50.2
DIoU 38.7 57.9 41.0 20.9 42.2 51.2
GIoU 38.6 57.6 41.1 21.6 42.4 50.7
FSAF ResNeXt-101
IoU [lit] 42.4 62.5 45.5 24.6 46.1 55.5
CIoU 41.3 60.9 44.1 23.3 45.0 54.2
DIoU 41.4 61.1 44.6 23.5 45.1 54.7
GIoU 41.2 60.8 44.2 23.0 45.1 53.6
(b) FSAF model structure with different loss types and using an attention mechanism.
Model Backbone att Loss
bbox-
mAP
bbox-
mAP-50
bbox-
mAP-75
bbox-
mAP-s
bbox-
mAP-m
bbox-
mAP-l
FSAF ResNet-50 ε3
IoU 36.3 55.4 38.6 20.1 39.4 47.7
CIoU 37.3 56.8 39.2 21.1 40.0 49.0
DIoU 37.3 56.9 39.2 21.2 40.1 48.6
GIoU 37.2 56.4 39.6 21.0 40.0 49.0
FSAF ResNet-101 ε3
IoU 37.8 57.0 40.2 21.3 41.5 49.3
CIoU 40.0 59.9 42.7 22.4 43.8 52.0
DIoU 40.1 59.7 42.7 22.5 44.0 52.3
GIoU 39.8 59.3 42.3 22.5 43.3 52.4
FSAF ResNeXt-101 ε3
IoU 42.4 62.8 45.3 24.5 46.4 55.5
CIoU 40.2 59.9 42.8 22.9 43.7 52.3
DIoU 43.0 63.5 46.1 25.5 46.9 56.6
GIoU 42.5 62.7 45.6 24.5 46.3 56.1
Table 7: Ablation studies on FCOS model trained on COCO dataset using different structures of backbones, loss types and
attention.
(a) FCOS model structure with different loss types without using an attention mechanism.
Model Backbone loss
bbox-
mAP
bbox-
mAP-50
bbox-
mAP-75
bbox-
mAP-s
bbox-
mAP-m
bbox-
mAP-l
FCOS ResNet-50
IoU [lit] 36.6 56.0 38.8 21.1 40.7 47.1
CIoU 36.7 55.3 39.0 20.0 40.7 47.3
DIoU 37.0 55.6 39.5 21.0 40.6 47.9
GIoU 37.0 55.5 39.4 21.1 40.9 47.5
FCOS ResNet-101
IoU [lit] 39.1 58.3 42.1 22.7 43.3 50.3
CIoU 38.8 57.53 41.3 22.42 42.86 50.23
DIoU 39.08 58.04 41.77 22.31 43.07 50.46
GIoU 39.22 58.16 42.02 22.79 43.47 50.06
FCOS ResNeXt-101
IoU [lit] 42.6 62.3 45.6 25.7 46.3 54.6
CIoU 42.87 62.35 46.16 26.89 46.70 54.66
DIoU 43.04 62.28 46.22 26.85 46.59 55.02
GIoU 42.85 62.19 46.48 26.94 46.60 53.94
(b) FCOS model structure with different loss types and using an attention mechanism.
Model Backbone att Loss
bbox-
mAP
bbox-
mAP-50
bbox-
mAP-75
bbox-
mAP-s
bbox-
mAP-m
bbox-
mAP-l
FCOS ResNet-50 ε3
IoU 37.4 56.3 40.0 21.6 41.1 49.0
CIoU 38.2 57.1 40.6 21.5 42.1 50.0
DIoU 37.8 56.8 40.2 22.0 41.7 49.4
GIoU 38.1 56.9 40.5 22.3 41.9 49.7
FCOS ResNet-101 ε3
IoU 39.50 58.30 42.46 22.58 43.40 51.90
CIoU 39.87 58.97 42.57 23.23 43.99 51.84
DIoU 40.07 59.14 43.12 23.18 43.89 51.77
GIoU 39.91 59.03 42.50 23.13 43.89 51.95
FCOS ResNeXt-101 ε3
IoU 43.4 63.2 46.6 26.8 47.4 55.2
CIoU 43.8 63.3 47.2 27.5 47.8 56.0
DIoU 43.3 62.8 46.6 26.9 47.0 55.1
GIoU 43.7 63.0 47.0 26.6 47.7 56.5
ICAART 2024 - 16th International Conference on Agents and Artificial Intelligence
410

Table 8: The results of training the FSAF model on the OPEDD dataset, pretrained on the COCO dataset with different
structures of backbones, loss types and attention.
(a) FSAF model structure with different loss types without using an attention mechanism.
Model Backbone loss
bbox-
mAP
bbox-
mAP-50
bbox-
mAP-75
bbox-
mAP-s
bbox-
mAP-m
bbox-
mAP-l
FSAF ResNet-50
IoU [lit] 24.1 35.9 26.8 6.7 41.1 31.6
CIoU 24.6 38.0 26.7 8.4 43.7 30.1
DIoU 24.7 40.1 26.5 6.0 38.5 31.8
GIoU 25.1 39.2 28.0 7.5 41.1 31.9
FSAF ResNet-101
IoU [lit] 24.6 37.3 28.0 6.8 38.2 32.2
CIoU 25.4 37.6 28.0 5.7 41.6 33.7
DIoU 25.3 38.0 28.7 5.2 40.6 33.2
GIoU 25.1 37.2 27.4 5.3 40.4 33.5
FSAF ResNeXt-101
IoU [lit] 26.3 40.1 28.9 8.0 41.1 34.4
CIoU 27.5 40.1 30.0 9.6 41.8 36.0
DIoU 26.9 39.5 30.0 6.9 43.4 34.3
GIoU 26.6 39.4 29.7 6.4 45.9 33.9
(b) FSAF model structure with different loss types and using an attention mechanism.
Model Backbone att Loss
bbox-
mAP
bbox-
mAP-50
bbox-
mAP-75
bbox-
mAP-s
bbox-
mAP-m
bbox-
mAP-l
FSAF ResNet-50 ε3
IoU 24.5 38.2 25.5 7.6 39.5 32.0
CIoU 24.1 37.4 26.5 9.2 40.7 30.5
DIoU 23.4 35.7 24.7 6.1 42.0 29.0
GIoU 24.5 37.3 26.8 7.9 38.4 31.8
FSAF ResNet-101 ε3
IoU 24.6 38.7 25.8 5.1 40.1 32.8
CIoU 24.0 36.7 25.3 5.6 39.8 31.8
DIoU 24.8 36.9 26.8 4.7 37.4 33.4
GIoU 24.5 38.5 25.7 7.5 39.6 31.8
FSAF ResNeXt-101 ε3
IoU 26.7 41.0 29.2 8.1 41.6 34.3
CIoU 26.8 41.4 29.4 7.1 41.4 34.4
DIoU 26.3 40.0 30.2 8.2 44.7 33.6
GIoU 26.9 40.2 30.3 8.4 41.4 34.9
Table 9: The results of training the FCOS model on the OPEDD dataset, pre-trained on coco dataset with different structures
of backbones, loss types and attention.
(a) FCOS model structure with different loss types without using an attention mechanism.
Model Backbone loss
bbox-
mAP
bbox-
mAP-50
bbox-
mAP-75
bbox-
mAP-s
bbox-
mAP-m
bbox-
mAP-l
FCOS ResNet-50
IoU [lit] 24.9 37.0 25.9 3.4 38.2 34.1
CIoU 25.4 39.6 25.8 4.8 37.7 33.9
DIoU 25.4 37.9 28.1 4.1 39.3 35.1
GIoU 25.8 38.3 26.9 4.3 39.7 35.5
FCOS ResNet-101
IoU [lit] 23.0 36.5 24.9 5.1 36.7 30.7
CIoU 23.6 37.2 25.0 5.2 37.8 32.0
DIoU 23.9 38.3 23.6 3.4 36.4 32.1
GIoU 25.1 37.1 27.2 3.2 40.8 33.6
FCOS ResNeXt-101
IoU [lit] 24.0 37.1 25.2 6.4 37.8 31.3
CIoU 25.1 37.1 28.1 6.0 40.1 32.7
DIoU 26.5 38.7 28.4 5.4 39.6 35.1
GIoU 25.1 38.1 26.2 6.4 38.9 32.1
(b) FCOS model structure with different loss types and using an attention mechanism.
Model Backbone att Loss
bbox-
mAP
bbox-
mAP-50
bbox-
mAP-75
bbox-
mAP-s
bbox-
mAP-m
bbox-
mAP-l
FCOS ResNet-50 ε3
IoU 23.7 36.3 25.8 3.1 35.7 32.5
CIoU 24.8 37.8 26.8 3.9 37.3 34.2
DIoU 25.4 39.2 27.1 4.7 38.1 34.9
GIoU 25.6 39.2 26.9 4.7 39.9 34.6
FCOS ResNet-101 ε3
IoU 23.4 35.6 25.2 4.9 37.3 31.5
CIoU 24.4 38.7 24.8 3.9 36.8 33.6
DIoU 23.8 37.9 24.2 4.5 37.6 31.9
GIoU 23.5 36.1 25.8 4.5 37.1 32.6
FCOS ResNeXt-101 ε3
IoU 26.1 38.7 28.5 4.2 42.3 34.3
CIoU 25.0 37.8 26.1 6.0 38.2 33.1
DIoU 25.5 37.5 26.5 4.1 38.6 34.4
GIoU 26.0 37.5 27.3 5.3 42.9 33.8
Investigation of the Performance of Different Loss Function Types Within Deep Neural Anchor-Free Object Detectors
411
