
Real-Time Heart Rate Visualization for Individuals with Autism
Spectrum Disorder: An Evaluation of Technology Assisted Physical
Activity Application to Increase Exercise Intensity
Bo Fu
1a
, Katrina Orevillo
1
, Dennis Lo
1
, Andrew Bae
1
and Melissa Bittner
2
1
Computer Engineering and Computer Science, California State University, Long Beach, U.S.A.
2
Department of Kinesiology, California State University, Long Beach, U.S.A.
Keywords: Real-Time Heart Rate Visualization, Eye Tracking, Autism Spectrum Disorder, Technology Assisted Exercise.
Abstract: Individuals with autism spectrum disorder (ASD) often experience negative relationships with physical
activity and a severe lack of motivation for exercise. While specialized exercise technologies such as internet-
enabled machines and mobile applications have provided some solutions for typically developing individuals,
there is a lack of research in providing exercise technology that specifically considers the needs of individuals
with ASD. This paper presents a real-time heart-rate visualization application, namely the HeartRunner 2.0
App, which aims to engage individuals with ASD to exercise at higher intensity. When used to supplement
exercise sessions, amongst a group of 20 participants with ASD, evaluation results showed that the App helped
83% of participants achieve higher heart rates, 66.6% to maintain heart rates at or above 90 BPM, and 27.7%
to re-engage and achieve heart rates at or above 90 BPM after dropping below that threshold. Furthermore,
eye tracking analyses indicate that those individuals who achieved higher heart rates have employed a more
focused gaze patterns with less distributed fixations in their visual searches, as well as greater efforts in
scanning various cues in the given visual scene, suggesting that visual interaction with the App may have
contributed to elevated performance in the experiment.
1 INTRODUCTION
Gaining popularity during the 2000s, the intertwining
developments of exercise and technology have given
rise to a joint field of digital fitness – with
technological advancements emerging to motivate
physical activity for its users (Parrott et al., 2020).
Users of fitness-oriented technical machines and
applications have often found these devices to be
useful tools for encouragement and prolonging of
physical activity, resulting in overall improvements in
personal health and quality of life. Shortcomings of
these tools, however, become prevalent when applied
to certain communities, such as those diagnosed with
autism spectrum disorder (ASD). Studies focusing on
ASD prevalence in the United States concluded that
1 in 54 children living in the U.S. were diagnosed
with ASD as of 2016 (Matthew et al., 2020) –
exhibiting characteristics including “deficits in social
communication and interaction”, “restrictive
a
http://orcid.org/0000-0001-9874-9551
interests”, and “repetitive behaviors” (Shaw et al.,
2023). Because individuals with ASD exhibit such
characteristics, alternative approaches toward
encouraging physical activity, including technology-
based applications and machinery, must be
considered. Individuals with ASD often experience
negative relationships with exercise due to a myriad
of factors, which can include lacking social skills,
deficits in gross motor skills, and underdeveloped
coordination leading to low motivation when
engaging in physical activities. ASD populations, as
a result, are severely more likely to experience
sedentary lifestyles, often leading to obesity and other
health conditions (Dieringer et al., 2017).
This paper aims to investigate the application of
technology-assisted exercise in supporting
individuals with ASD during physical activity. More
specifically, a tablet application is developed and
evaluated to determine whether visualizing heart rates
in real time during physical activity would be
beneficial in encouraging higher intensity of physical
Fu, B., Orevillo, K., Lo, D., Bae, A. and Bittner, M.
Real-Time Heart Rate Visualization for Individuals with Autism Spectrum Disorder: An Evaluation of Technology Assisted Physical Activity Application to Increase Exercise Intensity.
DOI: 10.5220/0012354500003660
Paper published under CC license (CC BY-NC-ND 4.0)
In Proceedings of the 19th International Joint Conference on Computer Vision, Imaging and Computer Graphics Theory and Applications (VISIGRAPP 2024) - Volume 1: GRAPP, HUCAPP
and IVAPP, pages 455-463
ISBN: 978-989-758-679-8; ISSN: 2184-4321
Proceedings Copyright © 2024 by SCITEPRESS – Science and Technology Publications, Lda.
455

activity for individuals with ASD. A preliminary
research (Fu et al., 2020) has found that real-time
visualizations of heart rates were helpful in engaging
ASD individuals in physical activity. However, a
multi-user mode to simulate a social environment for
multiple users in one exercise session did not provide
positive encouragement, as most individuals with
ASD found it to be too competitive and some gave up
on the exercise as a result. As such, the application
presented in this paper proposes a single-user mode,
in addition to utilizing music and differing
visualization techniques - compared to those
demonstrated in (Fu et al., 2020) - that aim to
overcome the aforementioned issues discovered in
(Fu et al., 2020).
2 THE HeartRunner 2.0 APP
The HeartRunner 2.0 App is built for compatibility
with Apple iPadOS devices using the Swift
programming language in Xcode, employing the
Model-View-Controller architectural pattern to
implement the user interface derived from
FlappySwift (Murray, N., 2019). Additionally, the
application makes use of the Scosche Rhythm24
Software Development Kit (SDK)
1
to allow heart rate
data retrieval from the Scosche Rhythm24 Bluetooth
heart rate monitors
2
.
Prior to beginning a physical activity, a user
would open the HeartRunner 2.0 App on their iPad
device to take a photo of themselves (using the built-
in camera on the tablet) as their profile picture in the
App. Wearing a Scosche heart rate monitor, the user
can then begin an exercise session after setting a
targeted duration (i.e., a desired exercise duration in
minutes). During the exercise, the App would show
their profile picture as a main character flying
forward a path, and their heart rates measured in beats
per minute (BPM) would be visualised in real time as
the readings from the Scosche heart rate monitor
elevate or drop. The exercise session ends once the
target exercise duration is completed, and the user
will be shown the highest heart rate achieved during
that session.
Figure 1 shows a screenshot of the HeartRunner
2.0 App interface during exercise sessions that
consists multiple elements that respond to real-time
heart rate readings, including:
1. Heart Rate Label: Displays the user’s heart rate
reading in BPM in real time;
1
https://www.scosche.com/rhythm-sdk, last accessed Oct
2023.
2. Profile Picture: At different ranges of heart
rates (as depicted in Table 1), the profile picture
taken by the user at the beginning of the user
flow is placed at different horizontal locations
on the screen – toward the left side
(“beginning”) of the screen for lower heart rate
readings, and toward the right side (“end”) for
higher heart rate readings;
3. Sky Color and Platform Speed: At different
ranges of heart rates (shown in Table 1), the
color of the sky in the background of the
platform would be modified to provide further
indication of the changes in heart rates for that
user. Additionally, the speed at which the
platform moves in the horizontal direction is
adjusted with heart rate readings at lower
ranges moving at a slower pace than readings
at higher ranges;
4. Background Music (not pictured in Figure 1):
Upon reaching a heart rate of 90 BPM, the App
would play music using the audio player on the
tablet device. The song “Happy Rock”
(Bensound, 2022) would be played as the
exercise continues, which has the distributor
labels of having very high/high energy levels
and happy/energizing mood. 90 BPM was
chosen as the threshold to initiate music play
based on the recommended maximum heart
rate determined by age, whereby for those 16
years old and over: Maximum Heart Rate = 220
− Current Age (Centers for Disease Control and
Prevention, 2022; Riebe et al., 2018; Physical
Activity Guidelines Advisory Committee,
2008), and all participants who took part in the
evaluation of the App being in the 18-21 year
old age group;
5. Countdown Timer: Displays the remaining
time in the exercise session (in minutes). The
timer incorporates a circular display with a
yellow circle that progressively empties,
resembling a pie chart, as each second elapses.
At the completion of each minute, the circle
returns to its original yellow state and continues
the countdown cycle.
2
https://www.scosche.com/rhythm24-waterproof-armband-
heart-rate-monitor, last accessed Oct 2023.
HUCAPP 2024 - 8th International Conference on Human Computer Interaction Theory and Applications
456
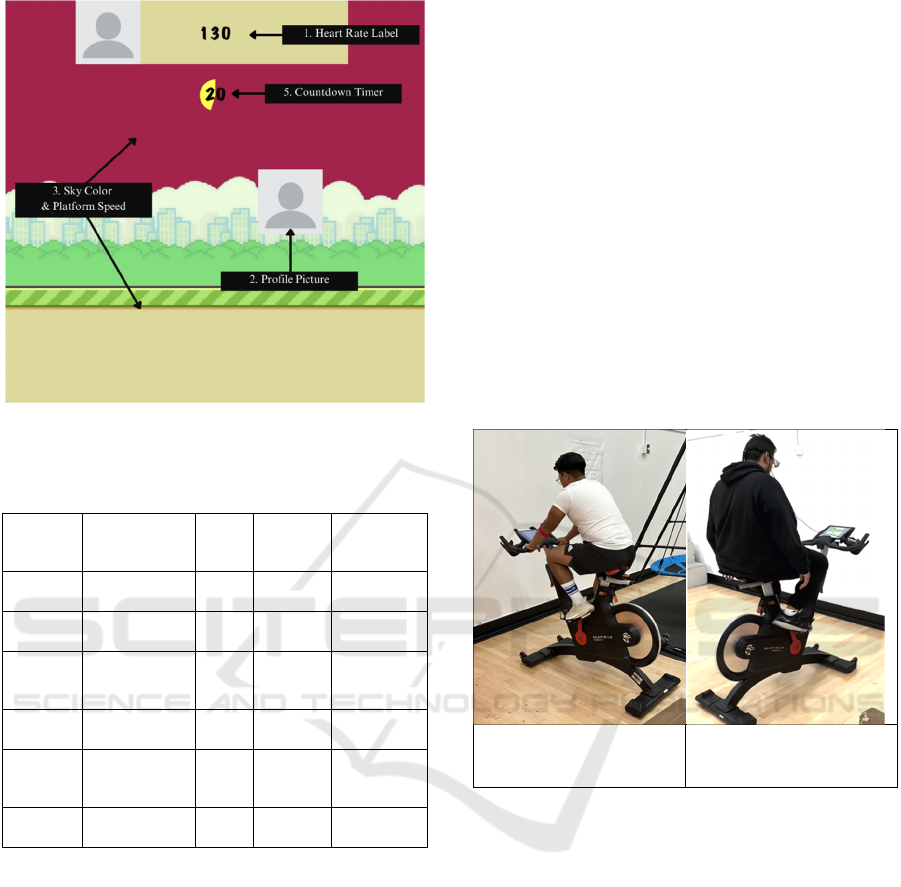
Figure 1: The HeartRunner 2.0 App user interface with
elements that respond to real-time heart rate readings.
Table 1: The HeartRunner 2.0 App Visualization Features.
Heart
Rate
(BPM)
Profile Picture
Position
Sky
Color
Platform
Speed
Background
Music
Less than
80
Left-most fifth
of screen
Grey 1 Off
Between
80 & 90
Left-most fifth
of screen
Grey 1.25 Off
Between
90 & 100
Second left-
most fifth of
screen
Blue 1.5 On
Between
100 & 110
Center fifth of
screen
Green 2 On
Between
110 & 120
Second right-
most fifth of
screen
Orange 3 On
More than
120
Right-most fifth
of screen
Red 4 On
3 EVALUATION
A series of experiments were conducted over a 3-
month period involving 20 individuals with ASD. All
participants were verbal, able to read and understood
the instructions given in the experiments.
Participants were asked to complete a stationary
bicycle exercise session. Each participant took part in
the study on two separate days, completing a control
exercise session (i.e., without the support of the
HeartRunner 2.0 App) on one day and an
experimental exercise session (i.e., with the support
of the HeartRunner 2.0 App) on the other. The order
in which individual participants experienced each
session type was chosen randomly and
counterbalanced overall to minimize order effect.
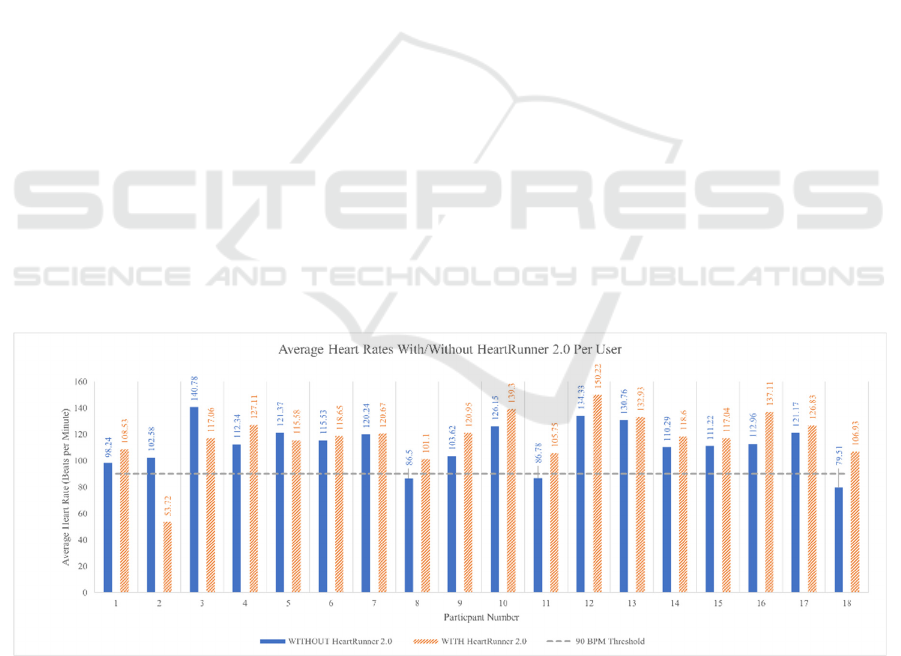
Individual participants were asked to ride a Matrix
IC7 Indoor Stationary Bicycle, as shown in Figure 2.
Prior to the session, the seat and handlebar heights of
the stationary bicycle were adjusted according to the
participants’ height and comfort. These settings were
recorded so that participants would maintain the same
seat and handlebar heights for both sessions. Each
participant was also assisted to wear one Scosche
Rhythm24 Heart Rate Monitor on the upper forearm
(just below the elbow). Following the physical
configurations, each participant was given an iPad
with the HeartRunner 2.0 App installed. Participants
were assisted when completing the initial steps of the
application’s user flow, including taking a profile
picture and ensuring Bluetooth connection to the
heart rate monitor.
a. A participant in a
control exercise session
b. A participant in an
experimental exercise
s
ession
Figure 2: Physical setup of the two experimental conditions.
Individuals participating in the control exercise
session used a “Blank” version of the HeartRunner
2.0 App (as shown in Figure 2a), where a white screen
appeared for the duration of the session instead of the
actual HeartRunner 2.0 App interface. Participants in
this group were instructed to complete a 20-minute
exercise session on the stationary bike while using the
“Blank” version of the application. Following the
session, the heart rate monitor was removed from the
participants’ forearms, and the heart rate data was
extracted from iPad storage for analysis. Individuals
participating in the experimental exercise session
were also instructed to complete a 20-minute exercise
session on the stationary bike while using the
HeartRunner 2.0 App (as shown in Figure 2b), where
they would be able to see how various interface
components reacted according to their heart rate
changes. In addition to wearing the Rhythm24 Heart
Real-Time Heart Rate Visualization for Individuals with Autism Spectrum Disorder: An Evaluation of Technology Assisted Physical
Activity Application to Increase Exercise Intensity
457
Rate Monitor, participants in the experimental
exercise session also wore the Tobii Glasses Eye
Tracker (with controller model version 0.16194 and a
50Hz sample rate), which tracked and recorded
participants’ eye movements during an entire exercise
session. Following the session, the heart rate monitor
was removed from the participants’ forearms, and the
heart rate data was extracted from iPad storage for
analysis.
4 RESULTS
Out of the 20 participants who took part in the
experiment, we discarded corrupted data from 2
individuals (due to sensor failure and other technical
issues resulting in null data). In total, data from 18
participants, or 36 individual exercise sessions
(including 18 control exercise sessions and 18
experimental exercise sessions) were analyzed and
reported in this paper.
When comparing the heart rate readings for
participants between the experimental and control
exercise sessions, as shown in Figure 3, 15 out of 18
participants (83.3%) experienced higher average
heart rate readings when supported by HeartRunner
2.0. On average, these 15 participants exhibited an
increased heart rate of approximately 12.152 BPM.
Additionally, the heart rates of participants after
hearing the music for the first time were analyzed as
a measure of sustained physical activity. 12 out of 18
participants (66.6%) continued to exhibit heart rates
above 90 BPM for the duration of their exercise
sessions after music was played for the first time. Of
the remaining 6 participants, none moved below 90
BPM for the entirety of the remaining session time. 5
participants (27.7% of participants) had readings
which dropped below 90 BPM for short intervals
before increasing past the 90 BPM mark again – with
some only moving below 90 BPM once in the time
after first reaching that mark. After the initial music
start, these 5 individuals stayed mostly above 90 BPM
– hearing music for most of their exercise session.
The remaining 1 individual also experienced
fluctuation around the 90 BPM mark, though staying
mostly below 90 BPM and without music. The
aggregated group averages are shown in Figure 4.
These findings may indicate that the heart rate
visualization features of the HeartRunner 2.0 App
served as motivating factors for individuals with
ASD, encouraging participants to participate in their
exercise sessions at higher intensities as shown
through increased heart rate readings during
experimental exercise sessions. It may also be
suggested that, with no participants reaching heart
rate readings of 90 BPM dropping below that
threshold for the entire remaining session time,
participants interpreted changes in the visualization
elements as success signals. In response, participants
may have strived to reach “success” after elements
reverted to their original states, with 5 participants
rising above 90 BPM after the application stopped
playing music – indicating that such elements could
contribute to the sustainment of physical activity.
Figure 3: Average heart rate readings for individual participants with ASD during exercise sessions without the HeartRunner
2.0 App (denoted in solid blue, on the left) and with the HeartRunner 2.0 App (denoted in shaded orange, on the right).
HUCAPP 2024 - 8th International Conference on Human Computer Interaction Theory and Applications
458
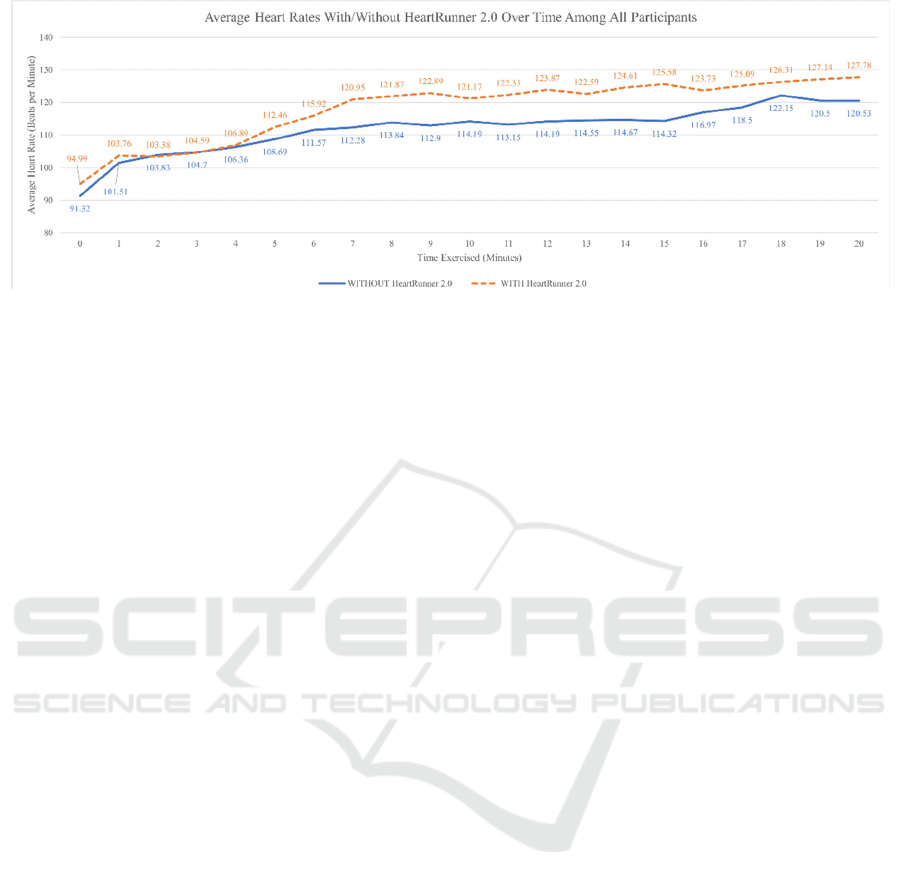
Figure 4: Average heart rate readings for participants with ASD over a 20-minute period, for both control exercise sessions
(denoted as a solid blue line) and experimental exercise sessions (denoted as a dashed orange line).
To further compare the visual attention and
interaction with the HeartRunner 2.0 App amongst
the participants, we grouped them into two categories
using a median split of the average heart rate recorded
across all experimental sessions. In other words, the
participants who achieved an average heart rate above
the median value (at 118 BPM) are referred to as the
above median heart rate group, and those participants
who achieved a lower average heart rate are grouped
into the below median heart rate group. Using eye
tracking, we aim to compare how these two
participant groups spent their visual attention during
the exercise, and whether there are significant
differences in gaze behaviors between the group who
achieved higher heart rates than those who did not.
In this paper, we report a number of notable gaze
measures such as saccade lengths and convex hull
areas. As participants interact with an interface such
as the HeartRunner 2.0 App showing real-time heart
rate visualizations, they would direct their gaze to
various points of interest on the screen. They may
fixate their attention on a visual point and moves their
gaze in search for the next relevant visual cue as they
interact with the App. Fixations are typically
understood as behaviors of information processing
activities, where a person’s eyes are relatively
stationary. Saccades refers to those quick eye
movements during successive pairs of fixations and
are typically understood as behaviors of information
search activities. Given fixations located on various
parts of a tablet screen, the distance (measured in px)
between pairwise fixations are determined by saccade
lengths, which typically indicate how far or close a
person searched for relevant visual information. An
interactive session would entail multiple stages of
information search and processing activities, where a
collection of fixations would be recorded by the end
of a session. The bounding fixations found in a
session would therefore outline an area (measured in
px
2
) where all fixations generated during a session
fall within, and referred to as the convex hull area,
which typically indicates how large or small a
person’s entire gaze journey captured during an
experimental session.
In addition to the results shown above, our eye
tracking analysis has revealed further insights into
how the two participant groups’ gaze behaviors
differed during the experiment. Though the
differences were not shown to be statistically
significant (potentially due to a small sample size),
these results provide useful evidence nonetheless for
future research in how accelerated heart rates may be
associated with certain desirable gaze behaviors. This
knowledge may inspire the development of
subsequent refinement of the visual features and
functionalities of the HeartRunner 2.0 App and
beyond.
Figure 5 shows the correlations between heart
rates and the average saccade lengths. In particular,
those participants who achieved higher heart rates
exhibited smaller saccade lengths (r = -0.511, p >
0.05). This result is in contrary with the participant
group who achieved lower heart rates, whereby
longer saccade lengths were found (r = 0.444, p >
0.05). In other words, those individuals who
generated higher heart rates searched for visual cues
that were relatively close to one another, suggesting a
more consistent and controlled interaction. This is
further amplified by the standard deviations (StDev)
found in each participant group. As shown in Figure
6, a positive correlation (r = 0.345, p > 0.05) was
found for the below median participant group,
whereas a negative correlation (r = -0.273, p > 0.05)
was found for the above median participant group.
This result indicates that those individuals who
achieved higher heart rates during the given physical
Real-Time Heart Rate Visualization for Individuals with Autism Spectrum Disorder: An Evaluation of Technology Assisted Physical
Activity Application to Increase Exercise Intensity
459
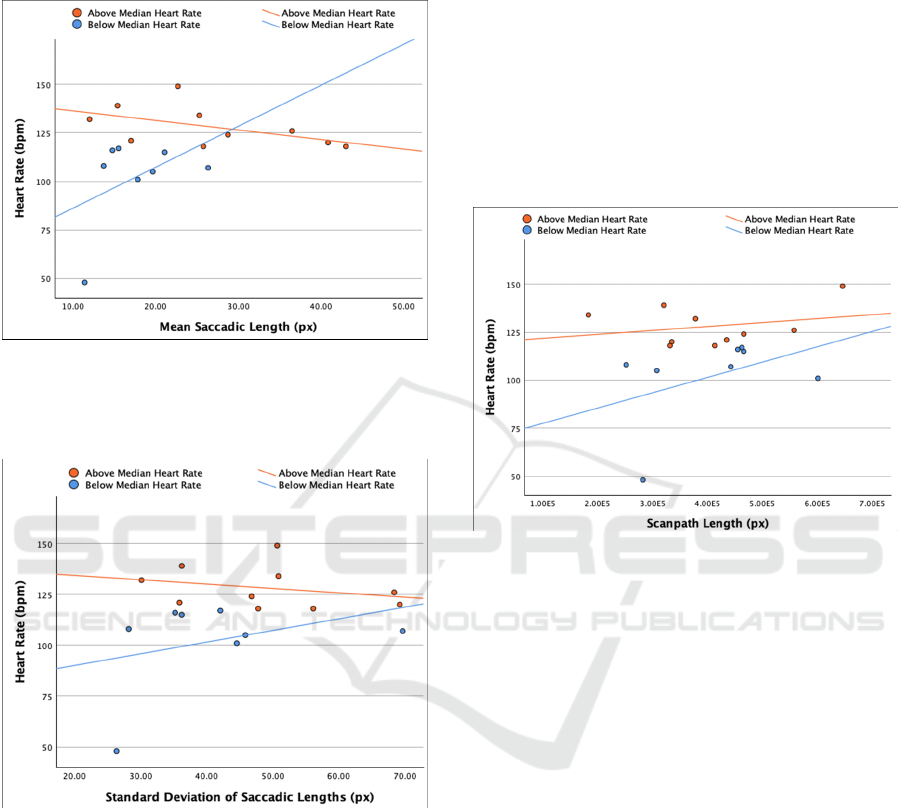
activity exhibited less dispersed fixation points,
suggesting more focused search behaviors during
their interaction with HeartRunner 2.0.
Figure 5: Positive (for the below median heart rate group,
where r = 0.444, p > 0.05) and negative (for the above
median heart rate group, where r = -0.511, p > 0.05)
correlations between heart rate and average saccade length.
Figure 6: Positive (for the below median heart rate group,
where r = 0.345, p > 0.05) and negative (for the above
median heart rate group, where r = -0.273, p > 0.05)
correlations between heart rate and the StDev of saccade
lengths.
Overall, throughout an entire exercise session, we
found that those individuals who achieved higher
heart rates also generated longer scanpaths (i.e., the
sum of all saccade lengths captured during an
interaction), as shown in Figure 7. This correlation
was evident in both participant groups with varied
degrees (r = 0.261, p > 0.05 for the above median
group, r = 0.416, p>0.05 for the below median group),
suggesting an increased engagement with the
HeartRunner 2.0 App may have contributed to
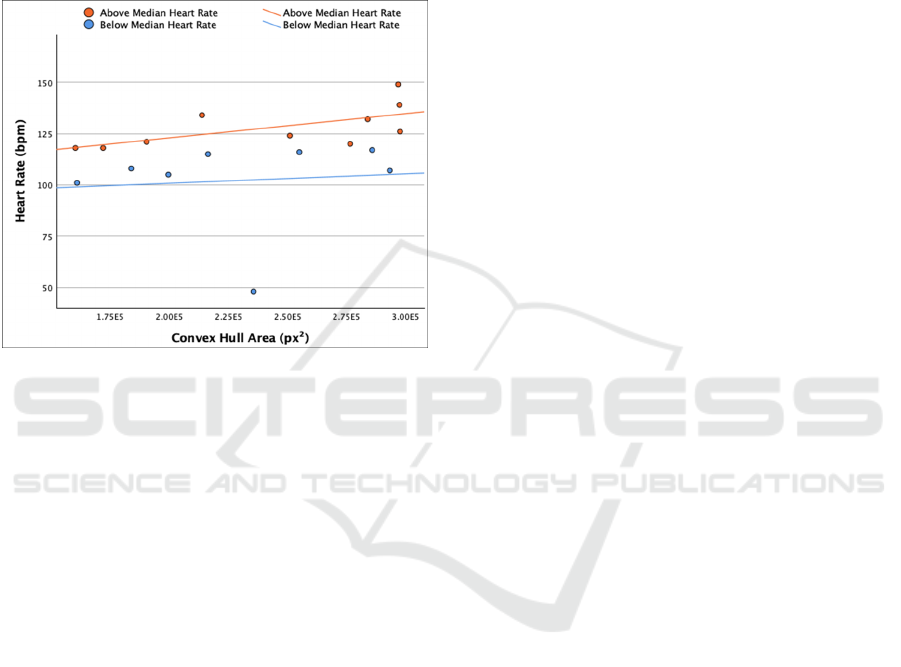
elevated heart rates during the experiment. Similarly,
we found positive correlations between one’s heart
rate and the visual area this person searched and
processed information (i.e., convex hull area), as
shown in Figure 8. This is evident in both participant
groups and notably, the correlation found in the above
median group is shown to be statistically significant
(r = 0.633, p < 0.05 for the above median group, r =
0.416, p > 0.05 for the below median group), showing
that the individuals with higher heart rates also
scanned a larger area as they interacted with the
HeartRunner 2.0 App.
Figure 7: Positive correlations found in both participant
groups between heart rate and scanpath length, where r =
0.261 (p > 0.05) in the above median heart rate group and
r = 0.416 (p > 0.05) in the below median heart rate group.
In summary, the experimental results showed that
83.3% of participants with ASD exhibited increased
heart rates during their exercise session supported by
the HeartRunner 2.0 App, with these participants
having an average increase of 12.152 BPM. After the
application’s music functionality was triggered for
the first time per user, 66.6% of these participants
were able to maintain heart rates at or above 90 BPM
for the entire remaining period of their exercise
sessions while another 27.7% of participants stayed
mostly at or above 90 BPM with few fluctuations
below this benchmark. These results suggest that real-
time heart rate visualizations such as those included
in the HeartRunner 2.0 App can serve as effective
motivating factors for individuals with ASD,
providing encouragement for them to exercise for
longer durations and in higher intensities.
Furthermore, the findings from analyzing
participants’ eye movements indicate that those
individuals who achieved higher heart rates have
exhibited gaze behaviors resembling a pattern of
more focused visual search (smaller saccade lengths),
HUCAPP 2024 - 8th International Conference on Human Computer Interaction Theory and Applications
460
less distributed points of interest (lower StDev of
saccade lengths), and greater efforts in scanning
various cues in the given visual scene (longer
scanpaths and larger convex hull areas). This result
provides further evidence for the effectiveness of
real-time heart rate visualization in the context of
technology-assisted exercise and the potential of its
future application in other scenarios beyond the
experimental conditions shown in this paper.
Figure 8: Positive correlations found in both participant
groups between heart rate and convex hull area, where r =
0.633 (p < 0.05) in the above median heart rate group and
r = 0.096 (p > 0.05) in the below median heart rate group.
5 RELATED WORK
A brief overview of related work is presented in this
section, more extensive reviews of empirical
evidence for the use of exercise as an evidence-based
practice for individuals with ASD can be found in
(Dillon et al., 2017; Bittner et al., 2018).
In recent years, technology assisted exercise has
been shown to have a positive effect on individuals
with ASD (Wong et al., 2015), suggesting visual
stimulation from the use of technology may increase
participation. Technology has been shown to be an
effective mean to promote motivation (Takeo et al.,
2007), with prior studies demonstrating individuals
with ASD are able to engage in more on-task
behaviors and may learn physical activity skills at a
faster rate than those without technology-aided
instruction (Case & Yun, 2015). In another study, the
notion of coupling gaming and technology is applied
to engage individuals in exercise, as body
movements, reactions, and energy expenditure are
tracked through participation (Trout & Christie,
2007). This is further investigated in (Anderson-
Hanley et al., 2011), where findings have shown
significant improvements in attention and working
memory and decreases in stereotypical behaviors in
individuals with ASD immediately after participating
in a 20-minute exergaming intervention.
Motivated by these prior research efforts, this
paper aims to extend the existing body of knowledge
in technology assisted exercise designed specifically
for individuals with ASD by proposing an application
that visualizes heart rates in real time to help with
comprehension of energy expenditures during
physical activity, and to sustain and evaluate exercise
intensity. More specifically, informed by prior
evaluations of HeartRunner 1.0 (Fu et al., 2020) that
supported a multi-user mode for multiple users to
compete with one another during an exercise session,
we aim to reduce social pressure while promoting
effective visual stimuli in HeartRunner 2.0.
6 CONCLUSIONS & FUTURE
WORK
This paper presents an application of real-time heart-
rate visualization, namely the HeartRunner 2.0 App,
which aims to promote engagement and exercise
intensity during physical activity for individuals with
ASD. The overall goal of the App is to contribute to
technology assisted exercises designed specifically
for this particular group of individuals who typically
lack motivation in exercising, which tends to lead to
a cohort of health problems. Through a controlled
experiment involving 20 individuals with ASD, we
found evidence suggesting the proposed App is
effective in helping individuals with ASD to reach
higher intensity during exercise and that engagement
with the App has likely contributed to elevation in
heart rates. However, the findings from this research
should be interpreted within the limitations of the
experiments conducted. Firstly, it may be argued that
music can be a bothersome obstacle for some
individuals with ASD, since the experiment shown in
this paper was not designed to exclusively measure or
quantify the effects of music in such cases, it would
be necessary to follow up with additional purposely
designed studies to validate potential speculations.
Secondly, although the participants who took part in
the study shown in this paper were on the ASD
spectrum, we did not group these individuals into
more refined categories, whereby future experiments
with more cultivated user groups may be helpful to
further the body of knowledge in this domain.
Thirdly, we attempted to collect participant feedback
Real-Time Heart Rate Visualization for Individuals with Autism Spectrum Disorder: An Evaluation of Technology Assisted Physical
Activity Application to Increase Exercise Intensity
461

using established usability questionnaires, however,
these questions were too difficult for the participants
to comprehend, whereby future research could
potentially focus on developing more appropriate
forms of feedback for individuals with ASD.
Furthermore, some variables were not controlled,
such as whether the participants had energy drinks
before the exercises or collecting heart rate histories
of the participants as baselines to compare against the
values collected in our study, where future research
may potentially investigate.
Nonetheless, the study shown in this paper
provides a basis for utilizing real-time heart rate
visualization and music to benefit individuals with
ASD in technology assisted exercise, future work
could collect data from larger sample sizes to analyze
in between-subject experiments. In addition, usability
studies can be integrated to assess the specific visual
components that may be deemed more usable and
effective to this particular user group. Furthermore,
additional use cases and application scenarios may be
investigated to determine the effectiveness of the
HeartRunner 2.0 App. Lastly, while the focus of the
experiment shown in this paper emphasizes on the
evaluation of whether higher intensity can be
achieved while supported the HeartRunner 2.0 App,
future experiments may investigate whether
participants supported by the App would exercise for
longer durations than those who did not.
REFERENCES
Anderson-Hanley, C., Tureck, K., Schneiderman, R. L.
(2011). Autism and exergaming: Effects on repetitive
behaviors and cognition. Psychology Research and
Behavior Management, 4, 129-137.
Bensound. (2022). Happy Rock. Retrieved from
https://www.bensound.com/royalty-free-
music/track/happy-rock/, last accessed Oct 2023
Bittner, M., McNamara, S., Adams, D., Goudy, L., Dillon,
S. R. (2018). Exercise identified as an evidence-based
practice for children with autism spectrum disorder.
Palaestra, 32(2), 15-20.
Case, L., Yun, J. (2015). Visual practices for children with
autism spectrum disorders in physical activity.
Palaestra, 29(3), 21-26.
Centers for Disease Control and Prevention (2022).Target
Heart Rate and Estimated Maximum Heart Rate,
Retrieved from https://www.cdc.gov/physicalactivity/
basics/measuring/heartrate.htm , last accessed Oct
2023.
Dieringer, S. T., Zoder-Martell, K., Porretta, D. L., Bricker,
A., Kabazie, J. (2017). Increasing Physical Activity in
Children with Autism Through Music, Prompting and
Modeling. In Psychology in the Schools 54, 4, 421-432.
Dillon S. R., Adams D., Goudy L., Bittner M., McNamara
S. (2017). Evaluating Exercise as Evidence-Based
Practice for Individuals with Autism Spectrum
Disorder. Front. Public Health 4:290.
Fu, B., Chao, J., Bittner M., Zhang, W., Aliasgari, M.
(2020). Improving Fitness Levels of Individuals with
Autism Spectrum Disorder: A Preliminary Evaluation
of Real-Time Interactive Heart Rate Visualization to
Motivate Engagement in Physical Activity. In
Computers Helping People with Special Needs, 17
th
International Conference, ICCHP 2020, Proceedings,
Part II, September 9-11, 2020, Lecco, Italy. 81-89.
Matthew, M. J., Shaw K. A., Baio J., Washington, A.,
Patrick, M., DiRienzo, M., Christensen, D. L., Wiggins,
L. D., Pettygrove, S., Andrews, J. G.,; Lopez, M.,
Hudson, A., Baroud, T., Schwenk, Y., White, T.,
Rosenberg, C. R., Lee, L-C., Harrington, R. A., Huston,
M., Hewitt, A., Esler, A., Hall-Lande, J., Poynter, J., N.,
Hallas-Muchow, L., Constantino, J., N., Fitzgerald, R.,
T., Zahorodny, W., Shenouda, J., Daniels, J. L.,
Warren, Z., Vehorn, A., Salinas, A., Durkin, M. S.,
Dietz, P. M. (2020). Prevalence of Autism Spectrum
Disorder Among Children Aged 8 Years – Autism and
Developmental Disabilities Monitoring Network, 11
Sites, United States, 2016. In Morbidity and Mortality
Weekly Report (MMWR) Surveillance Summaries 69,
4, 1-12.
Murray, N. (2019). FlappySwift Repository,
https://github.com/newlinedotco/FlappySwift, last
accessed Oct 2023.
Parrott, M., Ruyak, J., Liguori, G. (2020). The History of
Exercise Equipment: From Sticks and Stones to Apps
and Phones. In ACSM’s Health & Fitness Journal 24, 6
(2020). 5-8.
Physical Activity Guidelines Advisory Committee. (2008).
Physical Activity Guidelines Advisory Committee
Report, Washington, DC: U.S. Dept of Health and
Human Services.
Riebe, D., Ehrman, J. K., Liguori, G., Magal, M. (2018).
Chapter 6 General Principles of Exercise Prescription.
In: ACSM’s Guidelines for Exercise Testing and
Prescription. 10th Ed. Wolters Kluwer/Lippincott
Williams & Wilkins, Philadelphia, PA, 143-179.
Shaw, K. A., Williams, S., Hughes, M. M., Warren, Z.,
Bakian, A. V., Durkin, M. S., Esler, A., Hall-Lande, J.,
Salinas, A., Vehorn, A., Andrews, J. G., Baroud, T.,
Bilder, D. A., Dimian, A., Galindo, M., Hudson, A.,
Hallas, L., Lopez, M., Pokoski, O., Pettygrove, S.,
Rossow, K., Shenouda, J., Schwenk, Y. D., Zahorodny,
W., Washington, A., Maenner. M. J. (2023). Statewide
County-Level Autism Spectrum Disorder Prevalence
Estimates – Seven U.S. States, 2018. In Annals of
Epidemiology 79, 39-43.
Takeo, T., Toshitaka, N., Daisuke, K. (2007). Development
application softwares on PDA for autistic disorder
children, 12, 31-38.
Trout, J., Christie, B. (2007). Interactive video games in
physical education. Journal of Physical Education,
Recreation, & Dance, 78(5), 29- 45.
HUCAPP 2024 - 8th International Conference on Human Computer Interaction Theory and Applications
462

Wong, C., Odom, S. L., Hume, K. A., Cox, A. W., Fettig,
A., Kucharczyk, S., Brock, M. E., Plavnick, J. B.,
Fleury, V. P., Schultz, T. R. (2015). Evidence-Based
Practices for Children, Youth, and Young Adults with
Autism Spectrum Disorder: A Comprehensive Review.
Journal of Autism and Developmental Disorder. 45(7):
1951‐1966.
Real-Time Heart Rate Visualization for Individuals with Autism Spectrum Disorder: An Evaluation of Technology Assisted Physical
Activity Application to Increase Exercise Intensity
463
