
Multispectral Stereo-Image Fusion for 3D Hyperspectral Scene
Reconstruction
Eric L. Wisotzky
1,2 a
, Jost Triller
1
, Anna Hilsmann
1 b
and Peter Eisert
1,2 c
1
Computer Vision & Graphics, Fraunhofer HHI, Einsteinufer 37, 10587 Berlin, Germany
2
Department of Informatics, Humboldt University, Berlin, Germany
Keywords:
Multispectral, Hyperspectral, Stereo-Reconstruction, Optical Flow, Disparity, Spectral Data Fusion,
Demosaicing, Multispectral Snapshot Cameras.
Abstract:
Spectral imaging enables the analysis of optical material properties that are invisible to the human eye. Dif-
ferent spectral capturing setups, e.g., based on filter-wheel, push-broom, line-scanning, or mosaic cameras,
have been introduced in the last years to support a wide range of applications in agriculture, medicine, and
industrial surveillance. However, these systems often suffer from different disadvantages, such as lack of real-
time capability, limited spectral coverage or low spatial resolution. To address these drawbacks, we present a
novel approach combining two calibrated multispectral real-time capable snapshot cameras, covering differ-
ent spectral ranges, into a stereo-system. Therefore, a hyperspectral data-cube can be continuously captured.
The combined use of different multispectral snapshot cameras enables both 3D reconstruction and spectral
analysis. Both captured images are demosaicked avoiding spatial resolution loss. We fuse the spectral data
from one camera into the other to receive a spatially and spectrally high resolution video stream. Experiments
demonstrate the feasibility of this approach and the system is investigated with regard to its applicability for
surgical assistance monitoring.
1 INTRODUCTION
In recent years, multi- and hyperspectral imaging
(MSI/HSI) has garnered increasing interest in the
realm of scientific research, as well as in the applied
fields of image analysis and monitoring. MSI and HSI
are contact-free, non-invasive and non-destructive
method for analyzing optical surface properties that
are invisible to the human eye (Lu and Fei, 2014).
This technology is promising across a wide range of
domains, including industrial (Shafri et al., 2012),
agricultural (Jung et al., 2006; Moghadam et al.,
2017), medical (Clancy et al., 2020; Lu and Fei,
2014), and security-oriented image analysis (Yuen
and Richardson, 2010). While MSI captures images
at specific discrete wavelengths, HSI acquires images
across a vast number of continuous narrow bands and
therefore attains more reliable and comprehensive in-
formation.
Hyperspectral cameras find applications across a
wide spectral range from ultraviolet, through the visi-
a
https://orcid.org/0000-0001-5731-7058
b
https://orcid.org/0000-0002-2086-0951
c
https://orcid.org/0000-0001-8378-4805
ble range, up to infrared. The selection of the spec-
tral range depends on the specific application with
larger and narrower spectral ranges employed to ob-
tain important information from the image data, such
as biological (M
¨
uhle et al., 2021) or chemical parame-
ters (Biancolillo et al., 2014; Borr
`
as et al., 2015), dis-
tinct optical characteristics of objects and their tempo-
ral variations, e.g., agricultural products (Qin and Lu,
2008), animal organs (Studier-Fischer et al., 2022;
M
¨
uhle et al., 2021), human tissue (Wisotzky et al.,
2020a) and industrial products (Hollstein et al., 2016).
In order to acquire hyperspectral data cubes with
a large number of spectral bands (few dozens up to
several hundreds), various capturing techniques exist.
Line- (Hollstein et al., 2016) or pushbroom scanning
(M
¨
uhle et al., 2021) and filter-wheels (Wisotzky et al.,
2018) rely on sequential scanning, and therefore need
up to several seconds to acquire one complete hyper-
spectral data cube (Shapey et al., 2019). This limita-
tion poses challenges for real-time video processing
and interactive applications, where swift responsive-
ness is crucial. As a result, there is a growing trend to-
wards compromising both the spectral as well as spa-
tial resolution in order to achieve real-time acquisition
88
Wisotzky, E., Triller, J., Hilsmann, A. and Eisert, P.
Multispectral Stereo-Image Fusion for 3D Hyperspectral Scene Reconstruction.
DOI: 10.5220/0012354400003660
Paper published under CC license (CC BY-NC-ND 4.0)
In Proceedings of the 19th International Joint Conference on Computer Vision, Imaging and Computer Graphics Theory and Applications (VISIGRAPP 2024) - Volume 3: VISAPP, pages
88-99
ISBN: 978-989-758-679-8; ISSN: 2184-4321
Proceedings Copyright © 2024 by SCITEPRESS – Science and Technology Publications, Lda.

of spectral data cubes (M
¨
uhle et al., 2021; Ebner et al.,
2021; Wisotzky et al., 2023b; Wisotzky et al., 2019).
Multispectral cameras capture only specific dis-
crete wavelengths, adopting a methodology akin to
the Bayer pattern of single chip RGB cameras (Bayer,
1976). These Multi Spectral Filter Arrays (MSFA)
use narrow spectral masking on pixel-level on a single
sensor plane, e.g., 6, 8, 16, or 25 spectral bands, also
called mosaic snapshot sensors (Ebner et al., 2021;
Wisotzky et al., 2022). The captured image data is
defined by moxels (mosaic element) corresponding
to the filter pattern, and stored in a data-cube repre-
sentation with three dimensions, two spatial dimen-
sions (width and height) and one spectral dimension
(wavelength λ). The simplest example is similar to
the Bayer pattern where one green element is replaced
by another filter resulting in a 2×2 pattern (Hershey
and Zhang, 2008). These systems can be extended to
an n×m, e.g., 3×3, 4×4, 5×5 or even non-quadratic
2×3 mosaic patterns for recording wavelengths in all
possible spectral ranges. The compromise made in
reducing spectral and spatial resolution of multispec-
tral cameras impairs the quality of the data. This is
often addressed by spectral image enhancement al-
gorithms aiming at spatial resolution restoration with
high spectral band coverage (Sattar et al., 2022). In
the spatial direction, missing spectral values can be
restored using interpolation or prediction techniques,
also called demosaicing (Arad et al., 2022b; G
¨
ob
et al., 2021). However, this process is challenging and
often inaccurate.
In this paper, we present a multispectral stereo
approach, fusing the data of two real-time capa-
ble mosaic-snapshot cameras with different spectral
range into a hyperspectral data cube with high spatial
and spectral coverage, circumventing the downsides
of the different setups. This is achieved by adapt-
ing hyperspectral stereo vision and calibration (Zia
et al., 2015; Tanriverdi et al., 2019) to the specific
multispectral setup in combination with multispectral
demosaicing. This not only allows for high quality
data fusion with high spectral and spatial resolution
but also for 3D reconstruction from the multispectral
recordings.
The remainder of this paper is structured as fol-
lows. The following section discusses related work in
the field of MSI demosaicing and data fusion. Follow-
ing, we describe our proposed spectral image fusion
pipeline. Section 4 presents the stereo camera setup
and data acquisition before section 5 describes exper-
iments and fusion results, followed by a conclusion in
section 6.
2 RELATED WORK
While multispectral imaging (MSI) records images at
distinct, predefined wavelengths, hyperspectral imag-
ing (HSI) acquires images across a broad range of
continuous, narrow spectral bands. This results in
HSI providing more reliable and comprehensive in-
formation. However, HSI capturing is usually based
on sequential scanning, making it slow and expensive.
Multispectral snapshot shot cameras employ narrow
spectral filters at the pixel level on a single sensor,
capturing several wavelengths at limited spatial res-
olution in real-time. In recent years, multispectral
data enhancement or fusion approaches have gained
increasing interest.
2.1 Multispectral Demosaicing
To enhance the spectral-spatial resolution of multi-
spectral snapshot cameras, different concepts have
been proposed in the literature, collectively catego-
rized under the term demosaicing. In addition to the
conventional interpolation techniques employed for
the reconstruction of absent spectral values, such as
nearest neighbor and (weighted) bilinear interpola-
tion (Brauers and Aach, 2006), more sophisticated ap-
proaches have evolved incorporating domain-specific
knowledge about the multispectral filter array (Mi-
houbi et al., 2017).
In recent years, the application of deep neural net-
works (NN) has emerged in the field of hyperspectral
imaging. These networks have been leveraged to pre-
dict HSI data from MSI or even classic RGB image
data (Arad et al., 2022a; Arad et al., 2020). Methods
based on deep neural networks have been shown to
achieve superior accuracy than classical approaches,
especially in the delineation of spatial and spectral
boundaries. However, there exist central challenges
associated with these approaches. The main challenge
pertains to the lack of training data and the substan-
tial reliance of the method. This implies that the spec-
tral characteristics of individual scenes are learned for
interpolation purposes and thus establishing a criti-
cal dependence between the planned application and
quality and quantity of the training data. As a result,
suboptimal outcomes and inaccuracies in hyperspec-
tral data may manifest if the training data is inade-
quately chosen, of poor quality or insufficient in scope
(Wang et al., 2021). Further, achieveing real-time ca-
pability as well as mitigating artifacts like blurring re-
main unsolved challenges in the integration of deep
neural networks into hyperspectral imaging processes
(Lapray et al., 2014).
Multispectral Stereo-Image Fusion for 3D Hyperspectral Scene Reconstruction
89

2.2 Multispectral Data Fusion
Data fusion has been used to combine data from an
MSI, an RGB, or a grayscale sensor with an HSI cam-
era (Guo et al., 2022; Oiknine et al., 2018; Tanriverdi
et al., 2019) in order to enhance the spatial resolution
of the HSI data. The combination of different types
of optical sensors with different spectral and spatial
resolutions, especially for remote sensing, leads to
the problem that these sensors provide data in dif-
ferent modalities depending on their sensor charac-
teristics. However, the integration of data of differ-
ent sources can lead to an improved accuracy in data
analysis and interpretation (M
˚
age et al., 2008; Tan-
riverdi et al., 2019). Most approaches employ so-
phisticated setups using a beam splitter or a shifting
unit to ensure that both cameras are virtually aligned
on the exact same optical path (Guo et al., 2022).
However, the use of a beam splitter carries the risk
of lower intensity and interpolation of the spectral in-
formation leading to blurring artifacts (Arad and Ben-
Shahar, 2016). Other approaches use light-field imag-
ing (Manakov et al., 2013; Wisotzky et al., 2023a;
MacCormac et al., 2023). In order to interpret and
analyze the data from different sensors in a cohesive
manner, methods for data fusion are needed (Forshed
et al., 2007; Biancolillo et al., 2014). While general
fusion techniques have undergone significant devel-
opment and find applications in various fields ranging
from satellite-based Earth observation to computer vi-
sion, medical imaging, and security, the fusion of data
from multiple sources with different spatial, spectral,
and temporal resolutions remains challenging (Zhang,
2010).
In recent years, research efforts have been directed
towards the extraction of 3D image data from multi-
spectral images (Sattar et al., 2022). This involves the
calculation of the 3D shape of the object’s surface by
analyzing multispectral images captured from differ-
ent camera views (Zia et al., 2015; Klein et al., 2014).
It is worth noting that all existing methods in this do-
main employ the same multispectral imaging range
for both viewpoints or use overlapping spectral ranges
to allow 3D analysis in this range (Sattar et al., 2022;
Bradbury et al., 2013; Shrestha et al., 2011; Genser
et al., 2020).
The process of data fusion can be grouped into
three strategies: low-level, mid-level and high-level
(Pohl and Van Genderen, 1998). The low-level data
fusion operates at pixel level, straightforwardly con-
catenating the raw data from all sources pixel by
pixel into a single matrix. This process can be exe-
cuted without additional preprocessing; although oc-
casional data adjustments may be necessary to ensure
compatibility (Borr
`
as et al., 2015). In contrast, mid-
level data fusion, also referred to as feature level fu-
sion, involves the extraction of relevant features from
each data source individually. These features are de-
pending on the inherent characteristics of the data,
e.g., spectral intensities, edges or texture. Subse-
quently, these features are fused into a single dataset
for further processing, such as classification or re-
gression (Dong et al., 2009). At high-level fusion,
processing is performed on each data block indepen-
dently and the results are combined to achieve the fi-
nal decision. Therefore, it is often denoted as decision
level fusion (Zhang, 2010).
3 HYPERSPECTRAL FUSION
In order to achieve a hyperspectral image with high
spatial resolution and real-time capabilities, we com-
bine two multispectral snapshot mosaic cameras with
n and m spectral bands, covering different spectral
intervals into a stereo setup. To fuse the captured
data of both cameras into one HSI data cube, we first
demosaic the snapshot mosaic images (section 3.1),
before calculating a dense registration between the
two stereo views (section 3.2) and fusing the differ-
ent spectral data based on the calculated warps.
3.1 Demosaicing
We employ demosaicing as an essential processing
step, serving two key purposes: enhancing the vi-
sual quality of the images into full spatial resolution
and facilitating accurate feature detection. This step
is particularly crucial due to the substantial intensity
differences between neighboring pixels caused by the
different filter responses and specific spectral behav-
iors, i.e., due to the structure of an MSFA. Attempt-
ing feature detection and registration on the single-
channel mosaic pattern would therefore be impracti-
cal. In addition, demosaicing enables us to accommo-
date sensors with different mosaic sizes in the stereo
setup, e.g., as in this work n = 4×4 and m = 5×5.
In our demosaicing process we opt for a CNN ar-
chitecture with parallel building blocks following the
methodology detailed in (Wisotzky et al., 2022). The
network uses a 3D CNN for spectral refinement as
well as a convolutional layer for mosaic-to-cube inter-
polation, followed by 2D deconvolutional layers for
spatial upsampling at each spectral band, see Fig. 1.
VISAPP 2024 - 19th International Conference on Computer Vision Theory and Applications
90
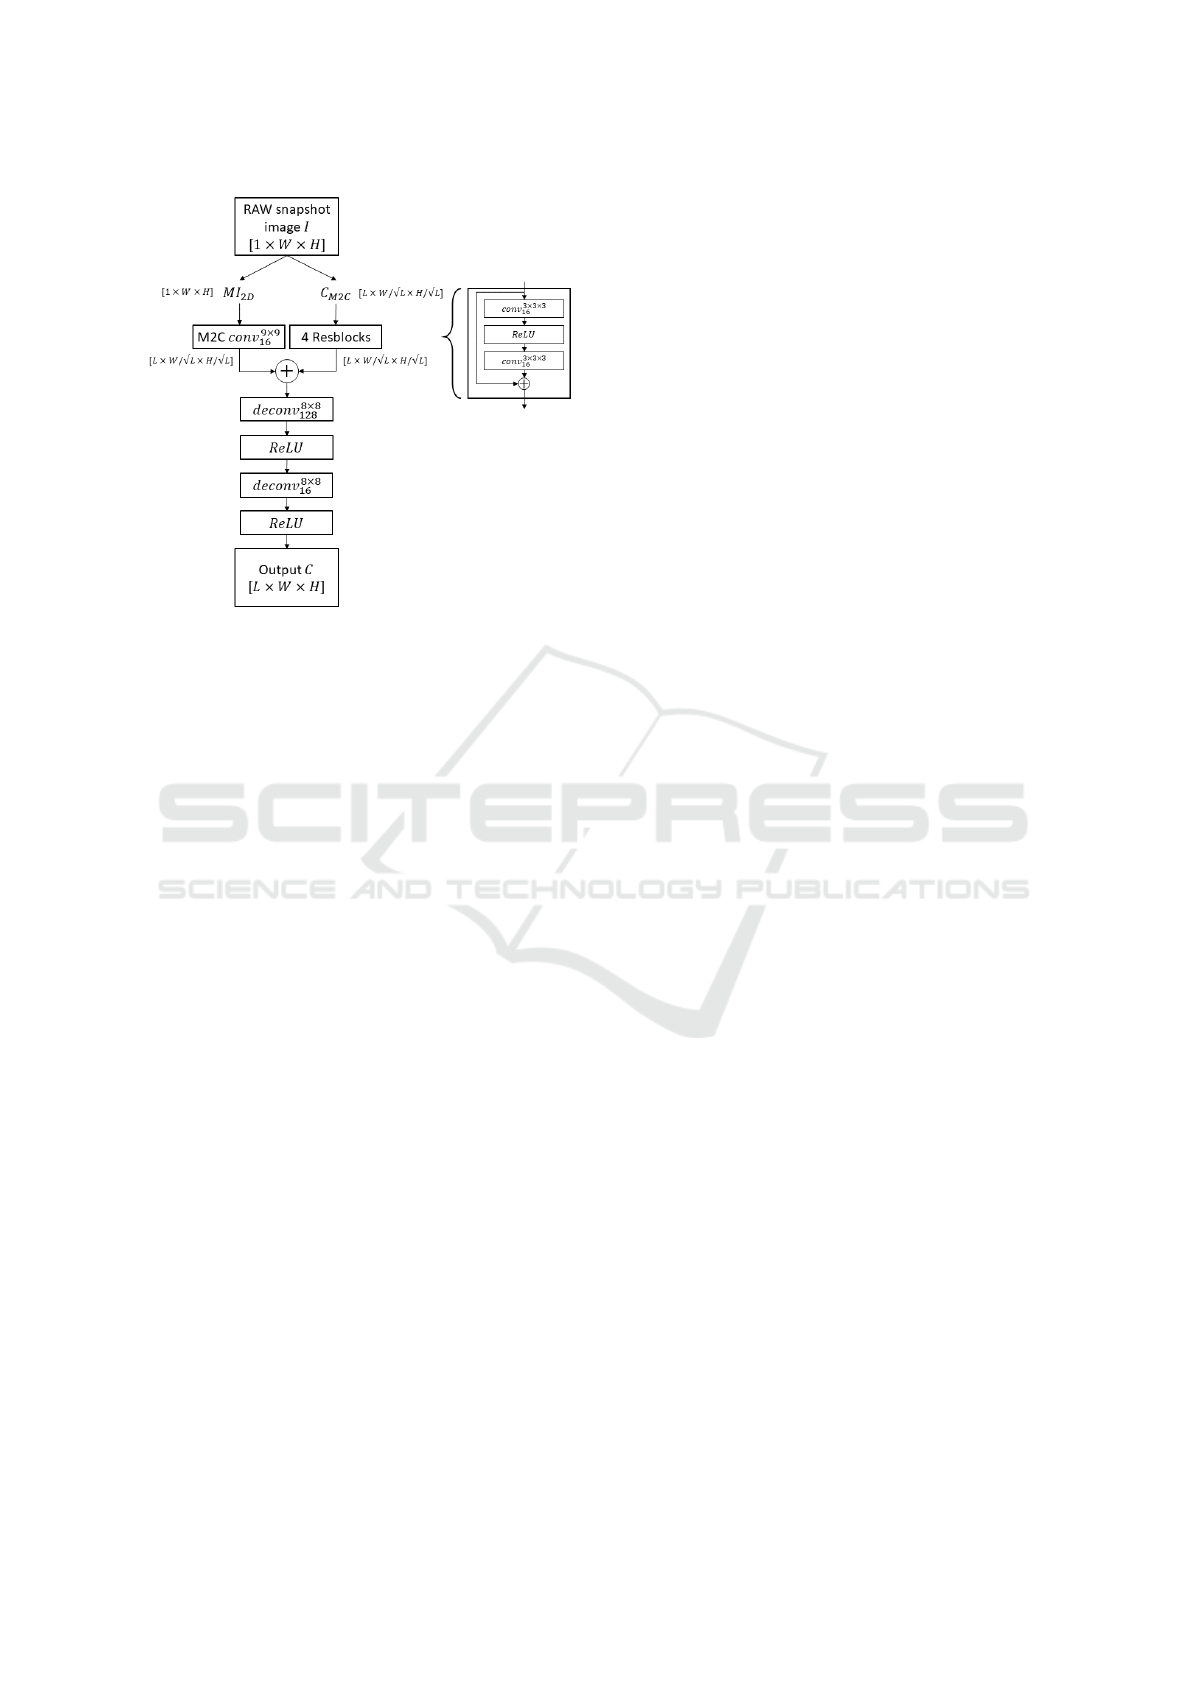
Figure 1: The demosaicing network. Two parallel feature
extracting layers using a mosaic-to-cube converter (M2C)
on one side and ResNet blocks on the other side are used
followed by a feature adding and two deconvolution (de-
conv) layers to upsample the spatial dimensions of the im-
age.
3.2 Disparity Calculation
Other work to calculate the image disparity has fo-
cused on two key parts: (1) feature matching and (2)
image regularization (Genser et al., 2020; Shrestha
et al., 2011; Sattar et al., 2022; Wisotzky et al.,
2023c). Given two images, feature matching aims
to compute a matching cost between a pair of im-
age patches. In general, this is an optimization prob-
lem maximizing the visual similarity with given con-
straints on the 3D geometry. Optical flow formulates
the same problem based on the entire image content
combining both parts. Therefore, we use a adapted
approach which iteratively computes the optical flow
between two images.
In order to calculate the disparity between the
two stereo images, we use a pixel-wise alignment
based on optical flow calculation. However, optical
flow is based on the brightness constancy assump-
tion. Our two multispectral images (I
L
and I
R
) hold
different numbers of channels as well as different in-
formation from different wavelengths. For each de-
mosaiced view, we therefore first average the spectral
channels after channel-wise normalization, resulting
in single channel images I
′
L
and I
′
R
. Due to different
spectral coverage of the two cameras, these images
hold different reflectance information and thus violate
the brightness constancy assumption of optical flow.
However, our experiments showed that the networks
we used can adapt to this. We selected three differ-
ent models from the literature as basis for the opti-
cal flow model: RAFT (Teed and Deng, 2020), DIP
(Zheng et al., 2022) and MS RAFT+ (Jahedi et al.,
2022). Each of these models has been adapted to al-
low gray-scale inputs. The feature detection is per-
formed on each image individually using a Feature
Encoder, see Figure 2. Subsequently, an iterative pro-
cess determines the disparity information. We use the
disparity of the previous image pair for an initializa-
tion of this process, reducing the number of iterations
of the disparity calculation to two.
Evaluation of these networks has performed using
widely used benchmark datasets: FlyingThings3D
(Mayer et al., 2016), MPI Sintel (Butler et al., 2012)
and KITTI optical flow 2015 (Menze and Geiger,
2015).
3.3 Data Fusion
Utilizing the dense disparity information, the spectral
information is fused by transferring the spectral in-
formation from the left view (I
L
) to the right view
(I
R
). To achieve optimal aligned spectral data, the
fusion process involves consideration of various fac-
tors that influence the spectral response in the two di-
verse cameras. These factors involve spectral filter
responses of the individual bands, camera parameters
and illumination conditions. To account for these fac-
tors, we apply spectral correction and reconstruction
as elaborated in (Wisotzky et al., 2020a; M
¨
uhle et al.,
2021). Finally, the spectral bands are sorted accord-
ing to their specific wavelength.
This results in a hyperspectral data cube with high
spatial as well as spectral resolution (n + m spectral
bands). In addition, the disparity map provides depth
information, such that accurate 3D reconstruction can
be derived from a calibrated stereo system.
3.4 Stereo Calibration
In order to retrieve reliable spatial information from
the disparity map, a calibration process of the stereo-
scopic system is essential (Rosenthal et al., 2017). For
this purpose, we use a checkerboard pattern (Eisert,
2002). The automated calibration principle we used
in this work has six main steps and needs only to be
performed once the stereo-system has been changed.
1. Capturing. Acquisition of multiple (n) calibra-
tion views (I
C
) guaranteeing that images stay in
focus resulting in a calibration set I
C j
where j =
[1,n] := {j ∈ N|1 ≤ j ≤ n}.
2. Feature Detection. Detection of 2D fea-
ture points F in I
C j
analogue to Sec. 3.2
Multispectral Stereo-Image Fusion for 3D Hyperspectral Scene Reconstruction
91
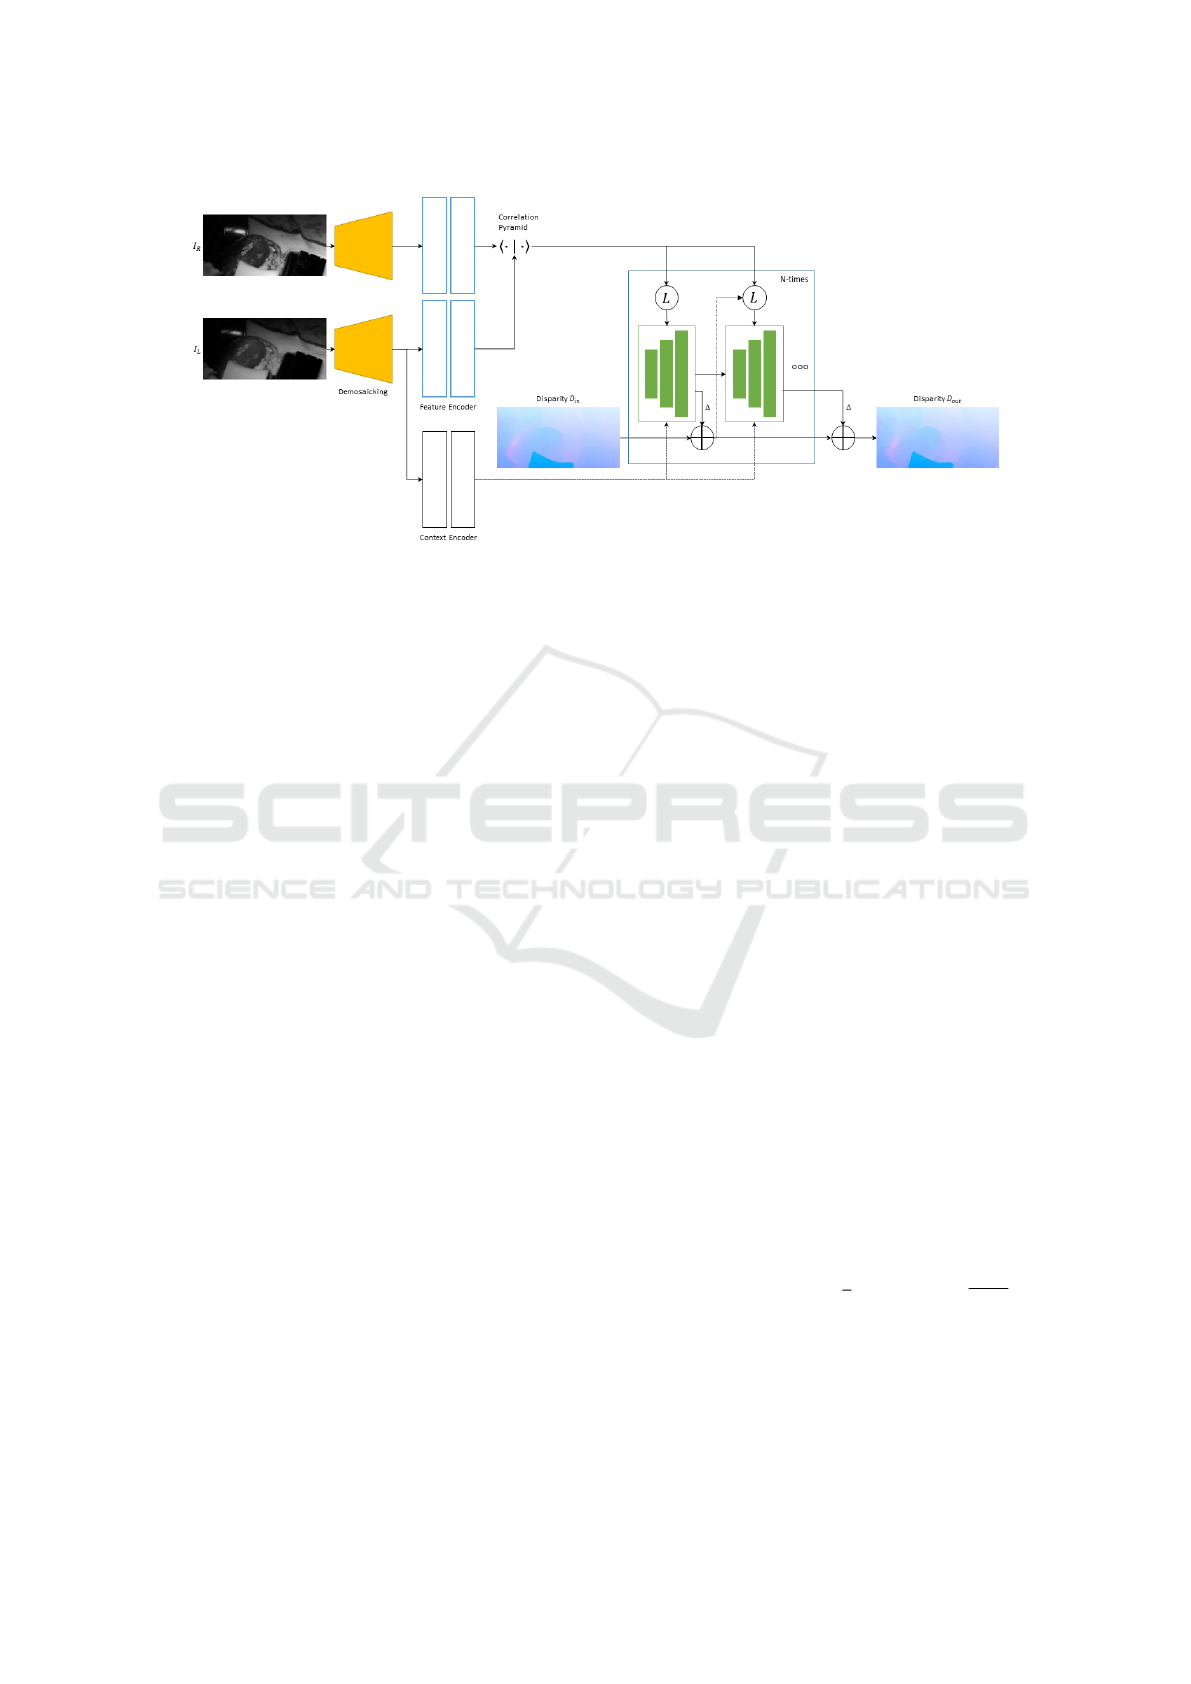
Figure 2: The entire pipeline to calculate disparity. The first part includes parallel demosaicing of both camera images. Then
a feature extraction follows using a mixture of convolutional layers and ResNet units. As last step the disparity is calculated
iteratively by using several convolutional blocks.
and assign a 2D-to-3D mapping between cap-
tured views I
C
and reference model views I
R
resulting in a unique ID-based feature point
set N(I
C j
,I
R j
) = F1(id,x,y), F2(id,x, y),... →
F1(id,x, y),F2(id,x, y),.. ..
3. Intermediate Calibration and Pre-Orientation.
Using N(I
C j
,I
R j
) to compute an approximated
camera pose P(I
R j
) via a least-square optimiza-
tion describing a rigid body transformation [R|t]
j
where R is a 3 ×3 rotation matrix and t a 1 ×3
translation vector, between the captured view I
C j
and the model reference view I
R j
. Then
P(I
R j
) = argmin(N(I
C j
,I
R j
)) (1)
minimizes the L2-norm between detected fea-
ture points and reprojected 2D points of reference
model features using the current [R|t] estimations.
4. Single Camera Calibration. We estimate the
intrinsic camera parameter by a linear gradient-
based estimation of camera pose and lens param-
eters using the pre-orientated poses of step 3. The
process is performed independently for the left
and right camera. Currently, we estimate the focal
length f
x
, f
y
and three radial distortion parameters
k
1
,k
2
,k
3
and ignore the principal point and tan-
gential lens distortion.
5. Stereo Camera Calibration. The estimated cam-
era view pose from step 4 allows a straightfor-
ward computation of the camera extrinsic param-
eter, which describe relative transformation from
right camera C
R
to the left camera C
L
to complete
the stereo calibration.
6. Calibration Validation. We validate our calibra-
tion routine with two geometrical statistics in 3D
space.
(a) Measurement accuracy: the distances between
feature points are known with high accuracy. The
distances between a preselected set of distances is
computed for the reconstructed points and com-
pared to known ground-truth values.
(b) Planarity constraint: The distance of the re-
constructed point to the reconstructed object plane
is an indicator of planarity of the reconstructed
object, which needs to be fulfilled, as the original
calibration target is also planar.
4 STEREO SETUP AND
EXPERIMENTS
To select the best performing optical flow model, we
performed different evaluations on the three adapted
models. For consistency, we used the data from Fly-
ing Things3D and MPI Sintel for training and evalu-
ated on MPI Sintel and KITTI optical flow 2015 data.
All images are converted from RGB to gray-scale af-
ter channel-wise normalization. To simulate the dif-
ferences of the captured reflectance intensity in the
two cameras, we applied different modulations on the
three channels of one camera image during the gray-
scale conversion. One of the following functions is
randomly selected and applied for each channel: iden-
tity y = x, square root y =
√
x and y = 1 −
√
1 −x, ex-
ponentiation y = x
n
and y = 1 −(1 −x)
n
with n = 2
or n = 4, and logarithm y = log
2
(x + 1) and y =
1 −log
2
(2 −x).
The best performing model is then integrated in
our pipeline to evaluate the functionality and intra-
operative usability of our multispectral image fu-
VISAPP 2024 - 19th International Conference on Computer Vision Theory and Applications
92
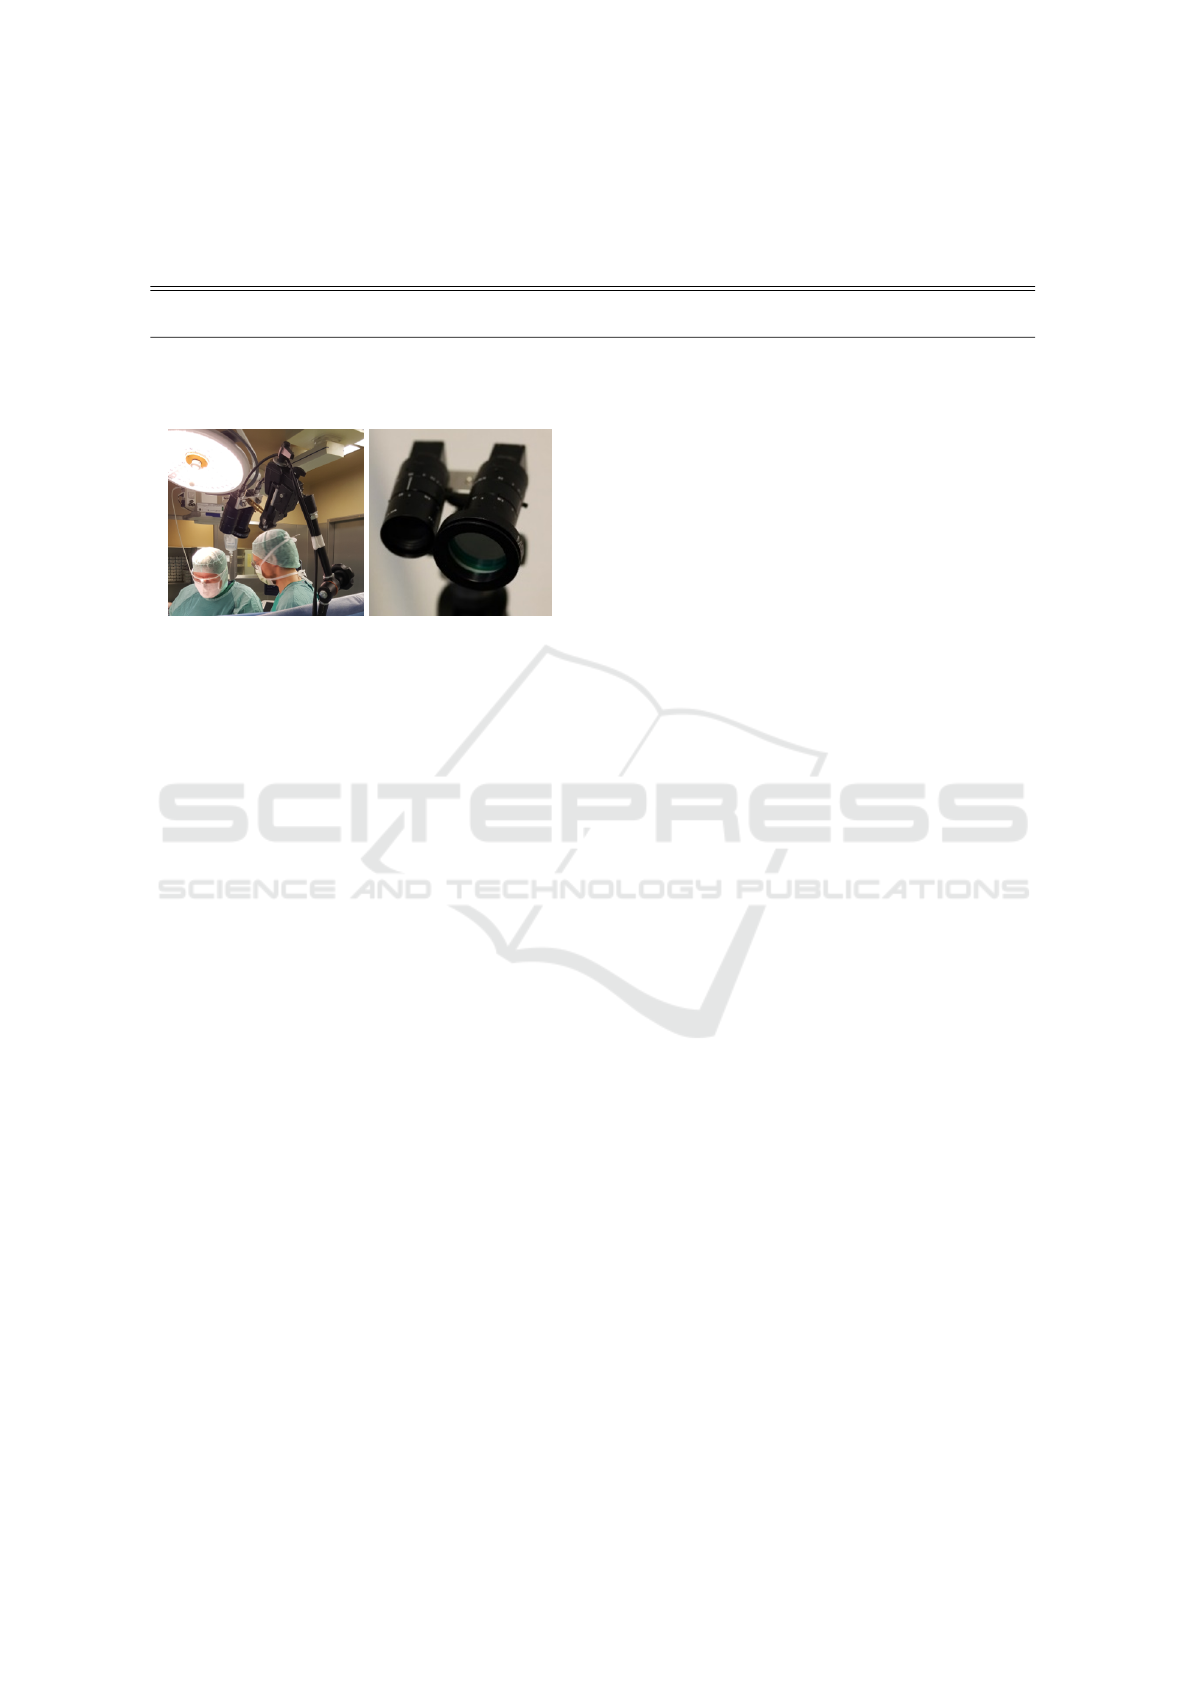
Table 1: The adapted and analyzed optical flow models for disparity calculation. The models are trained either only on
FlyingThings3D or on a mixture of FlyingThings3D and Sintel. The analysis in terms of end-point-error (EPE) is done on
Sintel and KITTI data.
Model Training EPE Sintel orig EPE Sintel proc EPE KITTI orig EPE KITTI proc
RAFT FlyingThings3D 7.87 8.05 5.65 5.55
DIP FlyingThings3D 9.34 10.90 8.84 9.74
RAFT mixed 3.01 3.66 1.67 2.83
DIP mixed 4.67 4.49 7.52 8.34
MS RAFT+ mixed 5.36 6.01 2.11 4.21
Figure 3: The stereo-HSI-setup. Left: the setup mounted
on a surgical retractor system in the operation room. Right:
detailed view of the stereo-cameras mounted on the rigid
trail.
sion. We captured intraoperative stereo data with two
different multispectral snapshot cameras (XIMEA
GmbH, Germany) mounted on a rigid trail, see Fig. 3.
The left camera is a 4×4-VIS camera covering the
spectral range from λ = 436 nm to λ = 650 nm
with 16 spectral bands and a sensor resolution of
1024×2048 pixels. The right camera is a 5×5-
NIR camera covering the spectral range from λ =
675 nm to λ = 975 nm with 25 spectral bands on
a 1080×2045 pixels sensor. Both sensors have a
pixel size of 5.5×5.5 µm and the cameras hold a
F2.8/75 mm optics (Ricoh, Japan) (M
¨
uhle et al.,
2021). The 5.5×5.5 camera includes a band-pass fil-
ter on top of the optics.
The distance between both cameras is a = 6 cm.
The cameras are rotated around the image plane for
about 10 degree. This allows to capture the same
scene using a working distant (WD) of about d =
25 −35 cm. Both cameras are frame-wise synchro-
nized.
To provide the full spectral information from λ =
400 −1000 nm for each point in the scene, the cap-
tured spectral data of both cameras have to be fused
into one consistent hyperspectral data cube. To allow
a correct processing on the fused spectral data, we ap-
ply a color correction to the raw data as desribed in .A
white reference image is acquired directly before or
after the actual capturing to correct the present illumi-
nation setting and achieve the reflectance information.
This is of high importance, especially for LED illumi-
nation, since a large difference in intensity exists be-
tween the individual recorded spectral bands (within
on camera as well as between both cameras).
After the demosaicing step, both images are
cropped to identical sizes of 1020×2000 pixels for
better image handling. Due to performance reasons,
we warped the 16 bands of the 4×4-camera and con-
catenated the 16 spectral points for all pixels having
disparity information at the beginning of the 25 bands
of the 5×5-camera to achieve 41 spectral bands per
pixel.
To demonstrate the feasibility of our approach,
we conducted two types of experiments. In the first
one, we acquired n = 25 images of the checkerboard
from different viewing angles and WD to perform
the spectral-stereoscopic calibration. Further, images
of a color chart (ColorChecker Classic, X-Rite Inc.)
have been acquired to allow comparison of the fused
spectra to ground truth information. For the sec-
ond experiment, we acquired medical data to show
the spectral data fusion working in sensitive applica-
tions as image-guided surgery. We captured stereo-
spectral images during two different types of surg-
eries: parotidectomy (ENT surgery), cf. Fig. 5 and
kidney transplantation, cf. Fig. 8. Both types of
surgery are performed as open surgeries. In these
cases, the surgeon usually does not use an optical de-
vice as microscope or endoscope. Only magnifying
glasses may be used at times to enlarge anatomical
structures.
For illumination, a halogen light source is used
for the calibration experiments. During surgery, the
present surgical light is used, which always compre-
hensively covers the interesting parts of the scene with
high brightness.
5 RESULTS
5.1 Network Selection
The evaluation of the three adapted networks are sum-
marized in Tab. 1 and showed the best performing
results for our adapted RAFT. In most of the cases,
the dataset without gray-scale modulation (orig) dur-
Multispectral Stereo-Image Fusion for 3D Hyperspectral Scene Reconstruction
93
ing RGB to gray-scale conversion shows better re-
sults in comparison to the data with modulation
(proc). However, for all training modalities (either
only on FlyingThings3D or a mixture of FlyingTh-
ings3D and MPI Sintel) RAFT performed best re-
gardless on which data we evaluated (MPI Sintel or
KITTI). Therefore, we selected RAFT for further us-
age.
5.2 Calibration
We performed the described calibration process ten
times on the acquired calibration images. In compar-
ison to the measured camera to camera distance of
a = 6 cm, we achieved a
calib
= 5.987 cm when we
averaged all spectral channels of each camera during
the performed calibrations. For individual channel
calibration, we achieved an distance up to a = 7.29
cm. In addition, the convergence angle θ between
the cameras is determined as θ = 3.5deg in the cal-
ibration with all channels averaged. For individual
channel calibration, we determined θ in the ranges of
θ = [6.96,11.24]deg. As mean stereo re-projection
error 1.50 px was achieved, cf. Fig. 4.
For the focal length f , we calculated
¯
f by aver-
aging all spectral channels of each camera resulting
in
¯
f
le f t
= 79.69 mm and
¯
f
right
= 78.52 mm. But for
narrow-band multi- and hyperspectral imaging, focal
length generally exhibits a distinct wavelength depen-
dence called chromatic aberration. Therefore, we an-
alyzed the focal length for each individual spectral
band. In that case, the focal lengths ranged between
f
le f t
= 81.23 mm to 88.60 mm and f
right
= 71.13 mm
to 78.08 mm.
5.3 Hyperspectral Fusion
The captured image data of the color chart and seven
surgeries in two different surgical fields have been an-
alyzed. It was possible to reconstruct a dense dispar-
ity map and fuse the spectral data for all cases. To
evaluate the quality of the fused spectral data, we an-
alyze the captured color chart images. For the case of
a plane color chart the disparity information are not of
large interest but the spectral reconstruction of the sin-
gle color tiles. These reconstructions were previously
analyzed in detail and could be reproduced (M
¨
uhle
et al., 2021; Wisotzky et al., 2020a).
The final hyperspectral data cube is always
smaller than the multispectral-stereo input images,
since the baseline of the stereo system leads to a
small scene shift as well as to occlusions in the two
multispectral-snapshot images. Therefore, the recti-
fied and warped image show empty image borders,
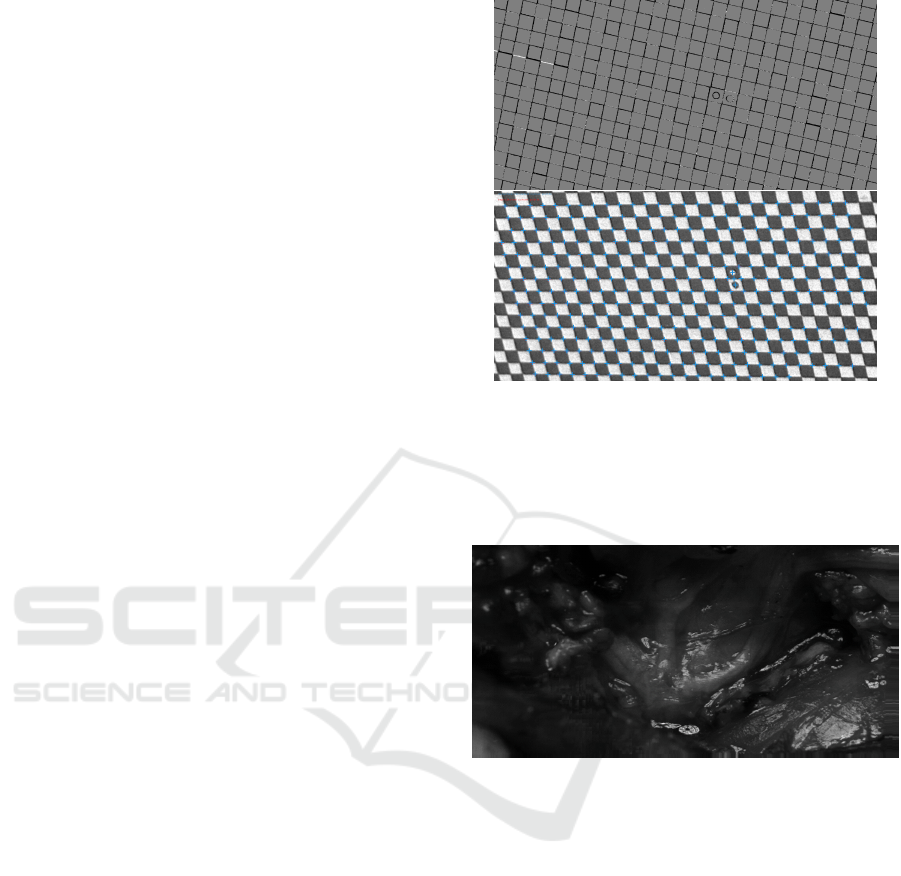
Figure 4: Calibration results. The top figure shows an ex-
ample of a difference image between the projected ground
truth checkerboard data and a captured left (4×4 mosaic
snapshot) camera view. The bottom figure shows an exam-
ple of the re-projected corner points of the checkerboard.
The detected corner points (blue) fit almost perfectly with
the re-projected corner points (red).
Figure 5: One spectral channel of the right 4×4 camera
view after warping into the other camera view. Due to the
warping, some areas at the image borders hold no data and
are repeated by neighboring pixels. To avoid this effect dur-
ing analysis, the final data cube is cropped.
cf. repeating pixel lines in Fig. 5 at the bottom and
right borders. The dense disparity map of this case is
presented in Fig. 6. Artifacts are visible in the spec-
ular highlights. In these cases, the correct distance
from the scene to the camera cannot be determined.
However, this is not of high relevance, since these re-
gions do not contain any usable spectral information
and are not usable for further analysis.
Using the calculated disparity map, the captured
spectral data can be taken pixel-wise from the 4×4-
camera and fused in front of the 5×5-camera data.
Thus, for each pixel having a valid disparity corre-
spondence a full reflectance spectrum from the cap-
tured scene can be calculated. Using this information,
a realistic RGB representation can be calculated and
VISAPP 2024 - 19th International Conference on Computer Vision Theory and Applications
94
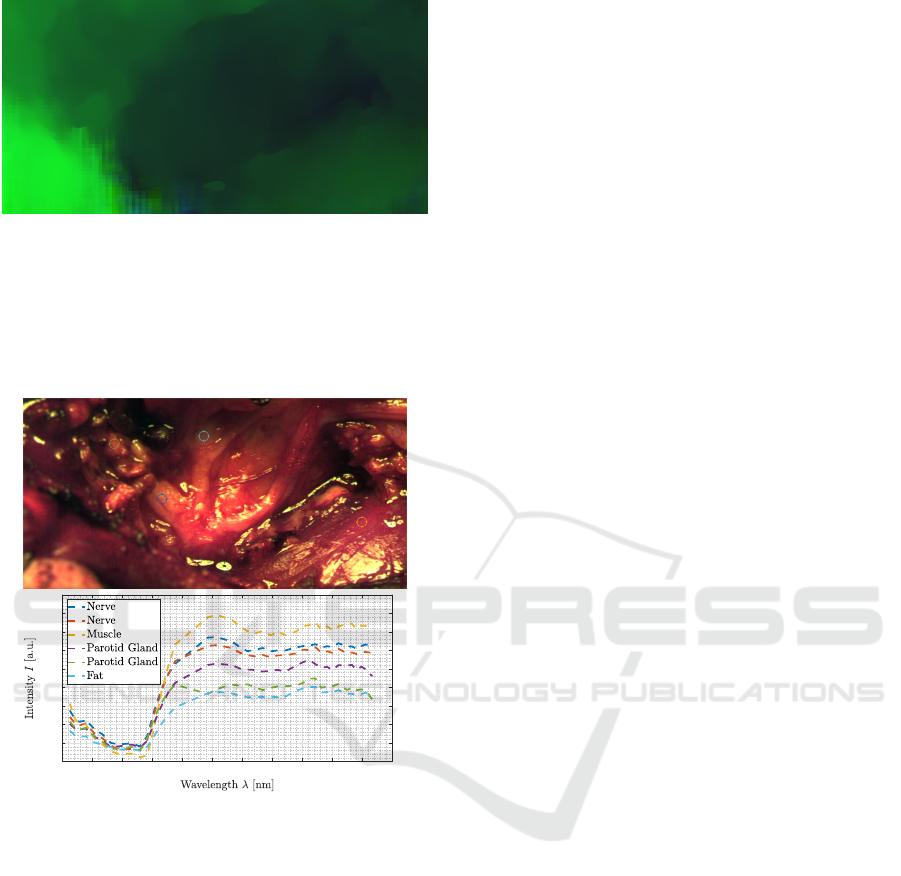
Figure 6: The disparity map of the case shown in Fig. 5.
Dark pixels refer to regions far away from the camera and
bright pixels refer to regions closer to the camera. The white
area on the left holds no information due to the stereoscopic
baseline shift. In addition, due to the baseline shift and
missing information, there is also an incorrect prediction
of a region distant from the camera system (red pixels) that
is actually close to the camera system.
450 500 550 600 650 700 750 800 850 900 950 1000
0
0.05
0.1
0.15
0.2
0.25
0.3
0.35
0.4
0.45
Figure 7: Due to the fusion of the spectral information into
one camera view, a realistic RGB representation can be cal-
culated (top view). Further for all regions with disparity
information, the spectral information in the VIS-NIR range
can be extracted, cf. colored circular ROIs in the top view
and spectral plots in the bottom view.
the object spectra in the full range of λ = 400 to 1000
nm can be used for analysis.
The resulted reflectance spectra of one surgical
scenes (parotidectomy) are presented in Fig. 7. In
this example, six regions showing four different tis-
sue types are selected and the according spectra plot-
ted. Identical tissue types, regardless of the image re-
gion and camera-surface distance at which they were
located, result in a similar spectral reflectance spec-
tra, while the spectra of different tissue types show
clear differences in their reflectance behavior. All re-
constructed spectral tissue curves are in accordance
to reported spectral tissue behavior (Ebner et al.,
2021; M
¨
uhle et al., 2021; Studier-Fischer et al., 2022;
Bashkatov et al., 2005).
In Fig. 8 all results of another surgical use-case
(kidney transplantation) are presented. The top left
shows a spectral band of the demosaicked left view.
The calculated depth map (top right in Fig. 8) is dense
and matches the visual appearance of the scene (red
pixel are close to the camera and blue pixel are far
away). Only at the left edge and next to the liver hook
(white region at the bottom center of the scene) no
depth information can be extracted due to the stereo-
scopic occlusions. For a part of the liver hook, the
depth information could not be reconstructed cor-
rectly due to the occurring of total reflection in one of
the stereoscopic views. However, the overall data fu-
sion and spectral reconstruction works well as shown
for two different spectral bands in the bottom row of
Fig. 8.
6 CONCLUSIONS
In this work, we present an image/spectral fusion
method for stereoscopic multispectral snapshot im-
ages covering entirly different spectral ranges. This
allows a continuous capturing and processing of in-
traoperative images to achieve a hyperspectral data
cube. The hyperspectral data cube shows high spatial
resolution with about 2000×1000 pixels and a good
spectral resolution with 41 spectral bands in the inter-
val of λ = 400 −1000 nm. This spectral resolution
with the present sampling is sufficient to reconstruct
a spectrum in the VIS-NIR region for robust analy-
ses, which is comparable to spectra extracted from
other hyperspectral cameras (M
¨
uhle et al., 2021). Fur-
thermore, our system combines advantages of differ-
ent HSI and MSI systems from the literature with-
out showing their disadvantages (Ebner et al., 2021;
Clancy et al., 2021; Clancy et al., 2020). A problem
that quickly arises is when the objects to be analyzed
are not visible in both images due to their spectral
properties. Then it is difficult to register both images
and fuse the spectra. This would inevitably lead to
worse results, but could certainly be solved with com-
plex and controlled illumination solutions. However,
this problem is not likely to occur in the application
area of image-enhanced surgery addressed here.
In addition, the system allows continuous captur-
ing and reconstruction of the 3D surface texture, e.g.,
the situs in intraoperative imaging, which thus creates
a significant value increase. This makes it possible
to continuously monitor the present objects and their
spectral behavior over time. For example, for image-
guided surgery anatomical structures and physiolog-
Multispectral Stereo-Image Fusion for 3D Hyperspectral Scene Reconstruction
95
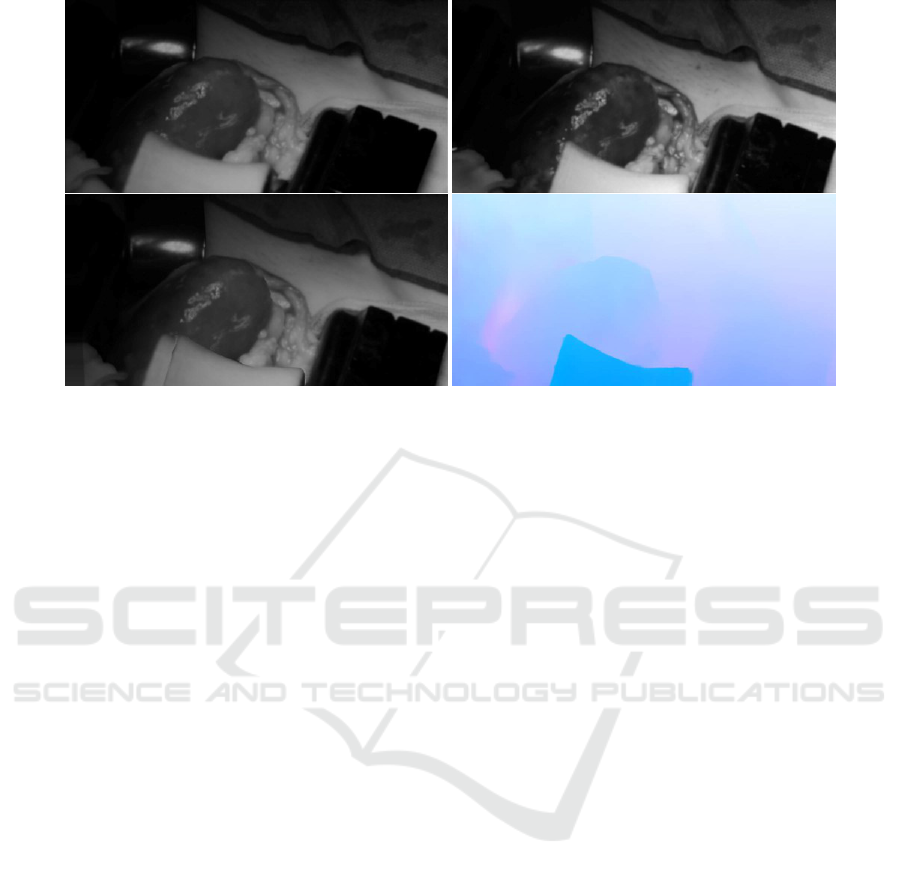
Figure 8: The final data fusion of data captured during kidney transplantation. Top left: one spectral channel of left camera
view, demosaicked. Top right: one spectral channel of right camera view, demosaicked. Bottom left: the top left view (left
camera) warped into right camera view. Bottom right: Flow field/disparity map of scene, blue color corresponds to small
camera-object distance and red is larger camera-object distance.
ical changes can be analyzed at the same time dur-
ing the entire procedure, if necessary. Further, it is
possible to measure the object sizes or register these
precisely to other image data, e.g., preoperative CT.
Thus for the clinical application, the surgeon can be
comprehensively provided with objective data. Other
comparable systems only allowed to reconstruct few
spectral bands and/or 3D surface, and were not real-
time capable (Lu and Fei, 2014; Wisotzky et al.,
2020b). Our system can continuously capture and
process data with low latency showing the potential
of real-time analysis as the pipeline is only partially
implemented for GPU usage.
ACKNOWLEDGMENTS
This work was funded by the German BMBF under
Grant No. 16SV8602 (KIPos) and by the German
BMWK under Grant No. 01MT20001D (Gemimeg
II). The authors state no conflict of interest. Informed
consent has been obtained from all individuals in-
cluded in this study. The research related to human
use complies with all the relevant national regula-
tions, institutional policies and was performed in ac-
cordance with the tenets of the Helsinki Declaration,
and has been approved by the Charit
´
e ethics board.
REFERENCES
Arad, B. and Ben-Shahar, O. (2016). Sparse recovery
of hyperspectral signal from natural rgb images. In
Computer Vision–ECCV 2016: 14th European Con-
ference, Amsterdam, The Netherlands, October 11–
14, 2016, Proceedings, Part VII 14, pages 19–34.
Springer.
Arad, B., Timofte, R., Ben-Shahar, O., Lin, Y.-T., and Fin-
layson, G. D. (2020). Ntire 2020 challenge on spectral
reconstruction from an rgb image. In Proceedings of
the IEEE/CVF Conference on Computer Vision and
Pattern Recognition (CVPR) Workshops.
Arad, B., Timofte, R., Yahel, R., Morag, N., Bernat, A.,
Cai, Y., Lin, J., Lin, Z., Wang, H., Zhang, Y., Pfis-
ter, H., Van Gool, L., Liu, S., Li, Y., Feng, C., Lei,
L., Li, J., Du, S., Wu, C., Leng, Y., Song, R., Zhang,
M., Song, C., Zhao, S., Lang, Z., Wei, W., Zhang, L.,
Dian, R., Shan, T., Guo, A., Feng, C., Liu, J., Agarla,
M., Bianco, S., Buzzelli, M., Celona, L., Schettini,
R., He, J., Xiao, Y., Xiao, J., Yuan, Q., Li, J., Zhang,
L., Kwon, T., Ryu, D., Bae, H., Yang, H.-H., Chang,
H.-E., Huang, Z.-K., Chen, W.-T., Kuo, S.-Y., Chen,
J., Li, H., Liu, S., Sabarinathan, S., Uma, K., Bama,
B. S., and Roomi, S. M. M. (2022a). Ntire 2022
spectral recovery challenge and data set. In 2022
IEEE/CVF Conference on Computer Vision and Pat-
tern Recognition Workshops (CVPRW), pages 862–
880.
Arad, B., Timofte, R., Yahel, R., Morag, N., Bernat, A.,
Wu, Y., Wu, X., Fan, Z., Xia, C., Zhang, F., Liu, S.,
Li, Y., Feng, C., Lei, L., Zhang, M., Feng, K., Zhang,
X., Yao, J., Zhao, Y., Ma, S., He, F., Dong, Y., Yu, S.,
Qiu, D., Liu, J., Bi, M., Song, B., Sun, W., Zheng, J.,
Zhao, B., Cao, Y., Yang, J., Cao, Y., Kong, X., Yu, J.,
Xue, Y., and Xie, Z. (2022b). Ntire 2022 spectral de-
VISAPP 2024 - 19th International Conference on Computer Vision Theory and Applications
96

mosaicing challenge and data set. In 2022 IEEE/CVF
Conference on Computer Vision and Pattern Recogni-
tion Workshops (CVPRW), pages 881–895.
Bashkatov, A., Genina, E., Kochubey, V., and Tuchin, V.
(2005). Optical properties of the subcutaneous adi-
pose tissue in the spectral range 400–2500 nm. Optics
and spectroscopy, 99:836–842.
Bayer, B. (1976). Color imaging array us patent 3 971 065.
Biancolillo, A., Bucci, R., Magr
`
ı, A. L., Magr
`
ı, A. D., and
Marini, F. (2014). Data-fusion for multiplatform char-
acterization of an italian craft beer aimed at its authen-
tication. Analytica chimica acta, 820:23–31.
Borr
`
as, E., Ferr
´
e, J., Boqu
´
e, R., Mestres, M., Ace
˜
na, L., and
Busto, O. (2015). Data fusion methodologies for food
and beverage authentication and quality assessment–a
review. Analytica Chimica Acta, 891:1–14.
Bradbury, G., Mitchell, K., and Weyrich, T. (2013). Multi-
spectral material classification in landscape scenes us-
ing commodity hardware. In Computer Analysis of
Images and Patterns: 15th International Conference,
CAIP 2013, York, UK, August 27-29, 2013, Proceed-
ings, Part II 15, pages 209–216. Springer.
Brauers, J. and Aach, T. (2006). A color filter array based
multispectral camera. In 12. Workshop Farbbildverar-
beitung, pages 5–6. Ilmenau.
Butler, D. J., Wulff, J., Stanley, G. B., and Black, M. J.
(2012). A naturalistic open source movie for optical
flow evaluation. In A. Fitzgibbon et al. (Eds.), editor,
European Conf. on Computer Vision (ECCV), Part IV,
LNCS 7577, pages 611–625. Springer-Verlag.
Clancy, N. T., Jones, G., Maier-Hein, L., Elson, D. S., and
Stoyanov, D. (2020). Surgical spectral imaging. Med-
ical image analysis, 63:101699.
Clancy, N. T., Soares, A. S., Bano, S., Lovat, L. B.,
Chand, M., and Stoyanov, D. (2021). Intraoperative
colon perfusion assessment using multispectral imag-
ing. Biomedical Optics Express, 12(12):7556–7567.
Dong, J., Zhuang, D., Huang, Y., and Fu, J. (2009). Ad-
vances in multi-sensor data fusion: Algorithms and
applications. Sensors, 9(10):7771–7784.
Ebner, M., Nabavi, E., Shapey, J., Xie, Y., Liebmann, F.,
Spirig, J. M., Hoch, A., Farshad, M., Saeed, S. R.,
Bradford, R., et al. (2021). Intraoperative hyperspec-
tral label-free imaging: from system design to first-
in-patient translation. Journal of Physics D: Applied
Physics, 54(29):294003.
Eisert, P. (2002). Model-based camera calibration using
analysis by synthesis techniques. In VMV, pages 307–
314.
Forshed, J., Idborg, H., and Jacobsson, S. P. (2007). Eval-
uation of different techniques for data fusion of lc/ms
and 1h-nmr. Chemometrics and Intelligent Labora-
tory Systems, 85(1):102–109.
Genser, N., Seiler, J., and Kaup, A. (2020). Camera array
for multi-spectral imaging. IEEE Transactions on Im-
age Processing, 29:9234–9249.
G
¨
ob, S., G
¨
otz, T. I., and Wittenberg, T. (2021). Multispec-
tral single chip reconstruction using dnns with appli-
cation to open neurosurgery. Current Directions in
Biomedical Engineering, 7(2):37–40.
Guo, H., Bao, W., Qu, K., Ma, X., and Cao, M. (2022).
Multispectral and hyperspectral image fusion based
on regularized coupled non-negative block-term ten-
sor decomposition. Remote Sensing, 14(21):5306.
Hershey, J. and Zhang, Z. (2008). Multispectral digital
camera employing both visible light and non-visible
light sensing on a single image sensor. US Patent
7,460,160.
Hollstein, F., Cacho,
´
I., Arnaiz, S., and Wohllebe, M.
(2016). Challenges in automatic sorting of construc-
tion and demolition waste by hyperspectral imaging.
In Advanced Environmental, Chemical, and Biolog-
ical Sensing Technologies XIII, volume 9862, pages
73–82. SPIE.
Jahedi, A., Luz, M., Mehl, L., Rivinius, M., and Bruhn, A.
(2022). High resolution multi-scale raft (robust vision
challenge 2022). arXiv preprint arXiv:2210.16900.
Jung, A., Kardev
´
an, P., and T
˝
okei, L. (2006). Hyperspectral
technology in vegetation analysis. Progress in Agri-
cultural Engineering Sciences, 2(1):95–117.
Klein, J., Larsson, S., Brunnmeier, V., Nestler, R., Franke,
K., Hill, B., and Merhof, D. (2014). Stereo acqui-
sition with a filter wheel multispectral camera on a
goniometric measuring setup. In 20. Workshop Farb-
bildverarbeitung, pages 89–96. Zentrum f
¨
ur Bild- und
Signalverarbeitung e.V.
Lapray, P.-J., Wang, X., Thomas, J.-B., and Gouton,
P. (2014). Multispectral filter arrays: Recent
advances and practical implementation. Sensors,
14(11):21626–21659.
Lu, G. and Fei, B. (2014). Medical hyperspectral imaging:
a review. Journal of biomedical optics, 19(1):010901–
010901.
MacCormac, O., Noonan, P., Janatka, M., Horgan, C. C.,
Bahl, A., Qiu, J., Elliot, M., Trotouin, T., Jacobs, J.,
Patel, S., et al. (2023). Lightfield hyperspectral imag-
ing in neuro-oncology surgery: an ideal 0 and 1 study.
Frontiers in Neuroscience, 17.
M
˚
age, I., Mevik, B.-H., and Næs, T. (2008). Regres-
sion models with process variables and parallel blocks
of raw material measurements. Journal of Chemo-
metrics: A Journal of the Chemometrics Society,
22(8):443–456.
Manakov, A., Restrepo, J., Klehm, O., Hegedus, R., Eise-
mann, E., Seidel, H.-P., and Ihrke, I. (2013). A recon-
figurable camera add-on for high dynamic range, mul-
tispectral, polarization, and light-field imaging. ACM
Transactions on Graphics, 32(4):47–1.
Mayer, N., Ilg, E., Hausser, P., Fischer, P., Cremers, D.,
Dosovitskiy, A., and Brox, T. (2016). A large dataset
to train convolutional networks for disparity, optical
flow, and scene flow estimation. In Proceedings of
the IEEE conference on computer vision and pattern
recognition, pages 4040–4048.
Menze, M. and Geiger, A. (2015). Object scene flow for
autonomous vehicles. In Conference on Computer Vi-
sion and Pattern Recognition (CVPR).
Mihoubi, S., Losson, O., Mathon, B., and Macaire, L.
(2017). Multispectral Demosaicing Using Pseudo-
Multispectral Stereo-Image Fusion for 3D Hyperspectral Scene Reconstruction
97

Panchromatic Image. IEEE Transactions on Compu-
tational Imaging, 3(4):982–995.
Moghadam, P., Ward, D., Goan, E., Jayawardena, S., Sikka,
P., and Hernandez, E. (2017). Plant disease detection
using hyperspectral imaging. In 2017 International
Conference on Digital Image Computing: Techniques
and Applications (DICTA), pages 1–8. IEEE.
M
¨
uhle, R., Markgraf, W., Hilsmann, A., Malberg, H., Eis-
ert, P., and Wisotzky, E. L. (2021). Comparison
of different spectral cameras for image-guided or-
gan transplantation. Journal of Biomedical Optics,
26(7):076007.
Oiknine, Y., Arad, B., August, I., Ben-Shahar, O., and
Stern, A. (2018). Dictionary based hyperspectral im-
age reconstruction captured with cs-musi. In 2018 9th
Workshop on Hyperspectral Image and Signal Pro-
cessing: Evolution in Remote Sensing (WHISPERS),
pages 1–5. IEEE.
Pohl, C. and Van Genderen, J. L. (1998). Multisensor im-
age fusion in remote sensing: concepts, methods and
applications. International journal of remote sensing,
19(5):823–854.
Qin, J. and Lu, R. (2008). Measurement of the optical prop-
erties of fruits and vegetables using spatially resolved
hyperspectral diffuse reflectance imaging technique.
Postharvest Biology and Technology, 49(3):355–365.
Rosenthal, J., Gard, N., Schneider, A., and Eisert, P. (2017).
Kalibrierung stereoskopischer systeme f
¨
ur medizinis-
che messaufgaben. In Proceedings of the 16th Annual
Conference of the German Society for Computer and
Robotic Assisted Surgery (CURAC, pages 161–163.
Sattar, S., Lapray, P.-J., Aksas, L., Foulonneau, A., and
Bigu
´
e, L. (2022). Snapshot spectropolarimetric imag-
ing using a pair of filter array cameras. Optical Engi-
neering, 61(4):043104–043104.
Shafri, H. Z., Taherzadeh, E., Mansor, S., and Ashurov, R.
(2012). Hyperspectral remote sensing of urban areas:
an overview of techniques and applications. Research
Journal of Applied Sciences, Engineering and Tech-
nology, 4(11):1557–1565.
Shapey, J., Xie, Y., Nabavi, E., Bradford, R., Saeed, S. R.,
Ourselin, S., and Vercauteren, T. (2019). Intraoper-
ative multispectral and hyperspectral label-free imag-
ing: A systematic review of in vivo clinical studies.
Journal of biophotonics, 12(9):e201800455.
Shrestha, R., Hardeberg, J. Y., and Mansouri, A. (2011).
One-shot multispectral color imaging with a stereo
camera. In Digital Photography VII, volume 7876,
pages 82–92. SPIE.
Studier-Fischer, A., Seidlitz, S., Sellner, J.,
¨
Ozdemir, B.,
Wiesenfarth, M., Ayala, L., Odenthal, J., Kn
¨
odler, S.,
Kowalewski, K. F., Haney, C. M., et al. (2022). Spec-
tral organ fingerprints for machine learning-based in-
traoperative tissue classification with hyperspectral
imaging in a porcine model. Scientific Reports,
12(1):11028.
Tanriverdi, F., Schuldt, D., and Thiem, J. (2019). Dual snap-
shot hyperspectral imaging system for 41-band spec-
tral analysis and stereo reconstruction. In Advances in
Visual Computing, pages 3–13, Cham. Springer Inter-
national Publishing.
Teed, Z. and Deng, J. (2020). Raft: Recurrent all-pairs
field transforms for optical flow. In Computer Vision–
ECCV 2020: 16th European Conference, Glasgow,
UK, August 23–28, 2020, Proceedings, Part II 16,
pages 402–419. Springer.
Wang, Y., Cao, R., Guan, Y., Liu, T., and Yu, Z. (2021).
A deep survey in the applications of demosaick-
ing. In 2021 3rd International Academic Exchange
Conference on Science and Technology Innovation
(IAECST), pages 596–602. IEEE.
Wisotzky, E. L., Daudkane, C., Hilsmann, A., and Eisert, P.
(2022). Hyperspectral demosaicing of snapshot cam-
era images using deep learning. In Pattern Recogni-
tion: 44th DAGM German Conference, DAGM GCPR
2022, Konstanz, Germany, September 27–30, 2022,
Proceedings, pages 198–212. Springer.
Wisotzky, E. L., Eisert, P., and Hilsmann, A. (2023a). 3d
hyperspectral light-field imaging: a first intraopera-
tive implementation. Current Directions in Biomed-
ical Engineering, 9(1):611–614.
Wisotzky, E. L., Kossack, B., Uecker, F. C., Arens, P.,
Hilsmann, A., and Eisert, P. (2020a). Validation of
two techniques for intraoperative hyperspectral hu-
man tissue determination. Journal of Medical Imag-
ing, 7(6):065001.
Wisotzky, E. L., Rosenthal, J.-C., Eisert, P., Hilsmann, A.,
Schmid, F., Bauer, M., Schneider, A., and Uecker,
F. C. (2019). Interactive and multimodal-based aug-
mented reality for remote assistance using a digital
surgical microscope. In 2019 IEEE Conference on
Virtual Reality and 3D User Interfaces (VR), pages
1477–1484. IEEE.
Wisotzky, E. L., Rosenthal, J.-C., Meij, S., van den Dob-
blesteen, J., Arens, P., Hilsmann, A., Eisert, P.,
Uecker, F. C., and Schneider, A. (2023b). Telep-
resence for surgical assistance and training using
extended reality during and after pandemic peri-
ods. Journal of Telemedicine and Telecare, page
1357633X231166226.
Wisotzky, E. L., Rosenthal, J.-C., Wege, U., Hilsmann, A.,
Eisert, P., and Uecker, F. C. (2020b). Surgical guid-
ance for removal of cholesteatoma using a multispec-
tral 3d-endoscope. Sensors, 20(18):5334.
Wisotzky, E. L., Triller, J., Kossack, B., Globke, B., Arens,
P., Hilsmann, A., and Eisert, P. (2023c). From
multispectral-stereo to intraoperative hyperspectral
imaging: a feasibility study. Current Directions in
Biomedical Engineering, 9(1):311–314.
Wisotzky, E. L., Uecker, F. C., Arens, P., Dommerich, S.,
Hilsmann, A., and Eisert, P. (2018). Intraoperative hy-
perspectral determination of human tissue properties.
Journal of biomedical optics, 23(9):091409.
Yuen, P. W. and Richardson, M. (2010). An introduction
to hyperspectral imaging and its application for secu-
rity, surveillance and target acquisition. The Imaging
Science Journal, 58(5):241–253.
Zhang, J. (2010). Multi-source remote sensing data fusion:
status and trends. International Journal of Image and
Data Fusion, 1(1):5–24.
Zheng, Z., Nie, N., Ling, Z., Xiong, P., Liu, J., Wang, H.,
and Li, J. (2022). Dip: Deep inverse patchmatch for
VISAPP 2024 - 19th International Conference on Computer Vision Theory and Applications
98

high-resolution optical flow. In Proceedings of the
IEEE/CVF Conference on Computer Vision and Pat-
tern Recognition, pages 8925–8934.
Zia, A., Liang, J., Zhou, J., and Gao, Y. (2015). 3d recon-
struction from hyperspectral images. In IEEE winter
conference on applications of computer vision, pages
318–325. IEEE.
Multispectral Stereo-Image Fusion for 3D Hyperspectral Scene Reconstruction
99
