
Prediction of Oxygen Saturation from Graphene Respiratory Signals
with PPG Trained DNN
Bojana Koteska
1 a
, Ana Madevska Bogdanova
1 b
, Teodora Vi
´
centi
´
c
2 c
, Stefan D. Ili
´
c
2 d
,
Miona Tomi
´
c
3 e
and Marko Spasenovi
´
c
2 f
1
Faculty of Computer Science and Engineering (FCSE), ”Ss. Cyril and Methodius” University, Skopje, North Macedonia
2
Center for Microelectronic Technologies, Institute of Chemistry, Technology and Metallurgy,
National Institute of the Republic of Serbia, University of Belgrade, 11001 Belgrade, Serbia
3
School of Electrical Engineering, University of Belgrade, 11000 Belgrade, Serbia
fi
Keywords:
Oxygen Saturation, Graphene, PPG, Deep Learning Model.
Abstract:
This paper explores the feasibility of using wearable laser-induced graphene (LIG) sensors to estimate oxygen
saturation (SpO2) as an alternative to traditional photoplethysmography (PPG) oximeters, particularly in mass
casualty triage scenarios. Positioned on the chest, the LIG sensor continuously monitors respiratory signals in
real-time. The study leverages deep neural network (DNN) trained on PPG signals to process LIG respiratory
signals, revealing promising results. Key performance metrics include a mean squared error (MSE) of 0.152,
a mean absolute error (MAE) of 1.13, a root mean square error (RMSE) of 1.23, and an R
2
score of 0.68. This
innovative approach, combining PPG and respiratory signals from graphene, offers a potential solution for 2D
sensors in emergency situations, enhancing the monitoring and management of various medical conditions.
However, further investigation is required to establish the clinical applications and correlations between these
signals. This study marks a significant step toward advancing wearable sensor technology for critical health-
care scenarios.
1 INTRODUCTION
The real-time monitoring of health promises a fun-
damental transformation in preventing and managing
diseases. This impact is especially important in triage
scenarios involving a large number of casualties, as
it prioritizes the most severely injured individuals by
quick identification, using START-like triage systems
(Benson et al., 1996). Notably, the capacity to contin-
uously monitor essential indicators like heart rate, res-
piration, blood oxygen saturation (SpO2), and blood
pressure in real time can be a lifesaver in critical sit-
uations. Detecting abnormalities in these parameters
in a timely manner offers an early alert for potential
medical emergencies, allowing healthcare practition-
a
https://orcid.org/0000-0001-6118-9044
b
https://orcid.org/0000-0002-0906-3548
c
https://orcid.org/0000-0002-3460-6137
d
https://orcid.org/0000-0002-1721-9039
e
https://orcid.org/0009-0001-4233-0249
f
https://orcid.org/0000-0002-2173-0972
ers to respond swiftly (Na et al., 2021).
In the triage process, the initial assessment of
patients to determine their health status and priori-
tize treatment based on the severity of their condi-
tion (Benson et al., 1996), the measurement of SpO2
holds a crucial role. The primary objective of as-
sessing this vital parameter is to identify individu-
als who are experiencing severe respiratory distress
or shock - patients in shock exhibit low SpO2 lev-
els. The conventional method for measuring SpO2
involves the use of a PPG sensor, which analyzes
the light absorption characteristics of oxygenated and
deoxygenated hemoglobin. Nevertheless, there are
certain limitations associated with PPG-based SpO2
measurements. One drawback is that the accuracy of
PPG-based SpO2 measurements may not match those
obtained from arterial blood gas analysis or pulse
oximetry using dedicated sensors (Castaneda et al.,
2018).
In this paper, we are investigating the idea of using
wearable mechanical deflection sensors for SpO2 es-
timation as an alternative for oximeters with PPG sig-
Koteska, B., Bogdanova, A., Vi
´
centi
´
c, T., Ili
´
c, S., Tomi
´
c, M. and Spasenovi
´
c, M.
Prediction of Oxygen Saturation from Graphene Respiratory Signals with PPG Trained DNN.
DOI: 10.5220/0012354100003657
Paper published under CC license (CC BY-NC-ND 4.0)
In Proceedings of the 17th International Joint Conference on Biomedical Engineering Systems and Technologies (BIOSTEC 2024) - Volume 1, pages 739-746
ISBN: 978-989-758-688-0; ISSN: 2184-4305
Proceedings Copyright © 2024 by SCITEPRESS – Science and Technology Publications, Lda.
739

nals, as a part of integrated wearable patch-like sen-
sors (Koteska et al., 2022).
There are numerous sensors that can monitor vi-
tal parameters in real-time, including electrocardio-
gram (ECG) sensors for monitoring heart rate, oxime-
ters for monitoring SpO2, and blood pressure sen-
sors for measuring blood pressure (Dias and Paulo
Silva Cunha, 2018; Majumder et al., 2017). These
sensors can be integrated into wearable devices, al-
lowing for continuous monitoring of vital parameters
outside of traditional clinical settings.
Wearable mechanical deflection sensors measure
changes in mechanical deflection, such as chest or
abdominal movements, to estimate respiration rate
and volume. These sensors are non-invasive and can
be easily integrated into wearable devices such as
belts or patches, making them suitable for continu-
ous monitoring of respiratory parameters, as well as
other vital parameters (Vi
´
centi
´
c et al., 2022). Laser-
induced graphene (LIG), an emerging material re-
cently used in mechanical deflection sensors, is an ex-
cellent candidate for wearable respiration monitoring
(Song et al., 2023; Chen et al., 2019). LIG is a type
of graphene that is created by irradiating a polymer or
other organic material with a laser. The laser energy
causes the material to carbonize and transform into a
graphene-like structure. LIG is a flexible piezoelec-
tric material, meaning that the electrical resistance of
the material changes when it is bent. Hence, electri-
cal signal from LIG is directly related to mechanical
deflection, a property that can be utilized to measure
motion of the human body and its parts.
In the work of Vi
´
centi
´
c et al., (Vi
´
centi
´
c et al.,
2022), it was established a correlation between the
LIG signals and the heart rate (among other parame-
ters) using the HeartPy toolkit implemented in Python
(Van Gent et al., 2019).
Our current research aims to explore an additional
application of LIG signals as a potential simulation
for PPG signals, by extracting the features from LIG
signals derived from HeartPy as an input in the deep
neural network (DNN) model trained on PPG sig-
nals, to estimate oxygen saturation (SpO2). While
PPG signals and LIG signals are not directly cor-
related, there is a potential to combine these tech-
nologies for novel biosensing applications, since there
is a relationship between the magnitude of respi-
ratory peaks and the oxygen concentration (Rasch-
Halvorsen et al., 2019). As of our knowledge, there
aren’t any recently published studies that have specifi-
cally investigated the use of LIG in biosensors for de-
tecting photoplethysmography (PPG) signals. Lean-
ing towards the implementation of the LIG as a 2-D
sensor, we decided to explore its ability to serve as an
SpO2 estimator, using an ANN model built on PPG
signals.
The paper is organized as follows. Section 2 de-
scribes the production of the graphene sensor respi-
ration monitoring process. It also describes the train-
ing and testing databases and the used DNN model
for SpO2 estimation. Section 3 elaborates on the ob-
tained results and model evaluation metrics. The fi-
nal section 4 presents concluding remarks and future
work.
2 MATERIALS AND METHODS
2.1 Graphene Sensor Production
LIG was produced by scanning a CO2 laser beam
across the surface of polyimide tape, as in (Wang
et al., 2020). The utilized laser DBK FL-350 had a
maximum power of 60 W, with power set to 18%,
a scanning speed of 400 mm/s, and a resolution of
800 DPI. The devices were formed by laser-writing
LIG in the shape of rectangles with dimensions 1 X
3 cm. The graphene was transferred to double-sided
adhesive medical tape (Duplomed 8411, Lohmann,
GmbH, Neuwied, Germany). To establish electrical
connections with the LIG, conductive copper tapes
were affixed to the device’s ends. Copper tapes
were then soldered to wires, which were subsequently
linked to the measuring device. The sensor was se-
curely adhered to the body at seven distinct locations,
as illustrated in Figure 1.
Figure 1: Positions on the body where the sensor was af-
fixed.
The wires from the LIG sensor were connected to
a Keithley 2450 SMU, which was interfaced with a
desktop computer.
BIOSIGNALS 2024 - 17th International Conference on Bio-inspired Systems and Signal Processing
740
2.2 Respiration Monitoring
Three healthy subjects, comprising one male and two
females aged between 20 and 30 years, were included
in the measurement of LIG respiration signals, as
our primal interest is triaging healthy injured victims
of mass victim incidents. As mentioned in Subsec-
tion 2.1, the LIG sensor was attached in one of the
seven different locations during the rested position
(1). We also considered the technique of holding the
breath, to obtain the values of critical SpO2 domain
(SPO2<95%) (Chan et al., 2021; Parkes, 2006).
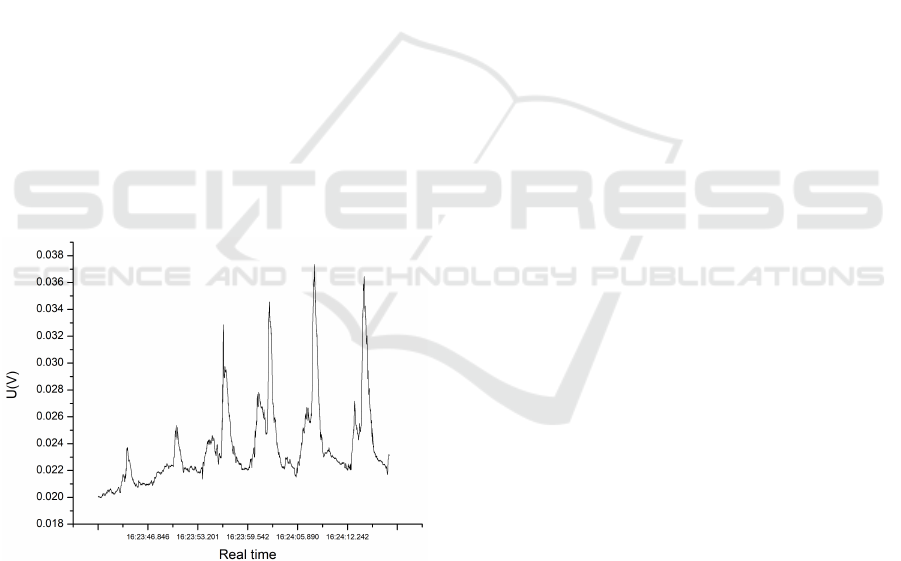
For measurements when the SpO2 was lowered
below 95%, the subjects held their breath for 30 sec-
onds, resuming breathing after that, as in Figure 2.
The first 30 seconds of breathing after holding breath
were recorded. As a reference, SpO2 was measured
with the Onyx II oximeter (Nonin Medical, Plymouth,
MN, USA).
The measurements were performed in a constant
current mode, where a current of 0.1 mA was main-
tained, and the voltage was recorded for a duration
of 30 seconds, as a volunteer subject sat in a chair
and breathed normally. The measaruments were re-
peated order to ensure the reliability and consistency
of the collected data, thereby enhancing the robust-
ness of our findings. The voltage variation in time as
breathing is monitored is shown in Figure 2.
Figure 2: Voltage variation in time, as breathing is moni-
tored with the LIG sensor.
The experimental steps starting from LIG sen-
sor creation to the respiration signal processing, are
shown in Figure 3.
2.3 Training Dataset
The research utilized the BIDMC PPG and Respira-
tion Dataset, which can be accessed at the follow-
ing URL: https://physionet.org/content/bidmc/1.0.0/.
This dataset was collected from 53 critically ill pa-
tients receiving treatment at the Beth Israel Deaconess
Medical Centre in Boston, MA, USA. It comprises
signals and numerical data extracted from a subset of
the widely recognized Physionet’s MIMIC II Wave-
form Database. The dataset includes physiological
parameters from adult patients aged 19 to 90. Specif-
ically, the ECG, PPG, and impedance pneumography
signals are 8 minutes in duration and sampled at a
rate of 125 Hz. Additionally, the heart rate, respi-
ratory rate, and blood oxygen saturation level (SpO2)
are sampled at 1 Hz.
Most of the patients in the BIDMC database have
normal oxygen saturation (>= 95). The SpO2 values
for each patient are shown in Figure 4.
The data was acquired in Python pickle format us-
ing the wfdb.rdsamp method from the native Python
waveform-database (WFDB) software package and
was saved to local storage. For further details, you
can refer to the following link: https://github.com/
MIT-LCP/wfdb-python.
To predict SpO2 from shorter signals we needed
to train the model on shorter PPG segments. The 8-
minute PPG signals from the BIDMC database were
split into 10-second segments, given that some com-
mercial SpO2 sensors provide SpO2 readings at ap-
proximately 10-second intervals (as mentioned in the
study (Shao et al., 2015)).
To create a dataset with PPG signals of 10-second
duration, the following steps were taken. For every
patient in the original BIDMC database, the PPG sig-
nal comprises 60001 individual samples, accompa-
nied by 480 corresponding SpO2 records. The origi-
nal PPG signal is segmented into 10-second chunks,
and for each chunk, the 10th record in the SpO2 se-
quence is selected, as the goal is to predict the SpO2
value based on the previous 10 seconds of the input
signal. Consequently, this configuration generates 48
PPG signals (calculated as 60001/125/10) from each
patient, and the SpO2 value associated with each PPG
signal is considered.
To enhance the quality of the PPG waveforms
before preparing the PPG signals for feature extrac-
tion, preprocessing of the PPG signals is performed.
Firstly, the signals are normalized to have a zero mean
and unit variance. Subsequently, to eliminate high-
frequency noise and baseline wandering, a 4th-order
Butterworth band-pass filter with cut-off frequencies
of 0.5Hz and 8Hz is employed. Finally, the Hampel
decision filter is used to remove any outliers present in
the PPG signal. The selection of these preprocessing
steps and filters is based on the procedure described
in (Slapni
ˇ
car et al., 2019).
The last step before the deep learning model gen-
Prediction of Oxygen Saturation from Graphene Respiratory Signals with PPG Trained DNN
741
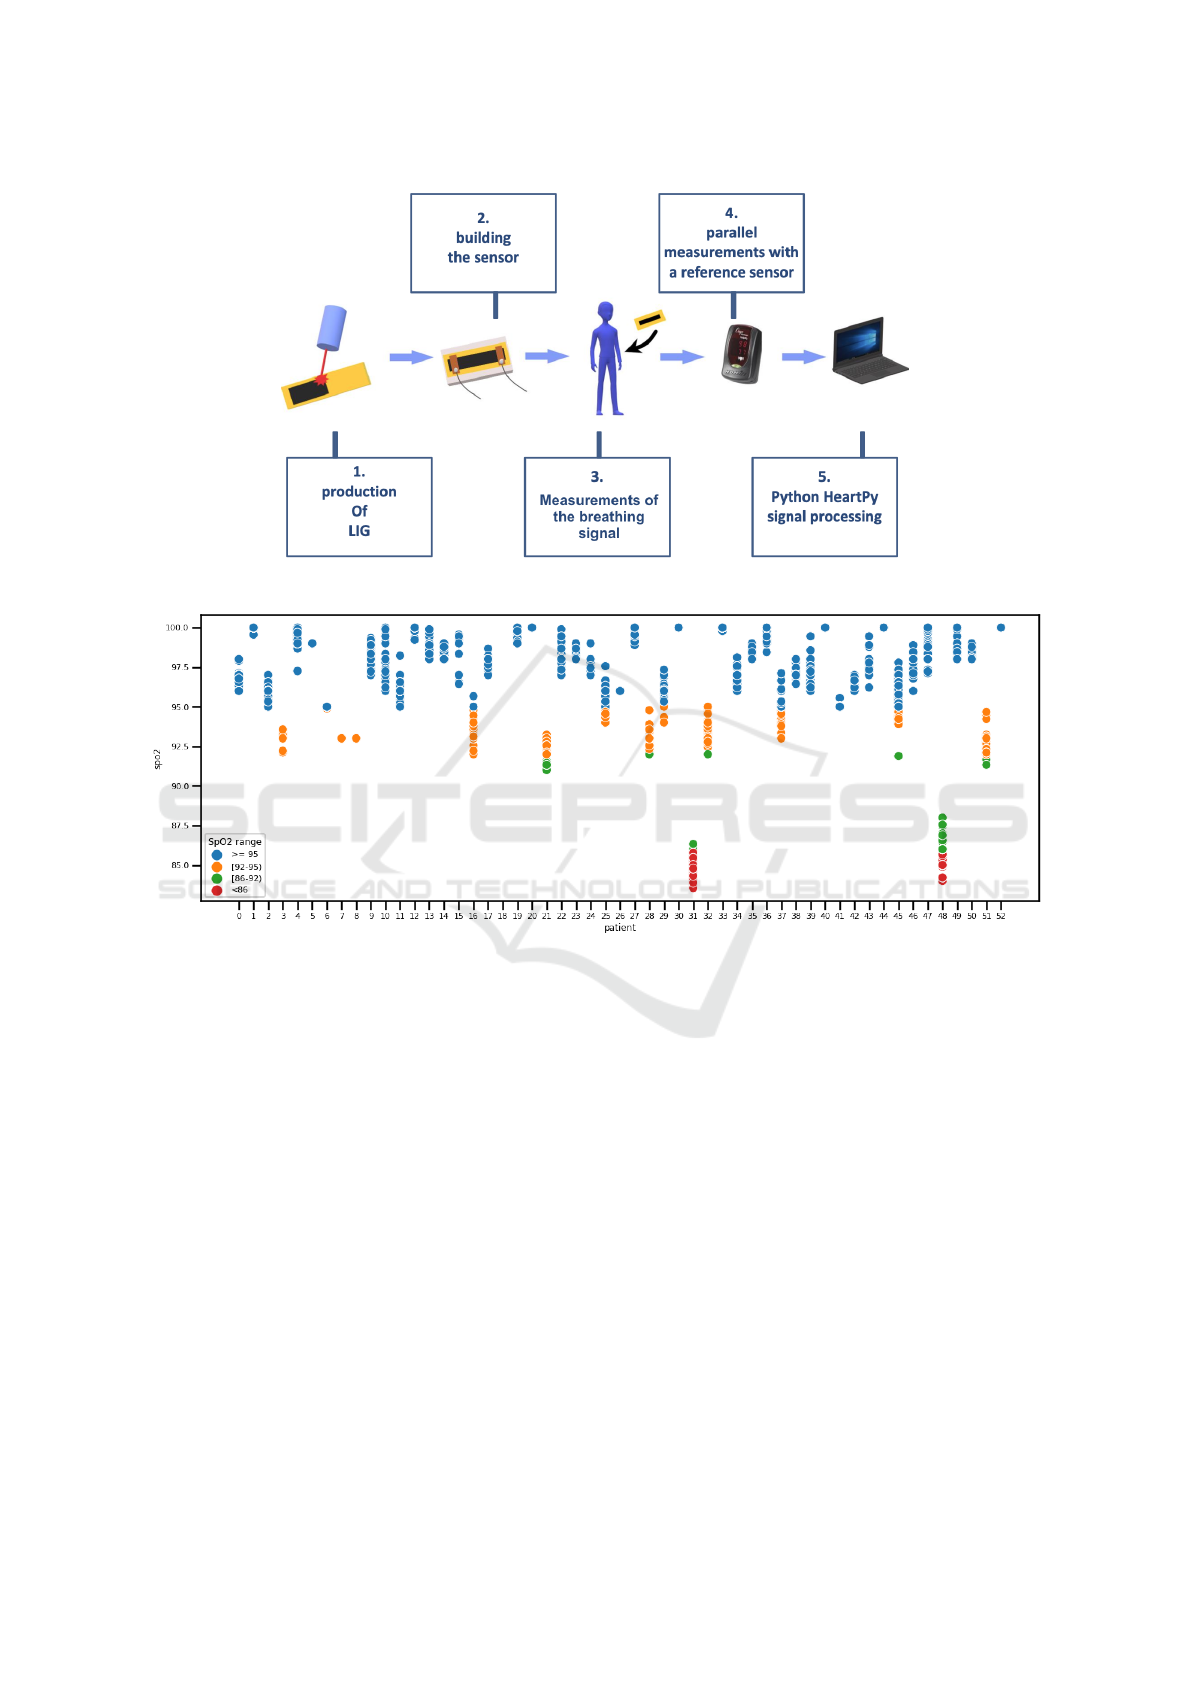
Figure 3: Experimental steps.
Figure 4: Scatter plot of the SpO2 values per patient in the training dataset.
eration is to perform PPG signal extraction with the
Python toolkit HeartPy (Van Gent et al., 2019). The
process method is employed to perform robust pre-
processing of the input signal and generate a list of
features that are utilized for training the models to
identify significant patterns in SpO2 predictions. The
HeartPy Toolkit is designed to produce the 13 features
presented in Table 1.
The dataset contained 2544 records, but 84
records were deleted because there were NaN values
for some features. The final dataset contains 2460
records, and it is made up of the extracted features
from the 10-second long PPG signals and the match-
ing SpO2 values as a result of the preceding steps.
2.4 Testing Dataset
For the creation of the testing dataset, we used the
novel database consisting of 40 LIG respiratory sig-
nals.
The majority of SpO2 measurements in the LIG
respiration dataset are normal (>= 95 %), but also
there are several measurements below 95% as can be
seen in Figure 5.
The same procedure employed for the training
dataset was utilized to extract the features from the
LIG respiration signals.
2.5 Deep Learning Model
This research employed a supervised deep learning
approach, utilizing a Deep Learning Artificial Neu-
ral Network (ANN) to estimate the SpO2 value as a
regression problem. The ANN is designed to output a
single value representing the predicted SpO2 value,
while the input is a matrix containing 13 features
extracted from the input signal using the HeartPy
toolkit.
BIOSIGNALS 2024 - 17th International Conference on Bio-inspired Systems and Signal Processing
742
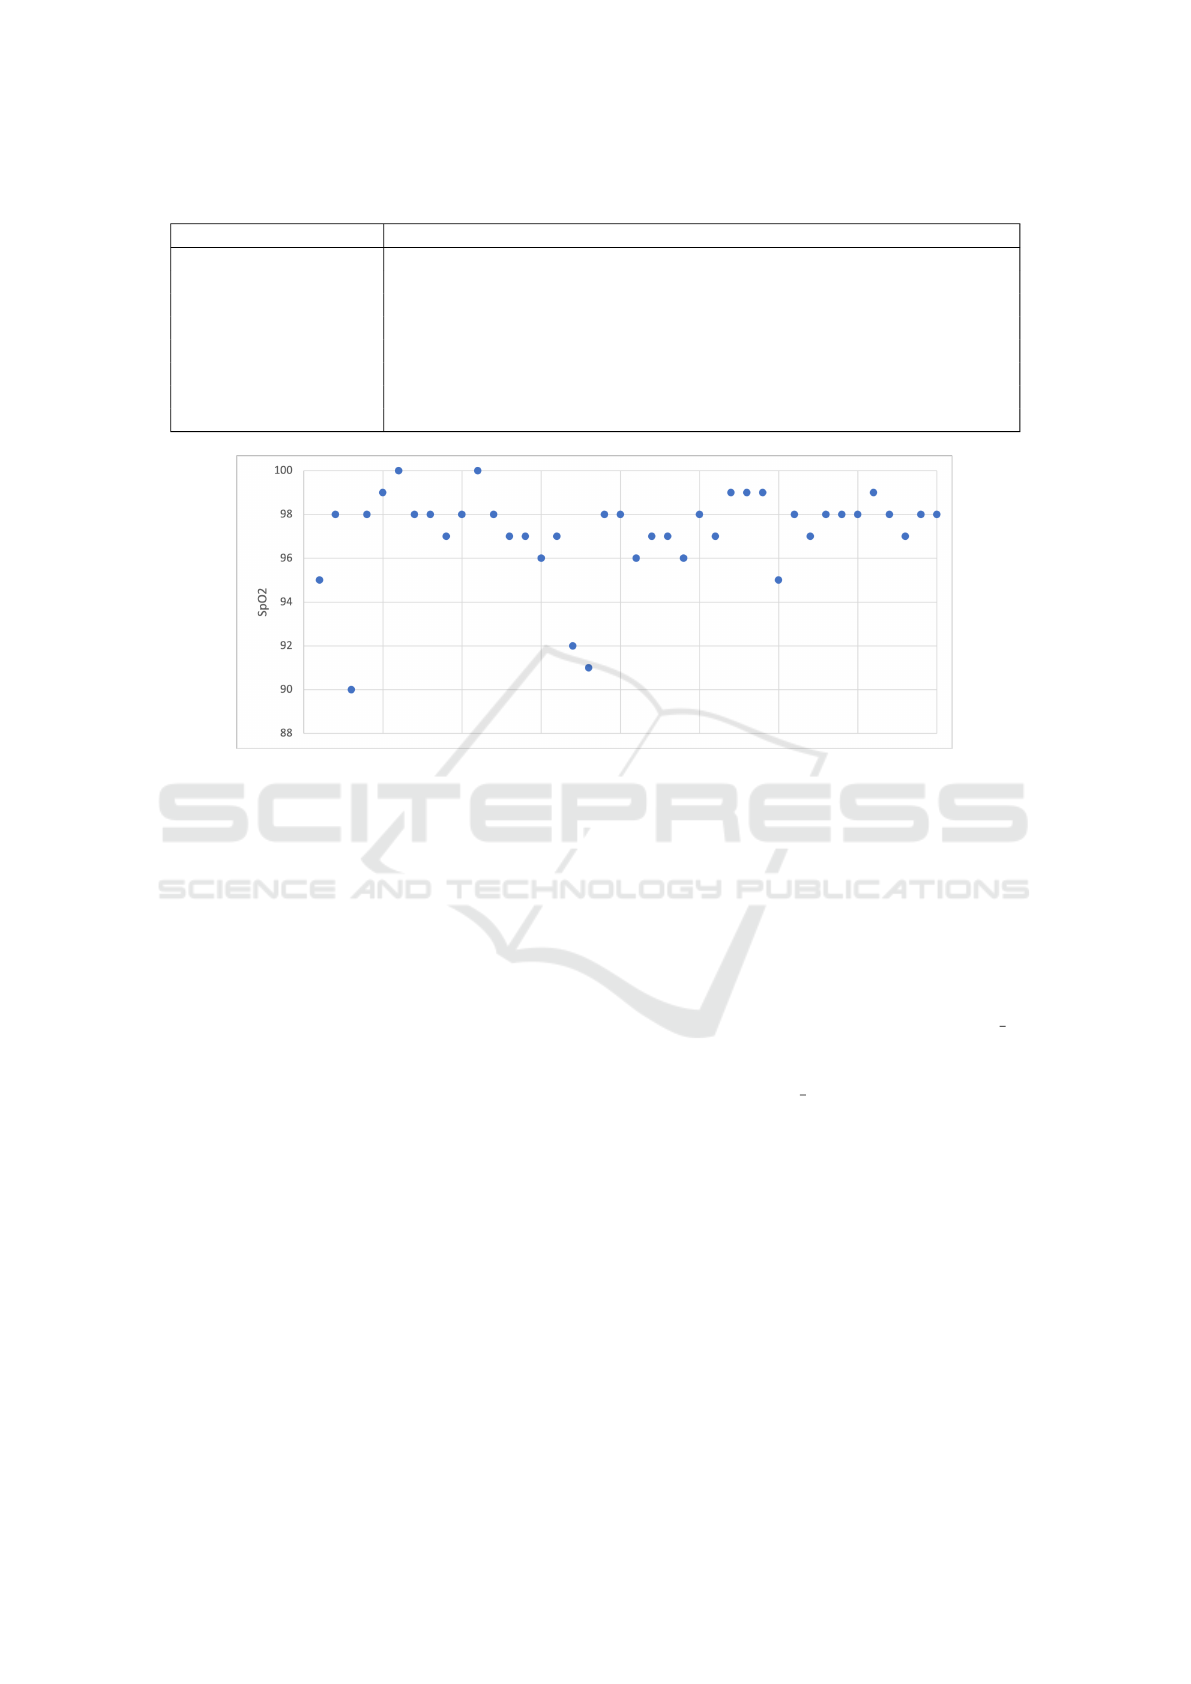
Table 1: Description of HeartPy Features.
Feature Description
bpm Heart rate in beats per minute.
IBI Mean distance of intervals between heartbeats.
SDNN Standard deviation of intervals between heartbeats.
SDSD Standard deviation of successive differences between adjacent R-R intervals.
RMSSD Root mean square of successive differences between adjacent R-R intervals.
pNN50/pNN20 Proportion of differences greater than 50ms/20ms.
MAD Median absolute deviation.
SD1, SD2, S, SD1/SD2 Derived from Poincare analysis and represent the breathing rate.
Figure 5: Scatter plot of the SpO2 values in the testing dataset.
The training dataset of 2460 records described in
the section 2.3 was split in the following ratio: 90%
of the data was used for training and 10% for the vali-
dation. Before splitting the data, data standardization
was performed.
The testing dataset containing 40 records is de-
scribed in the subsection 2.4.
The implementation of the deep learning ANN in-
volved the use of the Keras API written in Python,
which runs on top of the TensorFlow machine learn-
ing platform. The architecture of the Deep Learning
ANN employed in this study is illustrated in Figure 6.
The Keras library’s Sequential module was em-
ployed to build a sequence of ANN layers that are
stacked in consecutive order. To specify the number
of neurons, the Dense Keras module is used to define
each layer. A dropout layer is also added to the model
to prevent overfitting. As depicted in Figure 6, the
deep learning neural network is fully connected, com-
prising four hidden layers with a particular number of
neurons and one output layer with only one neuron
that predicts the SpO2 value.
We utilized the 13 input features as predictors in
the input data for the Sequential model, which is then
passed to the subsequent layers. To perform calcula-
tions within each neuron, we employed the Rectified
Linear Unit (ReLU) function as the activation func-
tion, which is the most widely used activation func-
tion according to (Kleine B
¨
uning et al., 2020). The
ReLu function produces an output of zero if the input
value is less than zero; otherwise, it is equal to the
provided input value. To compute the loss, we used
Mean Squared Error (MSE) as it is the most com-
monly used loss function for regression, as per (Kol-
bæk et al., 2020).
To determine the optimal accuracy, we conducted
a tuning process on the ANN model, exploring dif-
ferent combinations of the ’epoch’ and ’batch size’
values. Specifically, we used Grid Search Cross-
Validation to test various values for these hyperpa-
rameters. The ’batch size’ parameter refers to the
number of training examples used in a single for-
ward/backward pass, while ’epochs’ indicates the
number of times the learning algorithm runs through
the entire training dataset.
2.6 Regression Metrics
To assess the accuracy of the model, we used the
standard regression metrics: MAE (Mean absolute er-
ror), MSE (Mean Squared Error), RMSE (Root mean
squared error), R
2
(R-squared), and RMLSE (Root
Mean Log Squared Error).
The Mean Absolute Error (MAE) provides an
average of the absolute differences between the ac-
tual (y
i
) and predicted ( ˆy
i
) values. It is given by the
Prediction of Oxygen Saturation from Graphene Respiratory Signals with PPG Trained DNN
743

Figure 6: Deep Learning ANN architecture.
formula:
MAE =
1
n
n
∑
i=1
|
y
i
− ˆy
i
|
The Mean Squared Error (MSE) quantifies the
average of the squared differences between actual and
predicted values:
MSE =
1
n
n
∑
i=1
(y
i
− ˆy
i
)
2
The Root Mean Squared Error (RMSE) is the
square root of the MSE and is expressed as:
RMSE =
√
MSE
R-squared (R
2
), a widely-used metric, measures
the proportion of variance in the dependent variable
explained by the model. Its formula is:
R
2
= 1 −
SS
residual
SS
total
where SS
residual
is the sum of squared residuals, and
SS
total
is the total sum of squares.
The Root Mean Log Squared Error (RMLSE)
is particularly useful when dealing with a wide range
of target variable values. It is calculated as:
RMLSE =
s
1
n
n
∑
i=1
(log(1 + y
i
) −log(1 + ˆy
i
))
2
3 RESULTS
Table 2 presents the actual and predicted SpO2 values
from the testing dataset.
Table 3 shows results from the model’s perfor-
mance evaluation metrics in predicting SpO2 from
LIG respiratory signals.
Table 2: Comparison of actual and predicted SpO2 values
for the testing dataset.
Actual
SpO2
Predicted
SpO2
Actual
SpO2
Predicted
SpO2
95 92.91 98 96.04
90 91.94 98 96.13
99 97.19 100 98.27
98 96.44 98 96.52
97 95.55 98 96.61
100 98.62 98 99.38
97 95.64 97 98.34
96 97.34 97 95.68
92 93.32 91 92.26
98 96.74 98 96.80
96 97.19 97 98.14
97 95.88 96 97.04
98 96.97 97 95.97
99 100.00 98 98.02
99 98.11 95 95.85
98 97.27 97 97.68
98 97.32 98 98.55
98 97.49 99 98.54
98 97.60 97 96.77
98 97.84 97 97.85
Table 3: Model Evaluation Metrics.
Metric Value
MSE 1.52
RMSE 1.23
RMLSE 0.005
MAE 1.13
R
2
0.68
The DNN model’s performance in predicting
SpO2 from respiratory signals shows highly promis-
ing results. An MSE of 1.52 indicates that, on av-
erage, the model’s predictions closely match the ac-
tual SpO2 values. The MAE, standing at 1.13, reveals
BIOSIGNALS 2024 - 17th International Conference on Bio-inspired Systems and Signal Processing
744

a low average absolute difference between predicted
and actual SpO2 values. Additionally, the RMSE
value, which is derived from the MSE and equals
1.23, provides a comprehensible metric in the orig-
inal SpO2 scale, signifying that the model’s predic-
tions align well with the true values. There was no
difference observed in the data between the three sub-
jects.
Moreover, the R
2
value of 0.68 demonstrates the
model’s ability to explain roughly 68% of the variance
in SpO2, indicating a good fit to the underlying data
patterns.
4 CONCLUSION
This paper investigates the application of a wearable
laser-induced graphene respiration sensor for SpO2
estimation as a substitute for PPG-based oximeters,
foremost used as a tool in a triage process in mass
casualty events. The LIG sensor is placed in 7 differ-
ent positions on the individual’s chest to facilitate the
real-time monitoring of respiratory signals.
The obtained promising results for estimating
SpO2 with LIG signals processed by HeartPy have
shown another possible utilization of the wearable
mechanical deflection sensors as a part of integrated
patch-like sensors. The neural network’s performance
shows potential, as indicated by regression metrics,
including a mean squared error (MSE) of 0.152, a
mean absolute error (MAE) of 1.13, a root mean
square error (RMSE) of 1.23, and an R
2
score of 0.68.
By combining PPG and respiratory signals from
graphene, we offer an idea for developing 2D sensors
for emergency situations, leading to better monitor-
ing and management of various medical conditions.
However, further research is needed to explore the
potential correlations between these signals and their
clinical applications, as well as realistic performance
under application in the field. For example, motion
artefacts may appear in signals, and additional filter-
ing may need to be applied to remedy it.
The study limitation includes the small number of
instances where SpO2 was measured below 90%, as
we faced challenges in obtaining access to individuals
with respiratory difficulties.
Ethical Considerations
The signals were recorded and conducted with ap-
proval from the Ethics Committee.
ACKNOWLEDGEMENTS
This work was supported in part by the NATO Sci-
ence for Peace and Security Program under project
SP4LIFE, number G5825. We also acknowledge sup-
port by the Serbian Ministry of Science, Technolog-
ical Development, and Innovations, contract num-
ber 451-03-47/2023–01/200026. This work was sup-
ported in part by the Faculty of Computer Science
and Engineering in Skopje, North Macedonia under
project BIOX.
REFERENCES
Benson, M., Koenig, K. L., and Schultz, C. H. (1996). Dis-
aster triage: Start, then save—a new method of dy-
namic triage for victims of a catastrophic earthquake.
Prehospital and disaster medicine, 11(2):117–124.
Castaneda, D., Esparza, A., Ghamari, M., and Soltanpur,
C. (2018). Hji jo b. Nazeran, and bioelectronics,”
A review on wearable photoplethysmography sensors
and their potential future applications in health care,
4(4):195.
Chan, M., Ganti, V. G., Heller, J. A., Abdallah, C. A.,
Etemadi, M., and Inan, O. T. (2021). Enabling contin-
uous wearable reflectance pulse oximetry at the ster-
num. Biosensors, 11(12):521.
Chen, H., Bao, S., Ma, J., Wang, P., Lu, H., Oetomo,
S. B., and Chen, W. (2019). A wearable daily respi-
ration monitoring system using pdms-graphene com-
pound tensile sensor for adult. In 2019 41st Annual
International Conference of the IEEE Engineering in
Medicine and Biology Society (EMBC), pages 1269–
1273. IEEE.
Dias, D. and Paulo Silva Cunha, J. (2018). Wearable health
devices—vital sign monitoring, systems and technolo-
gies. Sensors, 18(8):2414.
Kleine B
¨
uning, M., Kern, P., and Sinz, C. (2020). Verifying
equivalence properties of neural networks with relu
activation functions. In International Conference on
Principles and Practice of Constraint Programming,
pages 868–884. Springer.
Kolbæk, M., Tan, Z.-H., Jensen, S. H., and Jensen, J.
(2020). On loss functions for supervised monaural
time-domain speech enhancement. IEEE/ACM Trans-
actions on Audio, Speech, and Language Processing,
28:825–838.
Koteska, B., Bodanova, A. M., Mitrova, H., Sidorenko, M.,
and Lehocki, F. (2022). A deep learning approach
to estimate spo2 from ppg signals. In Proceedings
of the 9th International Conference on Bioinformatics
Research and Applications, pages 142–148.
Majumder, S., Mondal, T., and Deen, M. J. (2017). Wear-
able sensors for remote health monitoring. Sensors,
17(1):130.
Na, S. J., Ko, R.-E., Ko, M. G., and Jeon, K. (2021). Auto-
mated alert and activation of medical emergency team
Prediction of Oxygen Saturation from Graphene Respiratory Signals with PPG Trained DNN
745

using early warning score. Journal of Intensive Care,
9(1):1–9.
Parkes, M. (2006). Breath-holding and its breakpoint. Ex-
perimental physiology, 91(1):1–15.
Rasch-Halvorsen, Ø., Hassel, E., Langhammer, A., Brump-
ton, B. M., and Steinshamn, S. (2019). The associa-
tion between dynamic lung volume and peak oxygen
uptake in a healthy general population: the hunt study.
BMC Pulmonary Medicine, 19(1):1–7.
Shao, D., Liu, C., Tsow, F., Yang, Y., Du, Z., Iriya, R.,
Yu, H., and Tao, N. (2015). Noncontact monitoring
of blood oxygen saturation using camera and dual-
wavelength imaging system. IEEE Transactions on
Biomedical Engineering, 63(6):1091–1098.
Slapni
ˇ
car, G., Mlakar, N., and Lu
ˇ
strek, M. (2019). Blood
pressure estimation from photoplethysmogram using
a spectro-temporal deep neural network. Sensors,
19(15):3420.
Song, Y., Chen, L., Yang, Q., Liu, G., Yu, Q., Xie, X.,
Chen, C., Liu, J., Chao, G., Chen, X., et al. (2023).
Graphene-based flexible sensors for respiratory and
airflow monitoring. ACS Applied Nano Materials,
6(10):8937–8944.
Van Gent, P., Farah, H., Van Nes, N., and Van Arem, B.
(2019). Heartpy: A novel heart rate algorithm for
the analysis of noisy signals. Transportation research
part F: traffic psychology and behaviour, 66:368–378.
Vi
´
centi
´
c, T., Ra
ˇ
slji
´
c Rafajilovi
´
c, M., Ili
´
c, S. D., Koteska,
B., Madevska Bogdanova, A., Pa
ˇ
sti, I. A., Lehocki, F.,
and Spasenovi
´
c, M. (2022). Laser-induced graphene
for heartbeat monitoring with heartpy analysis. Sen-
sors, 22(17):6326.
Wang, L., Wang, Z., Bakhtiyari, A. N., and Zheng,
H. (2020). A comparative study of laser-induced
graphene by co2 infrared laser and 355 nm ultravio-
let (uv) laser. Micromachines, 11(12):1094.
BIOSIGNALS 2024 - 17th International Conference on Bio-inspired Systems and Signal Processing
746
