
Identifying Representative Images for Events Description Using Machine
Learning
Marcos Vinycius Soares de Sousa and Raimundo C. S. Vasconcelos
Instituto Federal de Bras
´
ılia, Taguatinga - DF, Brazil
Keywords:
Representative Images, Machine Learning, Events Description.
Abstract:
The use of social networks to record events – disasters, demonstrations, parties – has grown a lot and has begun
to receive attention in recent years. Existing research focuses primarily on analyzing text-based messages from
social media platforms such as Twitter. Images, photos and other media are increasingly used and can provide
valuable information to enhance the understanding of an event and can be used as indicators of relevance. This
work explores the Twitter social media platform, based on image and text in the case of the demonstrations
that took place in Brazil on September 7, 2021, as a result of the Independence celebrations. This work uses
machine learning techniques (VGG-16, VGG-19, ResNet50v2 and InceptionResNetv2) for finding relevant
Twitter images. The results show that the existence of an image within a social media message can serve as
a high probability indicator of relevant content. An extensive experimental evaluation was carried out and
demonstrated that high efficiency gains can be obtained compared to state-of-the-art methods.
1 INTRODUCTION
Several events occur every second, are recorded and
publicized by newspapers, magazines and other me-
dia vehicles and, mainly, by mobile phones of or-
dinary people. Terrorist acts, natural catastrophes,
ceremonies such as weddings, graduation, sporting
events, among others, frequently occur around the
world. These data, shared on platforms such as Twit-
ter, Facebook and Instagram, are accessible to any-
one.
These images can be used as representative of
events and, in this way, filtering them is a great chal-
lenge. Crucial data, which could really represent the
event, may be mixed up with even larger amounts of
unimportant data. However, manual selection of rep-
resentative (useful) images from a large amount of
data may be infeasible. Thus, the problem of how
to automatically separate representative from non-
representative images was identified. In this research,
techniques were investigated to identify possible solu-
tions to this problem, considering the lack of labeled
images that indicate representativeness.
Existing approaches are based on representa-
tions of components that can encode the information
needed to describe events, such as people who were
part of the event (eg. suspects or victims); objects that
appear in the scene (for example, cars or weapons);
and the location where the event took place (eg parks,
stadiums or buildings).
Consider an event - such as a terrorist attack - that
took place at a location with a lot of people with cell
phones, such as stadiums or theaters. In minutes, hun-
dreds or even thousands of text messages, images and
videos can be shared on social media.
A total of 7,888,374 tweets related to the terrorist
attack that occurred during the 2013 Boston Marathon
were collected, with the first tweet published less than
four minutes after the first explosion. A correct de-
scription of the events that make up the event can help
in its understanding.
The data obtained for an event E can be di-
vided into two main groups: Representative and Non-
Representative. Among the data in the Representative
group are those that belong to the event and that, in
some way, can help in understanding it. Among the
data of the Non-Representative group are those that
do not belong to event E, but that may or may not
present some similarity with it.
The task of performing this separation into
two groups of images, Representative and Non-
Representative, can be modeled through neural net-
works.
This work aimed to analyze different existing
techniques for retrieving information that use learn-
ing neural networks, seeking to identify representa-
Soares de Sousa, M. and Vasconcelos, R.
Identifying Representative Images for Events Description Using Machine Learning.
DOI: 10.5220/0012354000003660
Paper published under CC license (CC BY-NC-ND 4.0)
In Proceedings of the 19th International Joint Conference on Computer Vision, Imaging and Computer Graphics Theory and Applications (VISIGRAPP 2024) - Volume 3: VISAPP, pages
409-416
ISBN: 978-989-758-679-8; ISSN: 2184-4321
Proceedings Copyright © 2024 by SCITEPRESS – Science and Technology Publications, Lda.
409

tive images for an event, based on posts made through
mobile phones.
This work collected images from the Wikimedia
Commons image base with the keywords - Demon-
strations, Manifestations and Acts - and were used to
evaluate VGG-16, VGG-19, ResnNet50v2 and Incep-
tionResNetv2 architectures as learning mechanisms.
It was observed that the VGG-19 network has ob-
tained the best result. Thus, in an attempt to fur-
ther improve the results, it was decided to work with
a larger base of images and, in this case, the VGG-
19 network was tested with images from the GDELT
base, for positive results, and Unsplash, for negative
results.
2 RELATED WORK
According to Gupta et al. (Gupta et al., 2013), the
2013 Boston Marathon bombing generated 7,888,374
tweets. Of that total, around 29% was false infor-
mation or rumors, 51% was general comments and
opinions, and only 20% contained useful information.
Other examples of data that do not belong to the event
of interest are shown in Figure 1, where a search for
the Notre Dame Cathedral Fire event also retrieves
cartoons and memes (Figures 1c and 1d).
To discover representative images, some works
compare (Pedronette et al., 2019; Iscen et al., 2019)
descriptors, however, currently, many applications
use resources extracted from deep networks. These
networks, trained for a specific context, try to seman-
tically describe the images (Razavian et al., 2014;
Zheng et al., 2017) or locally, through points of in-
terest (Scheirer et al., 2013), obtaining good results in
the recovery task.
Despite the large amount of data available, record-
ing all possible events (explosions, shootings, floods,
fires, etc.) that may be of interest is impractical. This
causes this issue to have an open scenario (Garrett,
). Furthermore, if two events are considered, even if
they are of the same type (like two explosions, for ex-
ample) there may be very different aspects (such as
location, weather or number of people gathered), re-
quiring a large number and variety of training samples
of data for the generalization of a model that separates
representative from non-representative images.
Work presented in (Starbird et al., 2010) points
out that the use of social networks during natural or
man-made disasters has increased significantly in re-
cent years and, therefore, there are studies on the rel-
evance and usefulness of the data that can be obtained
through these social networks for humanitarian orga-
nizations dealing with these disasters. The authors re-
alize, however, that most of these studies are focused
on textual content, and so they decided to work on us-
ing visual content (i.e., images) to show their value to
these humanitarian organizations. Despite their use-
fulness, they acknowledge that the sheer quantity of
images makes them difficult to use effectively, despite
how useful such data would be for gaining informa-
tion and better understanding emergencies.
The authors point out, then, that currently one of
the most popular ways to obtain information from im-
ages is to use a hybrid model, where human work-
ers classify points of interest within a set of images
that are then used to train supervised machine learn-
ing models to recognize these points in new images
automatically.
For data collection, the authors used AIDR plat-
form, for classification, the VGG-16 model of con-
volutional neural network was used as a reference to
train on a set of images previously classified by hu-
man volunteers, and for the removal of duplicate im-
ages was used the Perceptual Hashing (pHash) tech-
nique.
The research developed in (Kavanaugh et al.,
2012) investigates the use of the Twitter microblog-
ging platform during a critical event for the security
of a region, in this case the period of threat of sea-
sonal floods in the Red River Valley in 2009, with
the objective of understanding more about chats based
on CMC (computer-mediated communication) in the
new era of “social networks” and describes character-
istics of the relationship between this chat and mass
emergency events.
During the study, information was obtained about
user behavior in relation to emergency events, how
the proximity and severity of the threat change user
behavior and how this happens. The study results
also provided insight into practical emergency man-
agement issues, showing that information obtained
through sites such as twitter can complement, but not
replace, official sources of information in emergency
situations.
The study presented results of an exploratory
study conducted between June and December 2010
with government officials in Arlington, Virginia,
and the greater National Capitol Region surrounding
Washington, D.C., researchers sought to better under-
stand social media use by government officials and
other members of society, in addition to seeking to
understand the use of social networks specifically to
manage crisis situations, whether routine or critical.
The research presented in (Hughes and Palen,
2009) was conducted based on the analysis of local
data from social networks and interviews and ques-
tionnaires applied to 25 officials from the County of
VISAPP 2024 - 19th International Conference on Computer Vision Theory and Applications
410

(a) (b) (c) (d)
Figure 1: When we consider the Notre Dame Cathedral Fire event that occurred on April 15, 2019, figures (a) and (b) are
from the event, but figures (c) and (d), also retrieved in a search for the event, do not belong to the event.
Arlington.
The results of the exploratory study obtained
based on interviews, questionnaires and data analysis
can be placed in 3 main areas: The local government
uses social networks without having notions of cost,
benefit, target audience, what it should monitor, how
it should respond and what is the effect of using social
media to communicate with the public; Among the
technical problems found in the study are the ability
to: Recognize relevant information accurately and in
a timely manner; Alerting government officials to in-
formation analyzed from various social media sources
and; Visualize current and past states of the obtained
information and its analysis.
The research (Simonyan and Zisserman, 2015) fo-
cuses on trying to understand the use of social net-
works during emergency situations or mass concen-
tration, focusing more specifically on the Twitter site.
The research used the Twitter search API during 4
events that took place in the USA between August and
September 2008 to obtain data relevant to the inves-
tigation, focusing on the textual content of the mes-
sages.
The data collected during the study indicate that
the platform is used as a support for the dissemination
of news. Also, adoption of platform users may be
linked to the occurrence of emergency situations and
mass convergence.
Finally, they conclude that Twitter and other sim-
ilar technologies can be used to obtain data for emer-
gency management.
3 MATERIALS
3.1 Hardware
This work was done using the Google Colab environ-
ment, a free cloud storage service in which it is possi-
ble to write and run Jupyter notebooks with GPU and
TPU support.
3.2 Software
As Google Colab uses Jupyter notebooks, the scripts
were written in Python. As for the libraries, we used
scikit-image (version 0.19.x) that provides tools to
perform image pre-processing like background seg-
mentation and Tensorflow (version 2.x) to develop the
Neural Networks.
4 PROPOSED METHODOLOGY
Figure 2 summarizes the process developed through-
out this work in five main steps:
1. Definition of search keywords
2. Image dataset creation - selection of correspond-
ing images from the Wikimedia Commons base;
3. Training with four distinct architectures: VGG-
16, VGG-19, ResNet50v2 and InceptionRes-
Netv2;
4. Performance comparison of different approaches
5. Training VGG-19 with larger image database
(GDELT and Unsplash);
Images were collected on the Twitter platform, as
it has a large user base in Brazil and allows instant
image sharing. We therefore sought to select an event
that would generate great movement on the platform
and, in this context, the national holiday of September
7, 2021, when Brazil’s Independence is celebrated,
emerged as the ideal option, since the day would be
marked by activities civic events and political demon-
strations about the country’s situation in relation to
the crisis that accompanied the COVID-19 virus pan-
demic.
A monitoring was carried out of the hashtags
present in the trending topics that were related to the
national holiday of September 7th and also with the
acts that were scheduled for that date. In this way, the
hashtags that had the greatest movement in the period
of a week around September 7 were selected. Then,
tweets, containing images and presenting one of the
Identifying Representative Images for Events Description Using Machine Learning
411
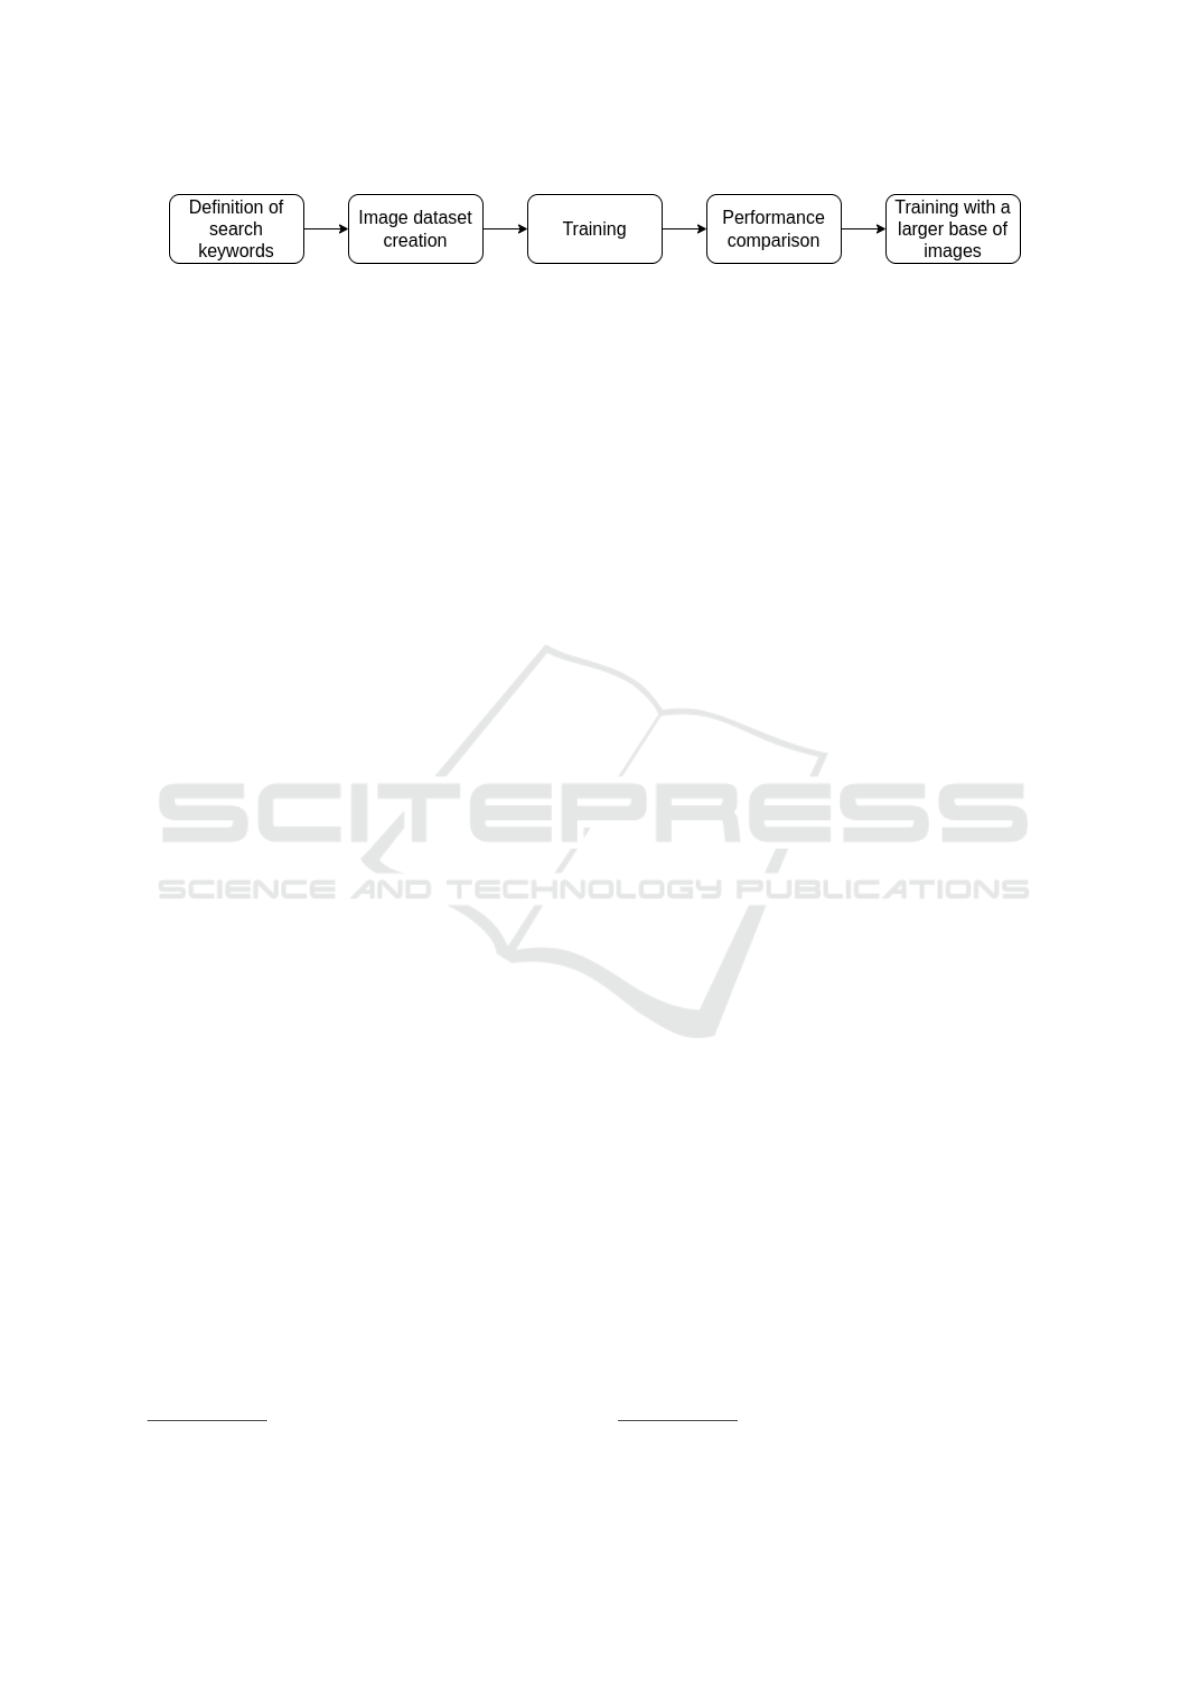
Figure 2: Flowchart representing the whole process of representative image identification.
selected hashtags, were collected with the aid of the
API tool that Twitter itself provides. A total of 56,937
tweets were collected.
During data collection, it was also defined what
would be the keywords based on the events observed
on the day. The following words were used: Demon-
strations, Manifestations and Acts. Since these would
encompass most of the events that took place on that
date, such as commemorative acts for the celebration
of independence and political demonstrations.
For the training, images were selected, corre-
sponding to the key words, from Wikimedia Com-
mons
1
, a portal that has media content curated and
classified by the community. These images served as
the basis for the generation of a model to classify the
images that were collected in the defined period. 1320
positive images and 788 negative images were col-
lected for the defined keywords. These images were
pooled into a training dataset and 245 photos were se-
lected from those collected from Twitter to build a test
dataset.
To take advantage of the tools available in the
Keras library, the concept of transfer learning was
used, which consists of taking resources learned in a
problem, and taking advantage of them in the solution
of another problem that is similar. In the case of deep
learning, it consists of using part of a model that has
been trained to recognize a wide range of features to
accelerate the learning process of the model you want
to create.
Four architectures were provisionally separated by
their ability to deal with problems similar to those ad-
dressed in this work: VGG-16, VGG-19, ResNet50v2
and InceptionResNetv2.
VGG-16 and VGG-19 are part of the architecture
family known as VGG Net, being a pre-trained convo-
lutional neural network (or CNN). They are known for
their simplicity, being formed by 3x3 convolutional
layers stacked in increasing depth. Volume size re-
duction is handled through maximum pooling. Two
interconnected layers are followed by a softmax clas-
sifier. The numbers 16 and 19 in the names refer to
the number of weight layers in the network. Unlike
other sequential network architectures like VGG Net,
ResNet relies on micro-architecture modules to build
the network. InceptionResNetv2 is a convolutional
neural network that is trained on more than a million
images from the ImageNet database.
1
https://commons.wikimedia.org/wiki/Category:Images
4.1 Results
Using each of these architectures, graphs of accuracy
and loss were generated for each model, showing the
training and validation values and how they behaved
during the training duration. Figures 3, 4, 5 and 6
show the accuracy and loss curves for the architec-
tures used.
Some conclusions were obtained:
• In all architectures the accuracy rose very quickly
but reached a plateau, which may indicate that,
under the current conditions of the experiment, in-
creasing the training duration will not give a sig-
nificant increase in the accuracy of the model;
• The architectures had similar precision and loss
numbers, but the VGG-16 and VGG-19 architec-
tures had smaller discrepancies between the train-
ing and validation numbers, indicating that we
had less overfitting in the models trained with
these architectures;
• The ResNet50v2 architecture had a large discrep-
ancy between the training and validation numbers,
indicating a high probability that there was over-
fitting in the model trained with this architecture.
However, despite the numbers presented in the
graphs, when asking the trained models to classify
images from the test dataset, a relatively high number
of false positives was identified, which indicated that
the size of the datasets used initially was insufficient
to train a model accurate regardless of the architec-
ture used. The Figure 7 shows positive and negative
results obtained by tests using the VGG-16 architec-
ture.
Once the performance of the architectures was an-
alyzed, it was decided to continue with the tests and
they would be carried out using the VGG-19 architec-
ture, as it is very similar to the VGG-16, the main dif-
ference being the number of weight layers. Once the
architecture was resolved, larger datasets were used
for retraining.
For positive results, the dataset of images of
protests provided by the GDELT project
2
was used,
based on its Visual Global Knowledge Graph, which
is a tool that monitors several media vehicles and cat-
egorizes this flow of data and, from it, were collected
30000 images out of the 5 million available.
2
https://www.gdeltproject.org/
VISAPP 2024 - 19th International Conference on Computer Vision Theory and Applications
412
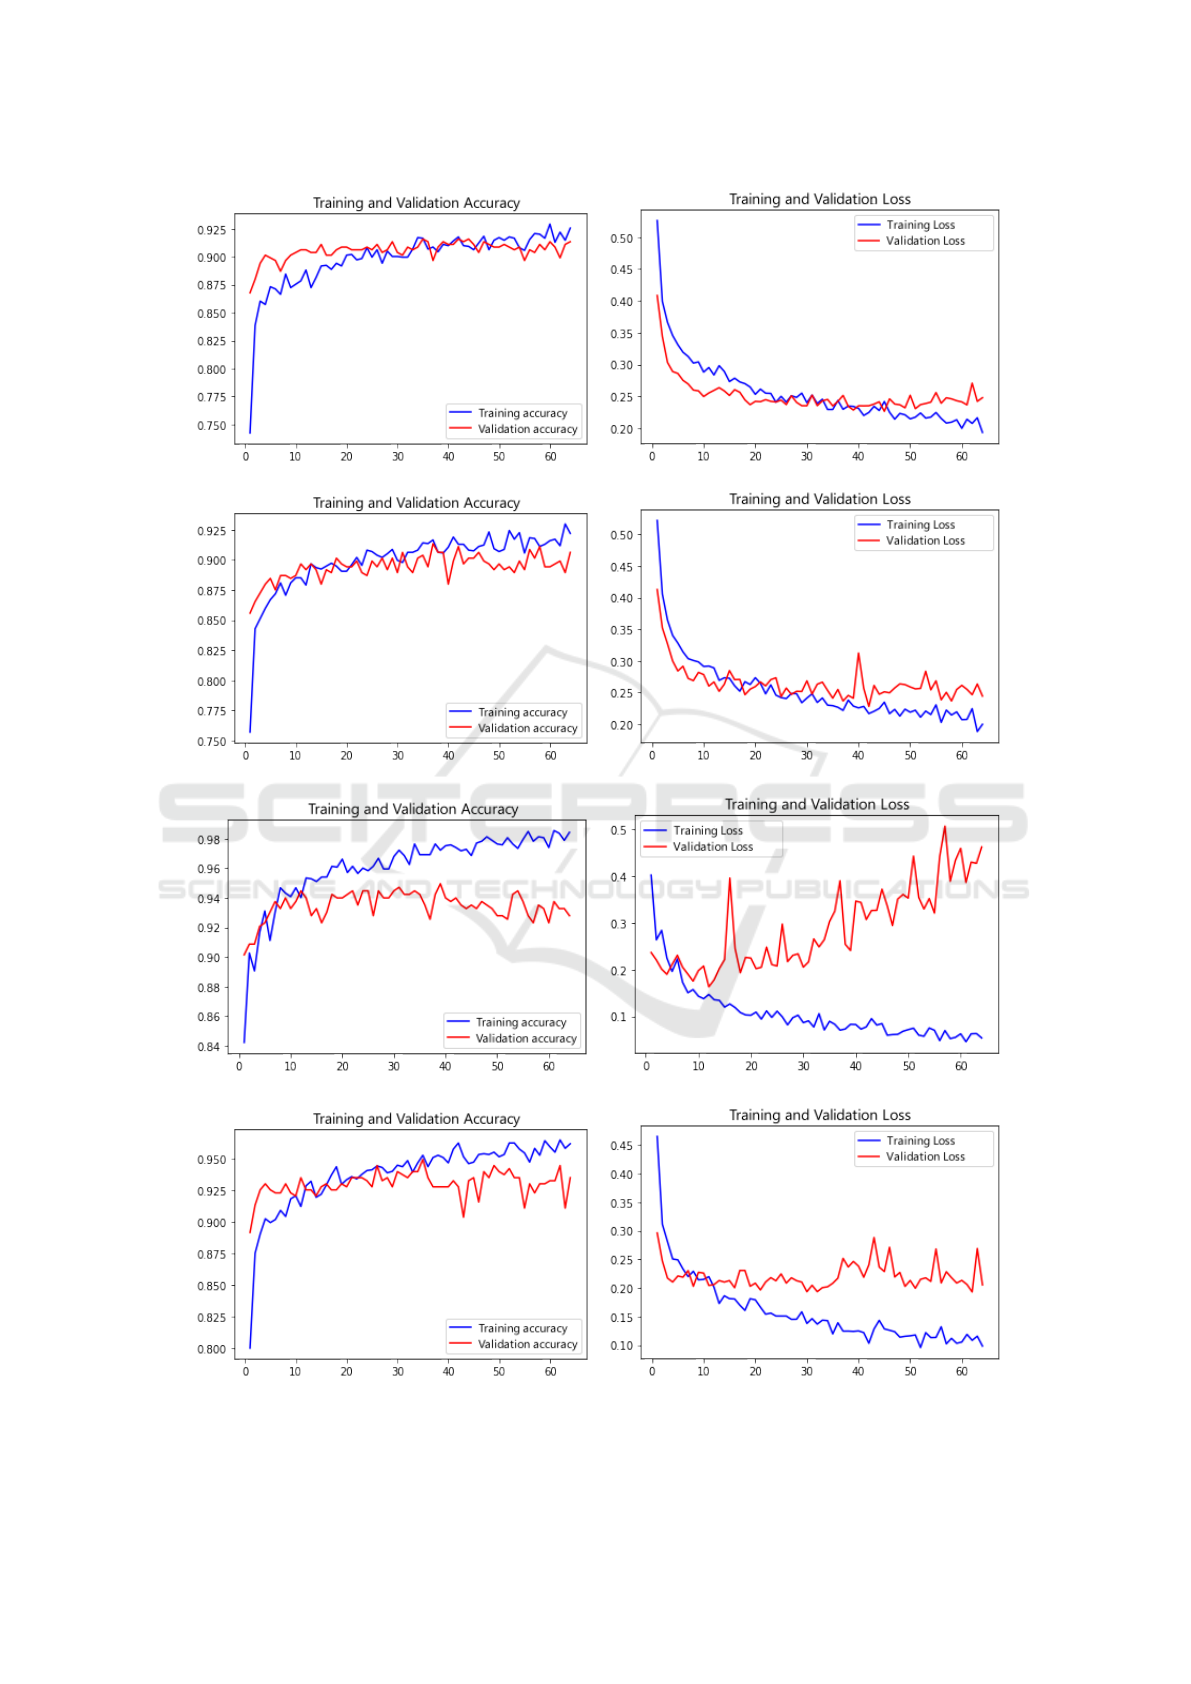
Figure 3: Accuracy and Loss curves based on VGG-16 architecture.
Figure 4: Accuracy and Loss curves based on VGG-19 architecture.
Figure 5: Accuracy and Loss curves based on Resnet50v2 architecture.
Figure 6: Accuracy and Loss curves based on InceptionResNetv2 architecture.
Identifying Representative Images for Events Description Using Machine Learning
413
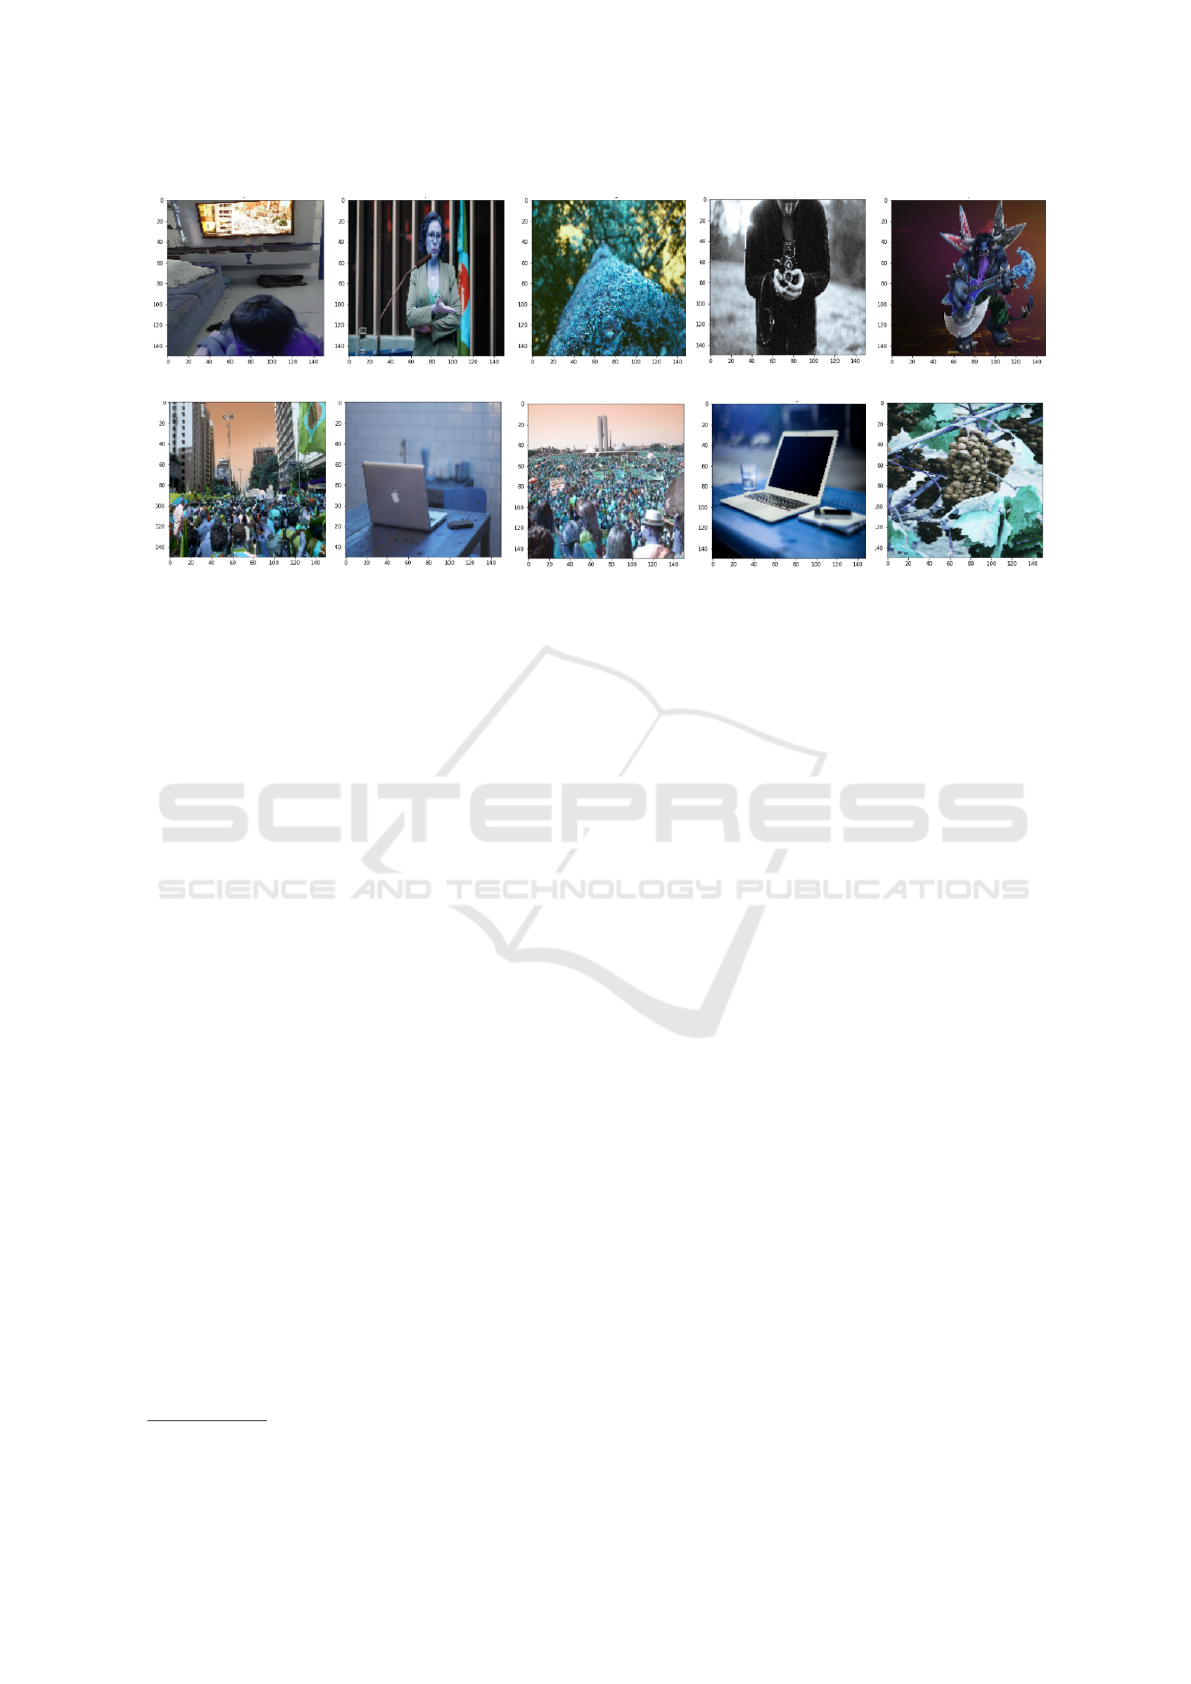
(a) positive (b) positive (c) negative (d) negative (e) positive
(f) positive (g) negative (h) positive (i) negative (j) positive
Figure 7: Results obtained from testing the model created with the VGG-16 architecture.
For negative results, the open dataset provided by
the Unsplash
3
website was used, which maintains a
curation of images available through a free license
and, in this way, the 25,000 images available in the
lite version of the dataset were obtained. With the ar-
chitecture and the larger dataset, a new wave of train-
ing of the model was performed, initially in 32 pe-
riods and, at the end of the training and validation,
accuracy and loss graphs were obtained, as shown in
Figure 8:
By observing these graphs, it is possible to verify
that increasing the number of samples contributed a
lot to increase the accuracy, reaching values of 0.9755
of training accuracy and 0.9830 of validation accu-
racy in its last training season. The graph shows that
the accuracy during training became more stable and
with validation results compatible with training and
even above them.
To corroborate these results (shown in Figure 8),
Figure 9 shows that the model had excellent results in
image classification, presenting only 1 false positive
(second figure from the left of the first row), a con-
siderable advance in relation to the initial tests with
smaller datasets. To test whether the model could
be further refined, further training of the model was
performed. When training the model, with the same
architecture, but with more epochs (32 to 64), we
obtained the following results in precision and loss,
shown in Figure 10.
Although validation and training values were
close, the accuracy of the model shown in the graphs
dropped slightly, in this example reaching 0.9762 of
training accuracy and 0.9570 of validation accuracy
3
https://unsplash.com/
in its last training epoch. Subsequent tests showed
that, even increasing the number of epochs, the preci-
sion value continued to vary very close to the values
obtained in training with fewer epochs, and this infor-
mation is reinforced by the results of the model clas-
sifying test images continuing to perform similarly to
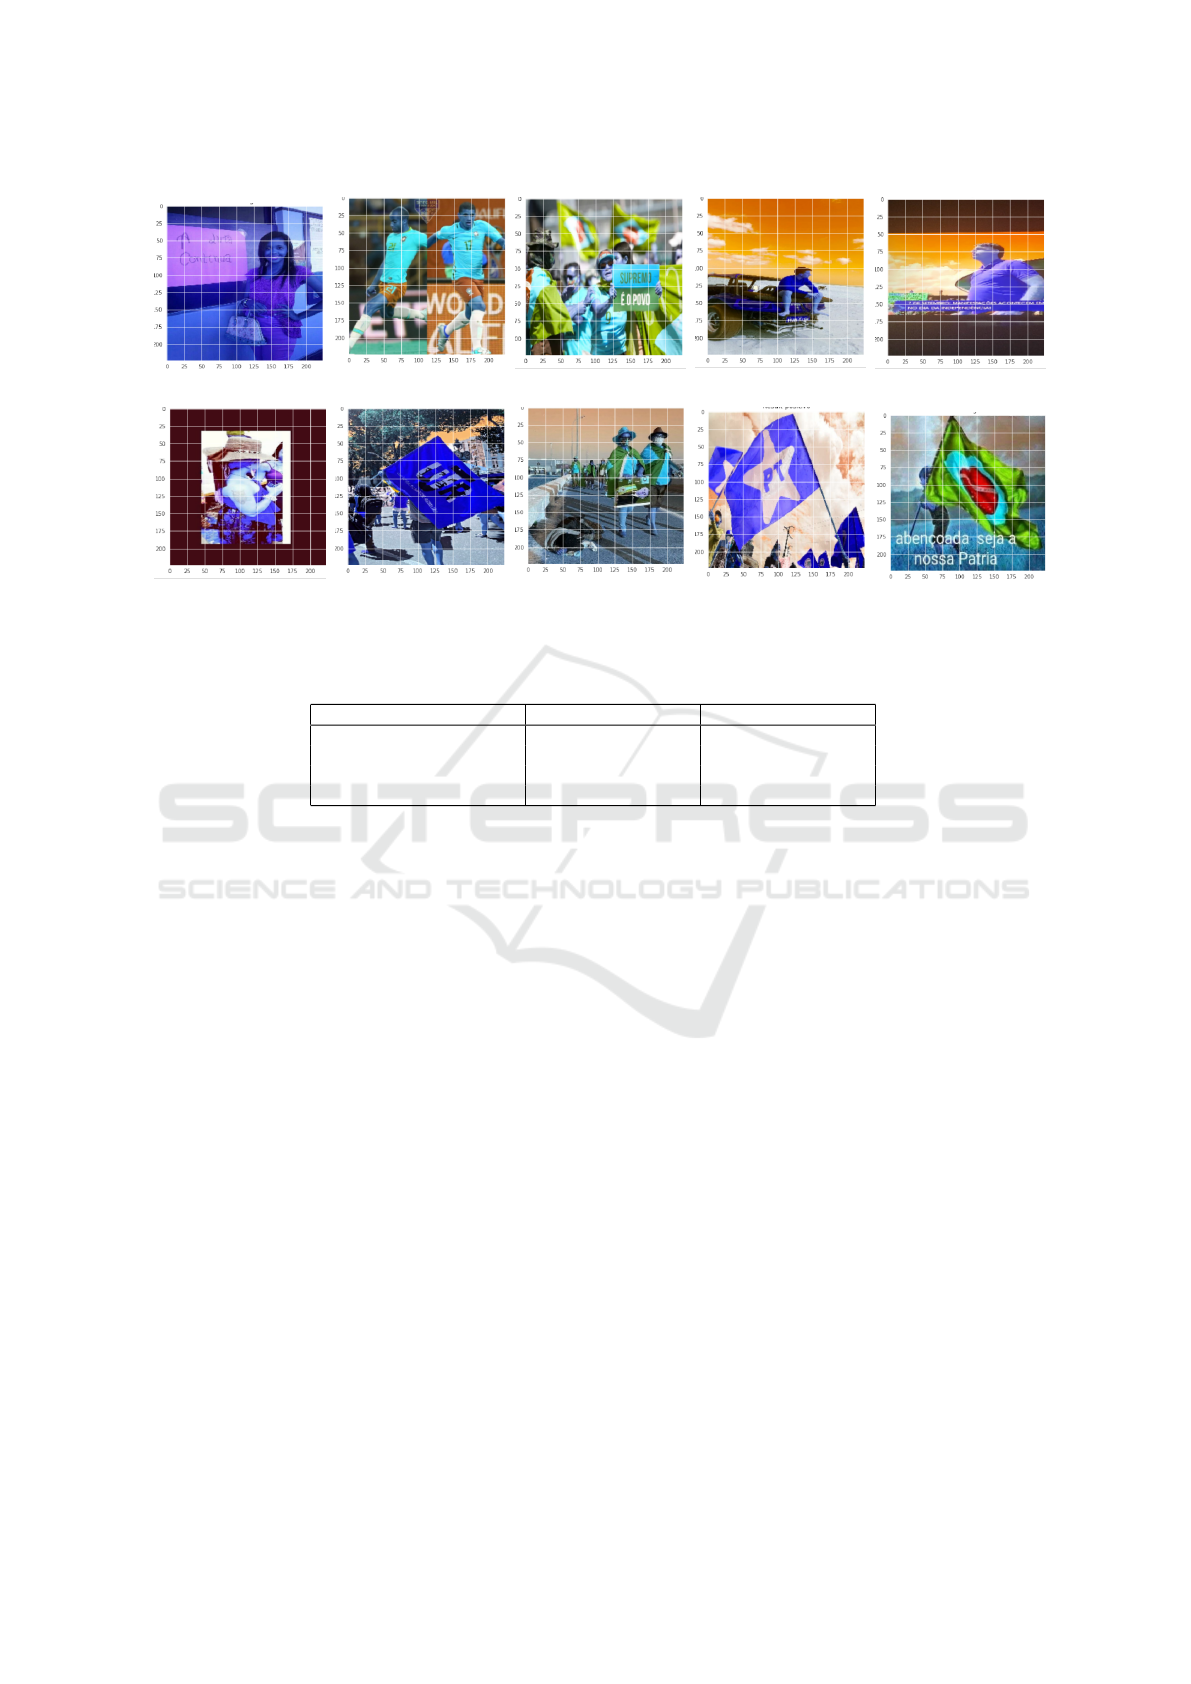
the model trained in 32 epochs, as Figure 11 shows.
In order to improve the comparison, we can also
see in Table 1 the direct comparison between the mod-
els.
This low variation leads to the conclusion that, af-
ter choosing an adequate architecture and perform-
ing refinement on the model’s training variables, what
had the most impact on the final efficiency of the
trained model was the size of the dataset on which
it was trained.
4.2 Conclusions
The results of this research show that there are several
machine learning techniques capable of serving as a
basis for the development of a prototype for identify-
ing representative images. For this work, images re-
lated to the events of the Brazilian holiday of Septem-
ber 7, 2021 were used.
During model training, it was possible to identify
that the architectures of the VGG family performed
better.
In addition, it was possible to verify the need for
a suitable dataset for training, which is large enough
for the model to obtain the characteristics of the event
that one wants to recognize.
In future work, it is possible to evaluate how much
an annotated dataset can impact the need to have a
large dataset for training. In view of the observations,
VISAPP 2024 - 19th International Conference on Computer Vision Theory and Applications
414
Figure 8: Accuracy and loss curves of the model based on the VGG-19 architecture with larger datasets and training in 32
epochs.
(a) positive (b) positive (c) positive (d) negative (e) positive
(f) negative (g) negative (h) positive (i) negative (j) negative
Figure 9: Example of classification of images obtained from the model created with the VGG-19 architecture with expanded
datasets and training in 32 epochs.
Figure 10: Accuracy and loss curves of the model based on the VGG-19 architecture with larger datasets and training in 64
epochs.
Identifying Representative Images for Events Description Using Machine Learning
415
(a) negative (b) positive (c) positive (d) negative (e) negative
(f) negative (g) positive (h) positive (i) positive (j) negative
Figure 11: Example of classification of images obtained from the model created with the VGG-19 architecture with expanded
datasets and training in 64 epochs.
Table 1: Comparison between precision and loss values between models trained with different amounts of epochs.
VGG-19 (32 epochs) VGG-19 (64 epochs)
training accuracy (max) 0.9761 0.9800
validation accuracy (max.) 0.9833 0.9648
loss of training (min.) 0.0700 0.0649
validation loss (min.) 0.0461 0.0769
the results obtained show that the solution presented
here is viable and presented good results.
ACKNOWLEDGEMENTS
This study was financed by the Conselho Nacional de
Desenvolvimento Cient
´
ıfico e Tecnol
´
ogico - CNPq.
REFERENCES
Garrett, F. O que acontece a cada minuto na internet? estudo
traz dados surpreendentes. https://www.techtudo.com
.br/noticias/2020/08/o-que-acontece-a-cada-minut
o-nainternet-estudo-traz-dados-surpreendentes.ghtm
l”.
Gupta, A., Lamba, H., and Kumaraguru, P. (2013). $1.00
per rt #bostonmarathon #prayforboston: Analyzing
fake content on twitter. In 2013 APWG eCrime Re-
searchers Summit, pages 1–12.
Hughes, A. and Palen, L. (2009). Twitter adoption and use
in mass convergence and emergency events. Inter-
national Journal of Emergency Management, 6:248–
260.
Iscen, A., Tolias, G., Avrithis, Y., Furon, T., and Chum, O.
(2019). Efficient diffusion on region manifolds: Re-
covering small objects with compact cnn representa-
tions.
Kavanaugh, A. L., Fox, E. A., Sheetz, S. D., Yang, S.,
Li, L. T., Shoemaker, D. J., Natsev, A., and Xie, L.
(2012). Social media use by government: From the
routine to the critical. Government Information Quar-
terly, 29(4):480–491. Social Media in Government -
Selections from the 12th Annual International Confer-
ence on Digital Government Research (dg.o2011).
Pedronette, D. C. G., Valem, L. P., Almeida, J.,
and da S. Torres, R. (2019). Multimedia re-
trieval through unsupervised hypergraph-based man-
ifold ranking. IEEE Transactions on Image Process-
ing, 28(12):5824–5838.
Razavian, A. S., Azizpour, H., Sullivan, J., and Carlsson,
S. (2014). CNN features off-the-shelf: an astounding
baseline for recognition.
Scheirer, W. J., de Rezende Rocha, A., Sapkota, A., and
Boult, T. E. (2013). Toward open set recognition.
IEEE Transactions on Pattern Analysis and Machine
Intelligence, 35(7):1757–1772.
Simonyan, K. and Zisserman, A. (2015). Very deep convo-
lutional networks for large-scale image recognition.
Starbird, K., Palen, L., Hughes, A. L., and Vieweg, S.
(2010). Chatter on the red: What hazards threat re-
veals about the social life of microblogged informa-
tion. In Proceedings of the 2010 ACM Conference on
Computer Supported Cooperative Work, CSCW ’10,
page 241–250, New York, NY, USA. Association for
Computing Machinery.
Zheng, L., Yang, Y., and Tian, Q. (2017). Sift meets cnn: A
decade survey of instance retrieval.
VISAPP 2024 - 19th International Conference on Computer Vision Theory and Applications
416
