Kore Initial Clustering for Unsupervised Domain Adaptation
Kyungsik Lee
a
, Youngmi Jun
b
, EunJi Kim
c
, Suhyun Kim
d
, Seong Jae Hwang
e
and Jonghyun Choi
f
Department of Artificial Intelligence, Yonsei University, Seoul, Republic of Korea
Keywords:
Unsupervised Domain Adaptation, Unlabeled Target Domain, Pseudo labels, K-means Clustering, Centroids.
Abstract:
In unsupervised domain adaptation (UDA) literature, there exists an array of techniques to derive domain
adaptive features. Among them, a particularly successful family of approaches of pseudo-labeling the unla-
beled target data has shown promising results. Yet, the majority of the existing methods primarily focus on
leveraging only the target domain knowledge for pseudo-labeling while insufficiently considering the source
domain knowledge. Here, we hypothesize that quality pseudo labels obtained via classical K-means clustering
considering both the source and target domains bring simple yet significant benefits. In particular, we propose
to assign pseudo labels to the target domain’s instances better aligned with the source domain labels by a sim-
ple method that modifies K-means clustering by emphasizing the strengthened notion of centroids, namely,
Kore Initial Clustering (KIC). The proposed KIC is readily utilizable with a wide array of UDA models, con-
sistently improving the UDA performance on multiple UDA datasets including Office-Home and Office-31,
demonstrating the efficacy of pseudo labels in UDA.
1 INTRODUCTION
Unsupervised Domain Adaptation (UDA), a learning
framework that focuses on leveraging labeled source
domain data to enhance the performance of unlabeled
target domain data, has gained significant attention in
recent literature for its benefit of not having super-
vision in target domain (Liu et al., 2022; Ren et al.,
2022; Lee et al., 2022; Xie et al., 2022). The UDA
scenario is especially beneficial in situations where
labeling costs are high or labeling itself is unfeasi-
ble (Tarvainen and Valpola, 2017). The fundamental
premise of UDA lies in minimizing the distribution
difference between the source and target domains.
Nevertheless, prior arts in UDA task have a number
of disadvantages as follows:
First, many conventional methods in UDA re-
quired complex optimization processes or tuning of
multiple hyperparameters (Sun and Saenko, 2016).
This complexity posed challenges for researchers
and practitioners in real-world applications. Second,
a
https://orcid.org/0009-0004-2666-6975
b
https://orcid.org/0009-0008-4691-3610
c
https://orcid.org/0009-0002-1383-5683
d
https://orcid.org/0009-0008-7561-066X
e
https://orcid.org/0000-0002-3713-5553
f
https://orcid.org/0000-0002-7934-8434
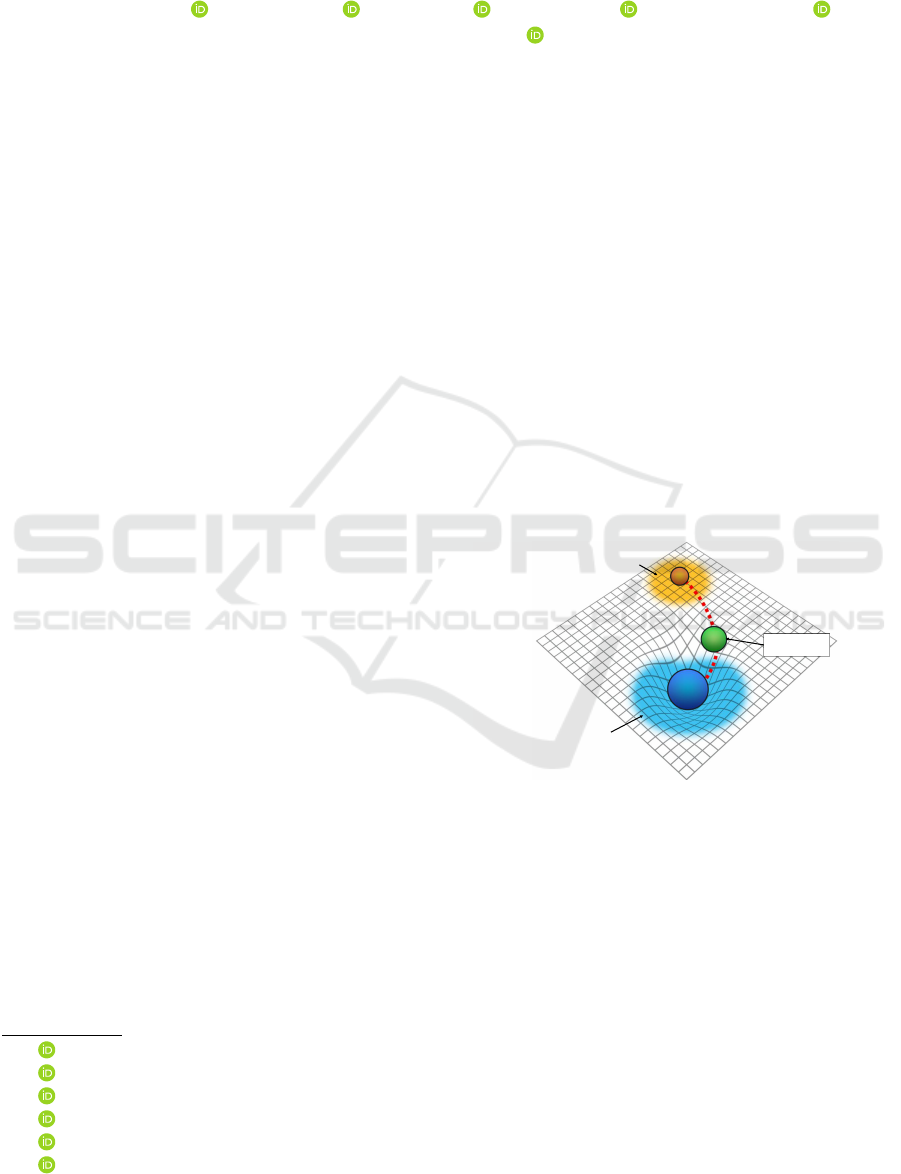
Source
Domain
Initial Centroids
for Clustering
Target
Domain
Figure 1: Illustration of how the KIC module creates initial
centroids that are weighted towards the source domain in
preparation for K-means clustering. Through weighted lin-
ear interpolation, we induce a virtual gravitational force that
acts as a domain alignment catalyst, optimizing the place-
ment of centroids in the proximity of the source domain.
This process helps improve initialization for K-means clus-
tering and enhances domain bridging between the source
and target domains.
while most existing methods solely focused on mini-
mizing the distribution difference between the source
and target domains, this did not always guarantee
optimal performance. Especially when there was a
substantial distribution difference between domains,
such approaches proved to be inefficient (Tzeng et al.,
2017). Finally, recent UDA studies have indeed
paid attention to domain adaptation through cluster-
Lee, K., Jun, Y., Kim, E., Kim, S., Hwang, S. and Choi, J.
Kore Initial Clustering for Unsupervised Domain Adaptation.
DOI: 10.5220/0012353200003660
Paper published under CC license (CC BY-NC-ND 4.0)
In Proceedings of the 19th International Joint Conference on Computer Vision, Imaging and Computer Graphics Theory and Applications (VISIGRAPP 2024) - Volume 2: VISAPP, pages
425-432
ISBN: 978-989-758-679-8; ISSN: 2184-4321
Proceedings Copyright © 2024 by SCITEPRESS – Science and Technology Publications, Lda.
425
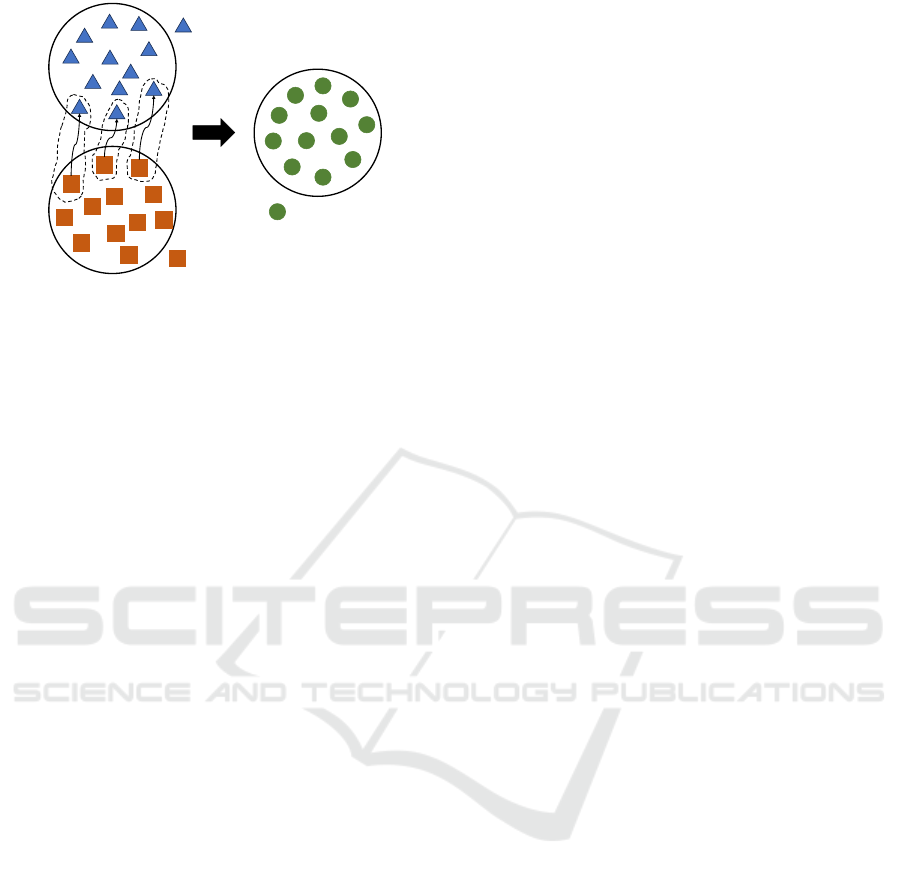
Source
Target
Bounding
Initial Centroids
Figure 2: Illustration of how initial points from the source
and target domains are bounded to create the initial cen-
troids utilized for K-means clustering.
ing. However, the majority of these studies only con-
sidered clustering in the target domain space (Luo
et al., 2017). The essence of clustering in the source
domain was largely overlooked, limiting the overall
inter-domain interactions and information transfer.
These challenges have constrained the efficiency
of UDA in real-world applications. We propose a
new approach to overcome these limitations, specif-
ically using a customized domain alignment method
(Fig. 1), and validate its effectiveness through experi-
ments. In particular, we first input both samples from
the source and target data into our pre-trained model
backbone to extract features, target predictions, and
source predictions. We then perform linear interpola-
tion on the source and target data to determine the ini-
tial centroids for clustering (Fig. 2). During this pro-
cess, by applying a bias toward the source initial point
in the linear interpolation using weights, we manage
to address the previously mentioned problems, lead-
ing to improved performance. Despite the simplic-
ity, the proposed method consistently improves the
performance of the state-of-the-art UDA method PM-
Trans (Zhu et al., 2023) with varying backbones.
We summarize our contributions as follows:
• We have proposed the Kore Initial Clustering
(KIC) module, an enhancement over the tradi-
tional K-means approach, offering advanced clus-
tering capabilities for UDA.
• Our model is seamlessly integrable with various
UDA models based on ViT backbones (Zhu et al.,
2023).
• In our empirical validation, the proposed method
improves UDA performance on top of the state of
the art methods.
2 RELATED WORKS
Unsupervised Domain Adaptation. UDA aims to
minimize the distributional difference between la-
beled data from a source domain and unlabeled data
from a target domain (Ganin and Lempitsky, 2015;
Xu et al., 2021; Sun et al., 2022). The main intention
of UDA is to overcome the distributional discrepancy
between these domains. To address this challenge,
we have a variety of strategies. One method involves
matching the higher-order statistics of features from
both domains, thereby reducing their distributional di-
vergence (Long et al., 2015). Another method ensures
consistency in the prediction results of both source
and target domain data, thereby bridging the domain
gap (French et al., 2017). Lastly, pseudo-labeling in-
volves creating synthetic labels for unlabeled data in
the target domain. Using these pseudo-labels, models
are retrained, which have shown efficacy in several
UDA models (Saito et al., 2018). Despite these ad-
vancements, real-world domain disparities continue
to manifest in diverse manners, posing a persistent
challenge in UDA research.
Vision Transformer. Recently, the trend in the
computer vision field has been showing a shift from
traditional convolutional neural networks (CNNs) to
the transformer structure, originally designed for nat-
ural language processing tasks. Among these, the Vi-
sion Transformer (ViT) introduced by Dosovitskiy et
al. (Dosovitskiy et al., 2020) is considered a rep-
resentative study. While traditional CNNs process
images in a local and hierarchical manner, ViT di-
vides the image into patches of fixed size, linearly
embeds them, and then processes the sequence of em-
bedded patches through transformer blocks (Carion
et al., 2020). In UDA, reducing the distribution dif-
ference between the source and target domains (Du
et al., 2021) is crucial, and the attention mechanism
of ViT is better capturing and adapting to these do-
main differences. Specifically, ViT can focus atten-
tion on distant parts of an image regardless of spatial
proximity, making it advantageous in detecting subtle
differences between domains. After the initial success
of ViT, various modifications have been proposed to
optimize and apply its structure to different tasks and
constraints (Touvron et al., 2021). Proposed by Liu
et al. (Liu et al., 2021), the Swin Transformer di-
vides images into non-overlapping windows and per-
forms self-attention operations only within these win-
dows, reducing computational load while capturing
domain differences more finely. Yet, even with the ad-
vancements brought by the Swin Transformer, there
remains challenges, especially in the context of UDA.
VISAPP 2024 - 19th International Conference on Computer Vision Theory and Applications
426

Pseudo-Label. Pseudo-labeling is a method of as-
signing temporary labels to unlabeled data based on
model predictions. Because in UDA, it is essential to
reduce the distribution discrepancy between labeled
data from the source domain and unlabeled data from
the target domain, pseudo-labeling provides a means
to fine-tune these domain differences by assigning la-
bels to the data in the target domain. (Ben-David
et al., 2006). Pseudo-labeling can refine this domain
alignment by providing labels to the target domain’s
data. The basic approach using pseudo-labels in-
volves generating predictions for the unlabeled data
in the target domain using an initially trained model.
The model makes these predictions as new labels and
then re-trains in an iterative process. This approach
aids the model in extracting information from the
target domain’s data in UDA scenarios (Saito et al.,
2017). We generate pseudo-labels on the target sam-
ples with a bias towards the source domain using a
customized initial centroid computation for solving
the UDA problem. This method proves effective in
achieving high performance with data that has intri-
cate domain characteristics or complex distributions.
Centroid of Clustering. The choice of initial cen-
troids can significantly affect the convergence and
quality of the clustering results. In UDA as well, it is
essential to reduce the distributional discrepancy be-
tween the source and target domains (Zhang and Lee,
2022). To address this, a method combining Self-
Supervised Learning (SSL) and clustering to generate
anchor vectors or cluster centroids has been proposed
(Mahapatra et al., 2022). These anchor vectors play a
pivotal role in bridging the gap between the known
classes (seen classes) from the source domain and
the unknown classes (unseen classes) from the tar-
get domain. The research emphasizes the importance
of having accurate anchor vectors to solve the UDA
problem and introduces self-supervised loss terms to
ensure the uniqueness and consistency of these vec-
tors. Additionally, to provide focused attention to
the data from the target domain during the clustering
phase, the research integrates saliency maps, enhanc-
ing the quality of information derived from image fea-
tures. Based on the potential of centroid clustering to
facilitate domain alignment, we believed that apply-
ing it to UDA could yield promising outcomes.
3 METHODS
In this section, we first investigate pseudo-labeling for
unsupervised domain adaptation. Then we discuss the
issues associated with K-means clustering and the ini-
tialization of centroids. Finally, we describe the pro-
posed method named Kore Initial Clustering (KIC)
which aligns the source and target domains by esti-
mating initial centroids in clustering for cross-domain
adaptation.
3.1 Pseudo-Labeling
Unsupervised Domain Adaptation (UDA) typically
involves transferring knowledge from a labeled
source domain to an unlabeled target domain. Pseudo
labeling helps create a form of pseudo-supervision
in the target domain by assigning labels to unlabeled
data based on the predictions of the model trained on
the source domain. One common challenge in UDA
is obtaining reliable pseudo-labels for unlabeled data
in the target domain. A weighted clustering strat-
egy is a technique that assigns different weights to
data points during the pseudo-labeling process, aim-
ing to improve the overall reliability of the assigned
labels. In this paper, we use a weighted clustering
strategy (Du et al., 2021) to obtain the centroid c
k
of
the k-th class. Suppose that we have feature extrac-
tor G, classifier F
n
and n
t
unlabeled target samples
{x
t
i
}
n
t
n=1
drawn from the target distribution χ
t
:
c
k
=
∑
2
n=1
∑
x
t
i
∈χ
t
δ
k
(F
n
(G(x
t
i
)))G(x
t
i
)
∑
2
n=1
∑
x
t
i
∈χ
t
δ
k
(F
n
(G(x
t
i
)))
, (1)
where δ
k
represents the corresponding k-th element
of the softmax output δ. Then, pseudo labels could be
obtained by the nearest centroid strategy.
3.2 K-means Clustering
Clustering-based pseudo-labeling (Lee, 2013) is a
technique used in machine learning to generate labels
for unlabeled data points by first clustering the data
and then assigning labels based on the clusters. A
widely adopted methodology in UDA involves the in-
tegration of clustering algorithms, such as K-means
clustering (MacQueen et al., 1967), in conjunction
with pseudo-labeling. This combined approach is em-
ployed to effectively leverage the untapped potential
residing within the unlabeled data of the target do-
main. K-means clustering is popular in UDA for sev-
eral reasons: its simplicity makes it easy to under-
stand and implement, and it can be easily integrated
into the UDA pipeline. In K-means clustering, the al-
gorithm aims to partition a given dataset into K clus-
ters, where each cluster is represented by its centroid.
The centroid initialization step plays a crucial role in
the performance and convergence of the algorithm.
The choice of initial centroids can significantly im-
pact the clustering results, as poorly selected initial
Kore Initial Clustering for Unsupervised Domain Adaptation
427
Supervised Loss
Weighted Cross
Entropy Loss
Pseudo Labels
Source Initial
Points
Target Initial
Points
Linear interpolation
Source Ground-truth Label
weighted
Source Domain
Target Domain
Input
Features/
Logits
Transformer
KIC
Classifier
…
K-means
Estimated Target
Initial Centroids
Emb
Emb
Weighted Clustering
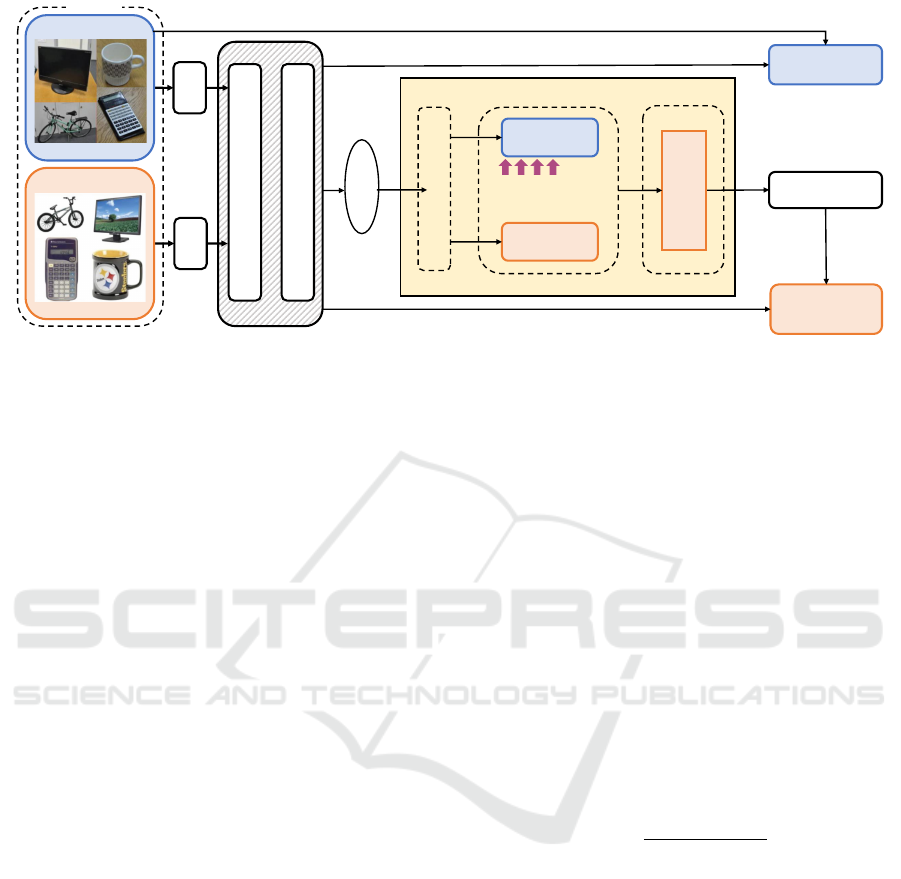
Figure 3: An overview of our proposed framework. Both source samples and target samples are passed through an embedding
layer respectively consisting of both patch embeddings and positional embeddings. Then the resulting source and target
data are passed into the backbone model for training and evaluation. The KIC module, consisting of linear interpolation of
the source and target points - weighted towards the source points - is performed on the features/logits extracted from the
evaluated results to create initial centroids for K-means clustering. The pseudo-labels created from the K-means clustering
are then compared to the target prediction labels to calculate a weighted cross entropy loss.
centroids can lead to suboptimal clustering. Random
initialization in K-means randomly selects K data
points as initial centroids, but it can be sensitive to
the random seed and produce different outcomes for
different runs. On the other hand, K-means++ initial-
ization (Arthur and Vassilvitskii, 2007) improves ran-
dom initialization by selecting centroids based on the
distance to the nearest centroid. While K-means++
initialization generally produces improved clustering
results compared to random initialization, it does not
take advantage of any available source domain knowl-
edge to estimate initial centroids for clustering in the
target domain. To address this, in our study, we pro-
pose a method utilizing K-means clustering to refine
the pseudo-labeling process further.
3.3 Weighted Cross Entropy
A recurring challenge arises when distinguishing be-
tween source and target domains. Specifically, while
the source and target might be rendered indistinguish-
able through alignment techniques, there’s no guaran-
tee that the data points from these domains will cluster
densely. This sparse clustering can hinder the model’s
ability to discriminate between different classes effec-
tively. Recognizing this limitation, we propose a sub-
tle approach: the incorporation of a weighted cross-
entropy loss. The weighted cross entropy loss in-
creases the shared information between the observed
distribution of target inputs and the pseudo-label dis-
tribution (Prabhu et al., 2021).
The essence of this loss function lies in its ability
to capture the uncertainty associated with each pre-
diction. Entropy, a well-established measure of un-
certainty in probability distributions, is leveraged for
this purpose. For a given sample k, its entropy is
H(p
(k)
) = −
∑
i
p
(k)
i
log(p
(k)
i
), (2)
where p
(k)
i
represents the predicted probabilities for
each class i by sample k.
Drawing from this entropy calculation, we assign
a weight to each sample. The underlying idea is
to give more importance to samples that the model
deems challenging or is less certain about. Thus, the
normalized weight w
k
for sample k is defined as
w
k
=
1 + e
−H(p
(k)
)
∑
j
1 + e
−H(p
( j)
)
. (3)
This ensures that samples characterized by higher
entropy (and thus, greater uncertainty) are assigned
more substantial weights. By balancing the conven-
tional cross-entropy loss with these weights, we cre-
ate a loss function that dynamically adjusts based on
the model’s confidence in its predictions.
By adopting this weighted cross-entropy loss, we
provide the model with a refined training signal. This
encourages the model to pay heightened attention to
challenging samples, thereby increasing its robust-
ness. This enhancement is important when dealing
with diverse data sources, as it supports better gener-
alization and adaptability across different domains.
VISAPP 2024 - 19th International Conference on Computer Vision Theory and Applications
428

Table 1: Comparison with SoTA methods on Office-Home. * indicates the results of experiments where the batch size was
adjusted to 16, deviating from the original experimental setup. The best performance is marked as bold.
Method A→C A→P A→R C→A C→P C→R P→A P→C P→R R→A R→C R→P Avg
ResNet-50 (He et al., 2016)
ResNet
44.9 66.3 74.3 51.8 61.9 63.6 52.4 39.1 71.2 63.8 45.9 77.2 59.4
MCD (Saito et al., 2018) 48.9 68.3 74.6 61.3 67.6 68.8 57.0 47.1 75.1 69.1 52.2 79.6 64.1
BNM (Cui et al., 2020) 56.7 77.5 81.0 67.3 76.3 77.1 65.3 55.1 82.0 73.6 57.0 84.3 71.1
TVT (Yang et al., 2023)
ViT
74.9 86.8 89.5 82.8 88.0 88.3 79.8 71.9 90.1 85.5 74.6 90.6 83.6
CDTrans (Xu et al., 2021) 68.8 85.0 86.9 81.5 87.1 87.3 79.6 63.3 88.2 82.0 66.0 90.6 80.5
PMTrans-ViT (Zhu et al., 2023) 81.2 91.6 92.4 88.9 91.6 93.0 88.5 80.0 93.4 89.5 82.4 94.5 88.9
PMTrans-ViT + KIC* 81.5 92.7 92.6 89.1 91.5 93.2 87.8 81.0 93.2 89.6 83.3 94.7 89.2
PMTrans-ViT + KIC 81.6 92.4 92.5 89.6 91.6 93.0 88.8 81.3 93.4 90.4 82.9 94.6 89.3
PMTrans-Swin (Zhu et al., 2023)
Swin
81.3 92.9 92.8 88.4 93.4 93.2 87.9 80.4 93.0 89.0 80.9 94.8 89.0
PMTrans-Swin + KIC* 81.4 92.7 93.0 89.0 93.5 93.1 87.5 80.8 93.2 88.9 80.9 94.7 89.0
3.4 Kore Initial Clustering
In this work, our goal is to address the potential draw-
backs associated with the clustering-based pseudo-
labeling described in Section 3.2 by estimating initial
centroids for target domain using linear interpolation
toward source domain. To achieve this objective, We
introduce the Kore Initial Clustering (KIC) method,
considering its applicability to a broad Unsupervised
Domain Adaptation (UDA) framework. An overview
of our proposed approach is illustrated in Fig. 3. The
training procedure consists of four steps:
(1) Initial Points. Utilizing features and logits from
the UDA framework, initial points for each domain
are computed using weighted clustering (Equation 1).
(2) Initial Centroids. Initial centroids are created by
combining information from both the source and tar-
get domains. This is achieved through linear interpo-
lation, where the initial points from each domain are
linearly combined using the equation:
c
k
= αc
t
k
+ (1 − α)c
s
k
, (4)
Here, c
t
k
and c
s
k
represent the initial points of the k-th
class for the target and source domains respectively,
and α is the interpolation factor. In our model, we
set α to be more biased towards source domain with a
weight of 0.9.
(3) Pseudo-Labeling with K-means. K-means clus-
tering, using estimated initial centroids for the target
domain, is employed for pseudo-labeling. This en-
sures that labels are derived from the inherent struc-
ture of the data in the feature space. This approach
provides a more informed way of labeling target do-
main data compared to using the existing K-means
clustering method with random initialization for cen-
troids.
(4) Loss Calculation. Finally, the pseudo-labels gen-
erated from the K-means clustering are compared to
the target prediction labels to calculate a weighted
cross-entropy loss.
Table 2: Comparison with SOTA methods on Office-31. *
indicates the results of experiments where the batch size
was adjusted to 16, deviating from the original experimen-
tal setup. The best performance is marked as bold.
Method A→W D→W W→D A→D D→A W→A Avg
ResNet-50 (He et al., 2016)
ResNet
68.9 68.4 62.5 86.7 60.7 99.3 76.1
BNM (Cui et al., 2020) 91.5 98.5 100.0 90.3 70.9 71.6 87.1
MDD (Zhang et al., 2019) 84.5 98.4 100.0 93.5 74.6 72.2 88.9
TVT (Yang et al., 2023)
ViT
96.4 99.4 100.0 96.4 84.9 86.0 93.9
CDTrans (Xu et al., 2021) 96.7 99.0 100.0 97.0 81.1 81.9 92.6
PMTrans-ViT (Zhu et al., 2023) 99.1 99.6 100.0 99.4 85.7 86.3 95.0
PMTrans-ViT + KIC* 97.7 99.4 100.0 99.2 86.3 86.8 94.9
PMTrans-ViT + KIC 99.2 99.8 100.0 99.8 86.6 86.8 95.4
PMTrans-Swin (Zhu et al., 2023)
Swin
99.5 99.4 100.0 99.8 86.7 86.5 95.3
PMTrans-Swin + KIC* 99.5 99.4 100.0 99.6 86.7 86.9 95.3
After repeating the above steps, the model can ef-
fectively align the distributions of two domains. As
we describe in the next section, achieving alignment
of features from different domains is crucial for effec-
tive knowledge transfer. The Kore Initial Clustering
(KIC) module aims to tackle this challenge by reli-
ably estimating initial centroids for clustering through
linear interpolation.
4 EXPERIMENTS AND RESULTS
To confirm the robustness and efficacy of our pro-
posed model, we conduct experiments on preva-
lent benchmark datasets, including Office-Home
(Venkateswara et al., 2017), Office-31 (Saenko et al.,
2010) and VisDA-2017 (Peng et al., 2017).
4.1 Implementation Details
We utilized the same backbone that was originally
employed in previous experiments for our study. For
PMTrans (Zhu et al., 2023), we use the Swin-based
transformer (Liu et al., 2021) pre-trained on ImageNet
(Deng et al., 2009) as the backbone which was used
in their experiments. We experimented with two batch
sizes, 16 and 32, for ViT-based PMTrans. However,
we used a size of batch 16 for Swin-based method
due to resource limitations. With the exception of a
batch size, we used the original paper’s settings such
Kore Initial Clustering for Unsupervised Domain Adaptation
429

Table 3: Comparison with SOTA methods on VisDA-2017. * indicates the results of experiments where the batch size was
adjusted to 16, deviating from the original experimental setup. The best performance is marked as bold.
Method plane bcycl bus car horse knife mcycl person plant sktbrd train truck Avg
ResNet-50 (He et al., 2016)
ResNet
55.1 55.3 61.9 59.1 80.6 17.9 79.7 31.2 81.0 26.5 73.5 8.5 52.4
BNM (Cui et al., 2020) 89.6 61.5 76.9 55.0 89.3 69.1 81.3 65.5 90.0 47.3 89.1 30.1 70.4
MCD (Saito et al., 2018) 87.0 60.9 83.7 64.0 88.9 79.6 84.7 76.9 88.6 40.3 83.0 25.8 71.9
TVT (Yang et al., 2023)
ViT
82.9 85.6 77.5 60.5 93.6 98.2 89.4 76.4 93.6 92.0 91.7 55.7 83.1
CDTrans (Xu et al., 2021) 97.1 90.5 82.4 77.5 96.6 96.1 93.6 88.6 97.9 86.9 90.3 62.8 88.4
PMTrans-ViT (Zhu et al., 2023) 98.9 93.7 84.5 73.3 99.0 98.0 96.2 67.8 94.2 98.4 96.6 49.0 87.5
PMTrans-ViT + KIC* 99.6 96.2 88.0 45.7 99.2 98.4 94.5 19.5 98.8 98.7 96.8 58.3 82.8
PMTrans-ViT + KIC 99.3 97.3 88.4 62.6 99.1 98.6 93.1 60.3 98.0 99.3 97.2 59.2 87.7
PMTrans-Swin (Zhu et al., 2023)
Swin
99.4 88.3 88.1 78.9 98.8 98.3 95.8 70.3 94.6 98.3 96.3 48.5 88.0
PMTrans-Swin + KIC* 99.3 93.3 88.2 67.8 99.1 98.9 96.4 65.2 97.4 99.1 97.0 57.5 88.3
as learning rate, the number of epochs, weight decay,
and the optimizer. For each experiment, we utilized a
single NVIDIA GeForce RTX 3090 GPU.
4.2 Results
We combine KIC module with the latest SOTA UDA
method PMTrans (Zhu et al., 2023). Here we show
the comparison between the original SOTA methods
and the combination of KIC module with PMTrans.
Note that, for a fair comparison, we utilized the results
from the original papers.
Result on Office-Home. We summarize the results
in Table 1. The proposed method excels particularly
in improving performance in challenging domains
where the accuracy predominantly lies in the mid-
to-high 80s. Surprisingly, for P→C, we observed a
dramatic improvement of 1.3% and it achieves SOTA
performance. Domains that are difficult to adopt such
as R→C and A→C achieve 0.9% and 0.4% improve-
ments respectively compared to the existing SOTA
method. Despite halving the batch size compared to
the original paper, A→P demonstrated a performance
boost of 1.1%. Likewise, R→A also showed an im-
provement of 0.9%. For the Swin-based PMTrans,
training was conducted with a batch size of 32 in orig-
inal paper, whereas our method utilized a batch size of
16. Despite this discrepancy, we achieved a 0.6% ac-
curacy enhancement in C→A. In general, integrating
UDA with our proposed approach significantly ele-
vates classification accuracy across nearly all classes.
Result on Office-31. We summarize the results in
Table 2. The proposed method achieves an average
accuracy of 95.4% by increasing 0.4% compared to
the existing SOTA method with the ViT-based ap-
proach. Similar to the results on Office-Home, the
most significant improvements were noted in the most
challenging classes such as D→A which improves
0.9% accuracy. For W→A, both ViT-based and Swin-
based approaches, even when using a smaller batch
size of 16 compared to the original paper, the pro-
posed method achieves 0.5% and 0.4% improvement
respectively.
Result on VisDA-2017. We summarize the results
in Table 3. The proposed method improves an aver-
age accuracy of 88.3% by 0.4%. As observed, truck
showed an 59.2% accuracy by improving 10.2% with
ViT-based approach. We observed a 5% improvement
in the performance on bicycles, reaching an accuracy
of 93.3% and 2.8% improvement in plants with the
Swin-based approach. Similarly, with the Vit-based
approach, the enhancements were 3.6% and 4.6% re-
spectively.
Resource Efficiency. The proposed method im-
proves classification accuracy and also increases run-
time efficiency and training speed. According to the
PMTrans (Zhu et al., 2023), larger batch sizes lead
to better representation of data distributions, typically
resulting in superior performance in UDA tasks when
using the PMTrans with various backbones. However,
in our case, despite utilizing smaller batch sizes, we
achieved superior performance. It demonstrates the
effectiveness of the proposed method.
4.3 Ablation Study
Comparison with K-means and KIC. In this ab-
lation study, we empirically validate that a standlone
K-means clustering with random initial centroids can-
not guarantee robust improvements; instead, a care-
fully designed initial centroid based on our KIC is a
must. Specifically, we compare (1) PMTrans-ViT, (2)
PMTrans-ViT + K-means which uses random initial
centroids, and (3) PMTrans-ViT + KIC which uses
our KIC centroids in Table 4 and Table 5. In Table 4
showing the results on Office-Home, we observe that
PMTrans-ViT + K-means (89.2%) with random ini-
tial centroids do outperform the baseline PMTrans-
ViT (88.9%) with no clustering, our PMTrans-ViT +
KIC (89.3%) brings the best result on average. In ad-
dition, we see even more drastic boost from KIC on
Office-31 in Table 5, where PMTrans-ViT + K-means
VISAPP 2024 - 19th International Conference on Computer Vision Theory and Applications
430

Table 4: The ablation study comparing the K-means with random initial centroids (PMTrans-ViT + K-means) and ours with
KIC (PMTrans-ViT + KIC) on Office-Home. The best performance is marked as bold. We observe that the K-means with
our domain adaptive KIC centroids lead to the best performance, and the K-means alone, while improving over the baseline
(PMTrans-ViT), cannot.
Method A→C A→P A→R C→A C→P C→R P→A P→C P→R R→A R→C R→P Avg
PMTrans-ViT (Zhu et al., 2023) 81.2 91.6 92.4 88.9 91.6 93.0 88.5 80.0 93.4 89.5 82.4 94.5 88.9
PMTrans-ViT + K-means 81.2 92.5 92.6 89.0 91.8 92.8 88.5 80.6 93.3 90.0 82.8 94.7 89.2
PMTrans-ViT + KIC 81.6 92.4 92.5 89.6 91.6 93.0 88.8 81.3 93.4 90.4 82.9 94.6 89.3
Table 5: The ablation study comparing the K-means with
random initial centroids (PMTrans-ViT + K-means) and
ours with KIC (PMTrans-ViT + KIC) on Office-31. The
best performance is marked as bold. Similar to the results
on Office-Home, we observe the significance of KIC.
Method A→W D→W W→D A→D D→A W→A Avg
PMTrans-ViT (Zhu et al., 2023) 99.1 99.6 100.0 99.4 85.7 86.3 95.0
PMTrans-ViT + K-means 99.0 99.5 100.0 99.4 85.7 86.2 94.9
PMTrans-ViT + KIC 99.2 99.8 100.0 99.8 86.6 86.8 95.4
(94.9%) brings no improvements over PMTrans-ViT
(95.0%) but PMTrans-ViT + KIC (95.4%) made a sig-
nificant improvement in every transfer setting.
5 CONCLUSION
In this work, we proposed a simple yet effective so-
lution named KIC to derive domain adaptive initial
centroids for K-means clustering which demonstrated
robust performance on multiple UDA datasets. The
underlying premise of KIC is to utilize the pseudo la-
bels of the target data to pull the target initial cen-
troids towards the source initial centroids. Our work
naturally comes with a great versatility which can be
easily added to existing UDA methods as we have
shown and lead to SOTA results on multiple datasets.
Thus, further research is needed to determine the rel-
evance of our study to other clustering methods. We
believe there exist an array of future work including
improved pseudo label generation and the consider-
ation of more advanced clustering techniques which
may further benefit from our KIC module.
ACKNOWLEDGEMENT
This work was partially supported by the Institute
of Information & communications Technology Plan-
ning & Evaluation (IITP) grant funded by the Ko-
rea government (MSIT) (Artificial Intelligence Grad-
uate School Program, Yonsei University, under Grant
2020-0-01361)) and the Yonsei University Research
Fund of 2023 (2023-22-0079). We acknowledge the
use of ChatGPT, a language model developed by Ope-
nAI based on the GPT-3.5 and GPT-4 architecture to
draft the initial version of the manuscript.
REFERENCES
Arthur, D. and Vassilvitskii, S. (2007). K-means++: The
advantages of careful seeding. In Proceedings of the
Eighteenth Annual ACM-SIAM Symposium on Dis-
crete Algorithms, page 1027–1035.
Ben-David, S., Blitzer, J., Crammer, K., and Pereira, F.
(2006). Analysis of representations for domain adap-
tation. Advances in neural information processing sys-
tems, 19.
Carion, N., Massa, F., Synnaeve, G., Usunier, N., Kirillov,
A., and Zagoruyko, S. (2020). End-to-end object de-
tection with transformers. In European conference on
computer vision, pages 213–229. Springer.
Cui, S., Wang, S., Zhuo, J., Li, L., Huang, Q., and Tian,
Q. (2020). Towards discriminability and diversity:
Batch nuclear-norm maximization under label insuf-
ficient situations. In Proceedings of the IEEE/CVF
conference on computer vision and pattern recogni-
tion, pages 3941–3950.
Deng, J., Dong, W., Socher, R., Li, L.-J., Li, K., and Fei-
Fei, L. (2009). Imagenet: A large-scale hierarchical
image database. In 2009 IEEE conference on com-
puter vision and pattern recognition, pages 248–255.
Ieee.
Dosovitskiy, A., Beyer, L., Kolesnikov, A., Weissenborn,
D., Zhai, X., Unterthiner, T., Dehghani, M., Minderer,
M., Heigold, G., Gelly, S., et al. (2020). An image is
worth 16x16 words: Transformers for image recogni-
tion at scale. arXiv preprint arXiv:2010.11929.
Du, Z., Li, J., Su, H., Zhu, L., and Lu, K. (2021). Cross-
domain gradient discrepancy minimization for unsu-
pervised domain adaptation. In Proceedings of the
IEEE/CVF conference on computer vision and pattern
recognition, pages 3937–3946.
French, G., Mackiewicz, M., and Fisher, M. (2017). Self-
ensembling for visual domain adaptation. arXiv
preprint arXiv:1706.05208.
Ganin, Y. and Lempitsky, V. (2015). Unsupervised do-
main adaptation by backpropagation. In International
conference on machine learning, pages 1180–1189.
PMLR.
He, K., Zhang, X., Ren, S., and Sun, J. (2016). Deep resid-
ual learning for image recognition. In Proceedings of
the IEEE conference on computer vision and pattern
recognition, pages 770–778.
Lee, D.-H. (2013). Pseudo-label : The simple and efficient
semi-supervised learning method for deep neural net-
works. ICML 2013 Workshop : Challenges in Repre-
sentation Learning (WREPL).
Kore Initial Clustering for Unsupervised Domain Adaptation
431

Lee, J., Jung, D., Yim, J., and Yoon, S. (2022). Confidence
score for source-free unsupervised domain adaptation.
In International Conference on Machine Learning,
pages 12365–12377. PMLR.
Liu, X., Yoo, C., Xing, F., Oh, H., El Fakhri, G., Kang, J.-
W., Woo, J., et al. (2022). Deep unsupervised domain
adaptation: A review of recent advances and perspec-
tives. APSIPA Transactions on Signal and Information
Processing, 11(1).
Liu, Z., Lin, Y., Cao, Y., Hu, H., Wei, Y., Zhang, Z., Lin,
S., and Guo, B. (2021). Swin transformer: Hierar-
chical vision transformer using shifted windows. In
Proceedings of the IEEE/CVF international confer-
ence on computer vision, pages 10012–10022.
Long, M., Cao, Y., Wang, J., and Jordan, M. (2015). Learn-
ing transferable features with deep adaptation net-
works. In International conference on machine learn-
ing, pages 97–105. PMLR.
Luo, B., Feng, Y., Wang, Z., Zhu, Z., Huang, S., Yan, R.,
and Zhao, D. (2017). Learning with noise: Enhance
distantly supervised relation extraction with dynamic
transition matrix. arXiv preprint arXiv:1705.03995.
MacQueen, J. et al. (1967). Some methods for classification
and analysis of multivariate observations. In Proceed-
ings of the fifth Berkeley symposium on mathematical
statistics and probability, volume 1, pages 281–297.
Oakland, CA, USA.
Mahapatra, D., Ge, Z., and Reyes, M. (2022). Self-
supervised generalized zero shot learning for med-
ical image classification using novel interpretable
saliency maps. IEEE Transactions on Medical Imag-
ing, 41(9):2443–2456.
Peng, X., Usman, B., Kaushik, N., Hoffman, J., Wang,
D., and Saenko, K. (2017). Visda: The vi-
sual domain adaptation challenge. arXiv preprint
arXiv:1710.06924.
Prabhu, V., Khare, S., Kartik, D., and Hoffman, J. (2021).
Sentry: Selective entropy optimization via committee
consistency for unsupervised domain adaptation. In
Proceedings of the IEEE/CVF International Confer-
ence on Computer Vision, pages 8558–8567.
Ren, C.-X., Liu, Y.-H., Zhang, X.-W., and Huang, K.-K.
(2022). Multi-source unsupervised domain adaptation
via pseudo target domain. IEEE Transactions on Im-
age Processing, 31:2122–2135.
Saenko, K., Kulis, B., Fritz, M., and Darrell, T. (2010).
Adapting visual category models to new domains.
In Computer Vision–ECCV 2010: 11th European
Conference on Computer Vision, Heraklion, Crete,
Greece, September 5-11, 2010, Proceedings, Part IV
11, pages 213–226. Springer.
Saito, K., Ushiku, Y., and Harada, T. (2017). Asymmetric
tri-training for unsupervised domain adaptation. In In-
ternational Conference on Machine Learning, pages
2988–2997. PMLR.
Saito, K., Watanabe, K., Ushiku, Y., and Harada, T. (2018).
Maximum classifier discrepancy for unsupervised do-
main adaptation. In Proceedings of the IEEE con-
ference on computer vision and pattern recognition,
pages 3723–3732.
Sun, B. and Saenko, K. (2016). Deep coral: Correla-
tion alignment for deep domain adaptation. In Com-
puter Vision–ECCV 2016 Workshops: Amsterdam,
The Netherlands, October 8-10 and 15-16, 2016, Pro-
ceedings, Part III 14, pages 443–450. Springer.
Sun, T., Lu, C., Zhang, T., and Ling, H. (2022). Safe
self-refinement for transformer-based domain adapta-
tion. In Proceedings of the IEEE/CVF conference on
computer vision and pattern recognition, pages 7191–
7200.
Tarvainen, A. and Valpola, H. (2017). Mean teachers are
better role models: Weight-averaged consistency tar-
gets improve semi-supervised deep learning results.
Advances in neural information processing systems,
30.
Touvron, H., Cord, M., Douze, M., Massa, F., Sablayrolles,
A., and J
´
egou, H. (2021). Training data-efficient im-
age transformers & distillation through attention. In
International conference on machine learning, pages
10347–10357. PMLR.
Tzeng, E., Hoffman, J., Saenko, K., and Darrell, T. (2017).
Adversarial discriminative domain adaptation. In Pro-
ceedings of the IEEE conference on computer vision
and pattern recognition, pages 7167–7176.
Venkateswara, H., Eusebio, J., Chakraborty, S., and Pan-
chanathan, S. (2017). Deep hashing network for
unsupervised domain adaptation. In Proceedings of
the IEEE conference on computer vision and pattern
recognition, pages 5018–5027.
Xie, B., Li, S., Lv, F., Liu, C. H., Wang, G., and Wu,
D. (2022). A collaborative alignment framework of
transferable knowledge extraction for unsupervised
domain adaptation. IEEE Transactions on Knowledge
and Data Engineering.
Xu, T., Chen, W., Wang, P., Wang, F., Li, H., and
Jin, R. (2021). Cdtrans: Cross-domain transformer
for unsupervised domain adaptation. arXiv preprint
arXiv:2109.06165.
Yang, J., Liu, J., Xu, N., and Huang, J. (2023). Tvt: Trans-
ferable vision transformer for unsupervised domain
adaptation. In Proceedings of the IEEE/CVF Win-
ter Conference on Applications of Computer Vision,
pages 520–530.
Zhang, C. and Lee, G. H. (2022). Ca-uda: Class-aware
unsupervised domain adaptation with optimal assign-
ment and pseudo-label refinement. arXiv preprint
arXiv:2205.13579.
Zhang, Y., Liu, T., Long, M., and Jordan, M. (2019). Bridg-
ing theory and algorithm for domain adaptation. In
International conference on machine learning, pages
7404–7413. PMLR.
Zhu, J., Bai, H., and Wang, L. (2023). Patch-mix trans-
former for unsupervised domain adaptation: A game
perspective. In Proceedings of the IEEE/CVF Con-
ference on Computer Vision and Pattern Recognition,
pages 3561–3571.
VISAPP 2024 - 19th International Conference on Computer Vision Theory and Applications
432
