
Class Weighted Focal Loss for Improving Class Imbalance in
Semi-Supervised Object Detection
Shinichi Hoketsu
a
, Tsubasa Hirakawa
b
, Takayoshi Yamashita
c
and Hironobu Fujiyoshi
d
Chubu University, 1200 Matsumoto-cho, Kasugai, Aichi, Japan
Keywords:
Deep Learning, Object Detection, Semi-Supervised Learning, Class Imbalance, In-Vehicle Camera Image.
Abstract:
Object detection is a task for acquiring environmental information in automated driving. Object detection
is used to detect the position and class of objects in an image. It can be made more accurate by learning
with a large amount of supervised data. However, the high cost of annotating the data makes it difficult to
create large supervised datasets. Therefore, research using semi-supervised learning for object detection has
been attracting attention. Previous studies on semi-supervised learning in object detection tasks have mainly
conducted evaluation experiments only on large datasets with many classes, such as MS COCO, and PASCAL
VOC. Therefore, the effectiveness of semi-supervised learning for in-vehicle camera data as input has not
yet been demonstrated. We examined the effectiveness of semi-supervised learning in object detection when
in-vehicle camera data are used as input. We also proposed a class weighted focal loss that employs a unique
weighting method that takes into account the class imbalance problem. Experimental results indicate that
semi-supervised learning is also effective when vehicle-mounted camera images are used as input. We also
confirmed that the proposed mitigates improves the class imbalance problem and improves accuracy.
1 INTRODUCTION
In the field of autonomous driving, it is essential to
acquire environmental information such as the posi-
tions of surrounding vehicles and pedestrians. Object
detection is used to obtain those information, which
estimates the position and the class of objects exist-
ing in an image. Because of the development of deep
learning techniques, various object detection meth-
ods have been developed, and the high accuracy have
been achieved by using a large amount of supervised
data for model training. However, building a large-
scale supervised dataset requires manual annotations,
which is costly due to the high annotation costs.
To achieve higher accuracy while reducing the
annotation cost, semi-supervised learning has been
gaining attention in recent years. Although semi-
supervised learning is widely investigated in general
object recognition problems, various semi-supervised
object detection methods (Sohn et al., 2020; Xu et al.,
2021; Chen et al., 2022; Liu et al., 2021; Liu et al.,
a
https://orcid.org/0009-0001-8844-5762
b
https://orcid.org/0000-0003-3851-5221
c
https://orcid.org/0000-0003-2631-9856
d
https://orcid.org/0000-0001-7391-4725
2022) has been also proposed. In the previous re-
search on semi-supervised learning for object detec-
tion, evaluation experiments have mainly been con-
ducted using large-scale general object datasets such
as MS COCO (Lin et al., 2015) and PASCAL VOC
(Everingham et al., 2010), which contain many ob-
ject classes. Meanwhile, the effectiveness of semi-
supervised object detection for in-vehicle camera im-
ages has not yet been demonstrated.
In this paper, we aim to verify the effectiveness of
semi-supervised object detection for in-vehicle cam-
era images. Apart from the large-scale general ob-
ject datasets, e.g., MS COCO and PASCAL VOC, in-
vehicle camera image dataset has different character-
istics. One of the characteristics is class imbalance
problem. In-vehicle camera images are collected only
on the road, which cannot be controlled. Therefore, it
is difficult to adjust the number of collected samples
per each object class, and the in-vehicle camera image
inherently contains the class imbalance problem.
Therefore, we propose to add class weights to
the classification loss in the loss of object detection
model training to address the class imbalance prob-
lem, which prevents a decrease in accuracy for classes
that are extremely rare in the dataset. Class weight
taking into account class imbalance sets the class
Hoketsu, S., Hirakawa, T., Yamashita, T. and Fujiyoshi, H.
Class Weighted Focal Loss for Improving Class Imbalance in Semi-Supervised Object Detection.
DOI: 10.5220/0012351600003660
Paper published under CC license (CC BY-NC-ND 4.0)
In Proceedings of the 19th International Joint Conference on Computer Vision, Imaging and Computer Graphics Theory and Applications (VISIGRAPP 2024) - Volume 2: VISAPP, pages
417-424
ISBN: 978-989-758-679-8; ISSN: 2184-4321
Proceedings Copyright © 2024 by SCITEPRESS – Science and Technology Publications, Lda.
417

weight on the base in of the total number of objects
in the dataset to optimize the object detection task.
Specifically, a smaller class weight is set for classes
with a large number of samples, while a larger class
weight is set for classes with a small number of sam-
ples, thereby placing more emphasis on classes with a
small number of samples in the loss calculation. The
implementation of the optimized class weight for the
object-detection task improves the class imbalance
problem.
In our evaluation with BDD100K dataset (Yu
et al., 2020), we demonstrate that the semi-supervised
object detection is effective for in-vehicle camera im-
ages. Also, we show that our proposed loss function
outperform the conventional supervised and semi-
supervised approaches.
2 RELATED WORK
Herein, we briefly describe related works on super-
vised object detection and semi-supervised object de-
tection methods.
2.1 Supervised Object Detection
Supervised object detection methods have been
widely studied in the field of computer vision. Among
various methods have been proposed, the supervised
method can be categorized in to the following two
types: one that uses anchor boxes (Ren et al., 2016;
He et al., 2018; Lin et al., 2018; Tan and Le, 2020)
and the other that is anchor-free (Tian et al., 2019;
Bochkovskiy et al., 2020; Tan et al., 2020; Zhou
et al., 2019). Anchor boxes-based approach are rect-
angular frames used to indicate regions where objects
may exist. Multiple anchor boxes of different sizes
and aspect ratios can be defined for each anchor on
the feature map. However, the use of anchor boxes
presents several problems, such as the existence of
multiple hyperparameters including the number of an-
chor boxes, aspect ratios, and sizes, and the fact that
most anchor boxes are treated as negative samples,
making computation inefficient.
Various anchor-free methods have been proposed
to address the disadvantages of anchor boxes fully
convolutional one-stage object detection (FCOS) uses
a unique index called center-ness instead of anchor
boxes. Center-ness is defined as follows:
centerness
∗
=
s
min(l
∗
, r
∗
)
max(l
∗
, r
∗
)
×
min(t
∗
, b
∗
)
max(t
∗
, b
∗
)
, (1)
where, l
∗
represents the distance from the object cen-
ter to the left, r
∗
represents the distance to the right,
t
∗
represents the distance to the top, and b
∗
represents
the distance to the bottom. By using center-ness, it is
possible to prevent the prediction of bounding boxes
centered on positions far from the object center.
In this paper, we use the anchor free approach (i.e.,
FCOS) as an object detector of semi-supervised learn-
ing framework.
2.2 Semi-Supervised Object Detection
object-detection methods for semi-supervised learn-
ing framework have been proposed (Sohn et al., 2020;
Xu et al., 2021; Chen et al., 2022; Liu et al., 2021; Liu
et al., 2022). Major approach of semi-supervised ob-
ject detection is pseudo-labeling.
One of the major pseudo-labeling approach is self-
training and the augmentation driven consistency reg-
ularization (STAC) and the variants (Liu et al., 2021;
Liu et al., 2022), which introduce strong augmen-
tation STAC prepares two object-detection models:
teacher and student and trains student model by us-
ing pseudo-labeling and strong data augmentation.
In this approach, teacher is trained on labeled data
only, while student is trained on both labeled and
unlabeled data. The process starts with a burn-in
stage, where teacher is trained. After this stage, the
weights of teacher are fixed, and data are input to
teacher to make predictions. Non-maximum suppres-
sion is executed to remove labels with high uncer-
tainty, and the remaining labels are treated as pseudo-
labels for student. Strong data augmentation is then
applied to data similar to those predicted by teacher,
and student makes predictions. The loss is calcu-
lated by comparing the predictions with the pseudo-
labels, and Student is trained using this loss. This
method can improve accuracy by providing a sim-
ple learning method and a large amount of unlabeled
data. However, during Student’s learning stage, the
weight of Teacher is fixed, which means that the per-
formance heavily depends on how accurate Teacher
can be trained during the burn-in stage.
The method called Unbiased Teacher (Liu et al.,
2021) is used for improving the dependency issue dur-
ing the burn-in stage. Unbiased Teacher updates the
weights of Teacher on the basis of the exponential
moving average using Student’s weights, even after
the burn-in stage, which enables the feedback of Stu-
dent’s learned knowledge to Teacher. The updating
formula for Teacher’s weights using the exponential
moving average is shown in Equation 2.
θ
t
= αθ
t
+ (1 − α)θ
s
(2)
where, θ
t
represents Teacher’s weights, θ
s
represents
Student’s weights, and α is a hyperparameter. By
VISAPP 2024 - 19th International Conference on Computer Vision Theory and Applications
418
Burn-In Stage Teacher-Student Mutual Learning Stage
Teacher Refinement
Student Learning
Figure 1: Overview of Unbiased Teacher v2.
gradually bringing Teacher closer to Student using the
exponential moving average, Teacher can obtain Stu-
dent’s insights even after the burn-in stage. This im-
proves the quality of the generated pseudo-labels.
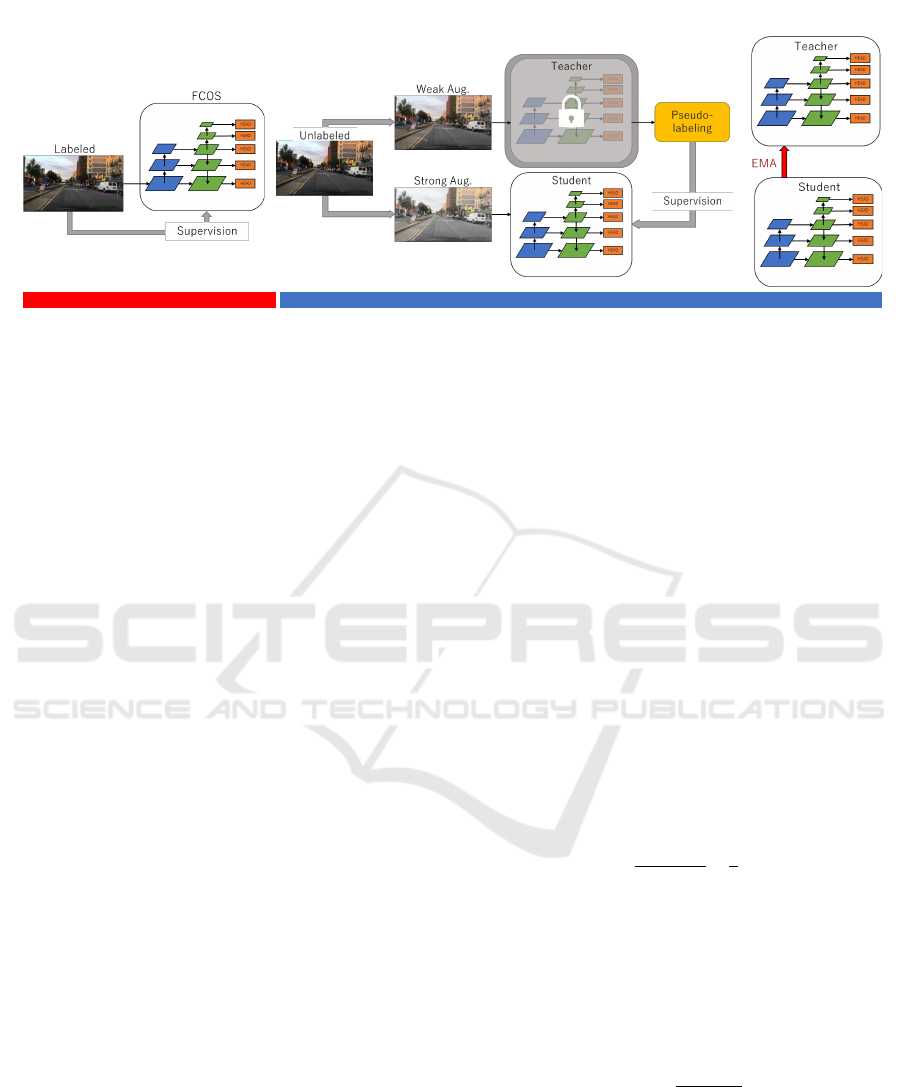
3 METHOD
Our proposed method adopts Unbiased Teacher v2
(Liu et al., 2022) as a semi-supervised object detec-
tion framework. Unbiased Teacher v2 (Liu et al.,
2022) is an improved version of Unbiased Teacher
that addresses the dependency issue during the burn-
in stage. Unbiased Teacher v2 is used along with the
anchor-free method FCOS, which is not used in tra-
ditional semi-supervised learning. Figure 1 shows an
overview of Unbiased Teacher v2. Unbiased Teacher
v2 executes learning in two stages. In the burn-
in stage the teacher that generates pseudo-labels is
trained using only labeled data. After the burn-in
stage, student is trained using the same procedure
as before. However, unlike with STAC, Unbiased
Teacher v2 does not initialize the model with stu-
dent but uses a replica of teacher as student. Weak
data augmentation is also applied to the data input to
teacher, while strong data augmentation is applied to
the data input to student. The loss is then calculated
to obtain the gradient, which is used to update the
weights of Student. After updating the weights of stu-
dent, the weights of teacher are updated using expo-
nential moving average. As data augmentations, weak
data augmentation included horizontal flip, while
strong data augmentation includes color transforma-
tion, grayscale, Gaussian blur, and cutout. The pro-
posed method generates pseudo-labels in anchor-free
methods and improves the learning method for de-
tectors using the pseudo-labels. They discuss the
issues with the traditional semi-supervised learning
method that uses pseudo-labels and point out the un-
certainty of the pseudo-labels predicted by Teacher.
With Unbiased Teacher, the Teacher-predicted results
are thresholded, and predictions exceeding the thresh-
old are always treated as pseudo-labels. However,
this method also treats false detections made by the
Teacher as pseudo-labels, which could suppress Stu-
dent’s learning. To address this issue, they the pro-
posed the Listen 2 Student mechanism. This mecha-
nism does not update the weights if Student’s predic-
tion is correct compared with the Teacher predicted
pseudo-label. This prevents the effect of false detec-
tions on Student’s learning. However, it is difficult to
determine whether Teacher’s prediction is correct dur-
ing Student’s learning phase because the ground truth
is not used. Therefore, the they use negative power
log-likelihood loss (NPLL) (Lee et al., 2022) to eval-
uate whether Teacher’s prediction is correct. The cal-
culation method for NPLL is shown in Equation 3.
L
sup
reg
=
∑
i
η
i
∑
d
s
−d
g
2
2δ
2
s
+
1
2
logδ
2
s
!
+2log2π
!
(3)
where, δ
s
is the uncertainty of Student’s prediction, d
t
is Teacher’s regression prediction, d
s
is Student’s re-
gression prediction, and η
i
is calculated by computing
the mean IoU between the predicted bounding box B
s
and pseudo-label B
t
. The calculation method for η
i
is
shown in Equation 4.
η
i
=
B
s
∩ B
t
B
s
∪ B
t
(4)
3.1 Class Weighted Focal Loss
We propose the introduction of a unique class weight
optimized for the object detection task for the class-
loss function, focal loss (Lin et al., 2018) as a counter-
measure against the class imbalance problem of semi-
Class Weighted Focal Loss for Improving Class Imbalance in Semi-Supervised Object Detection
419

supervised learning in the object-detection task. Fo-
cal loss was mitigates the decrease in accuracy due
to the imbalance between foreground and background
regions in object detection tasks. However, since it
is focused on foreground and background regions, it
cannot be said that it performs a loss calculation that
takes into account the object class. Tuning hyperpa-
rameter γ to adjust the magnitude of the loss also re-
quires effort to be made for each dataset. A previ-
ous study (Cui et al., 2019) added class weights to
focal loss in the same manner as in this study. How-
ever, that study only defined weight-setting methods
for image recognition, and it is difficult to set appro-
priate weights for object detection.
Therefore, propose a weight setting method spe-
cific to the object-detection task to mitigate the class
imbalance problem by applying a class weight set for
each class to focal loss. We define the loss function
with class weight added to focal loss as class weighted
focal loss. The formula for calculating class weighted
focal loss is shown in Equation 5.
CW FL(P
t
) = −W
t
(1 − p
t
)
γ
log(p
t
)
(5)
where, P
t
represents the class probability, and W
t
is
the weight in the object class. The formula for calcu-
lating W
t
is shown in Equation 6.
W
t
= log(
C
all
C
t
) (6)
where, C
all
is the total number of objects in all classes
included in the training data, and C
t
is the total num-
ber of predicted objects in the training data for the tar-
get class. We define the total number of objects as the
total number of boxes in the entire training dataset.
By multiplying W
t
with the class loss, we can carry
out learning focused on classes with fewer objects.
4 EXPERIMENTS
We the effectiveness of the proposed object-detection
method by using in-vehicle camera images. We also
investigated the tendencies when changing γ. Experi-
ments will be evaluated primarily through quantitative
and qualitative evaluations.
4.1 Dataset
The BDD100K dataset consists of data captured with
car-mounted cameras while driving through cities
such as New York, Boston, Washington DC, and San
Francisco. The images were captured under vari-
ous environmental conditions including clear skies,
cloudy skies, rain, snow, and various times of day
Table 1: Number of samples per classes in the train data of
BDD100K dataset.
Object class # of samples
Person 104,611
Car 815,717
Rider 5,166
Bus 13,269
Truck 34,216
Bike 8,217
Motor 3,454
Traffic light 213,002
Traffic sign 274,594
ranging from early morning to late night, as well as
various traffic conditions ranging from congested to
empty roads, resulting in a diverse dataset with many
different features. The resolution of the image data
is 1,280 × 740 pixels, and the dataset is comprised of
70,000 training images and 10,000 validation images.
For the object-detection task, nine classes are de-
fined, Person, Car, Rider, Bus, Truck, Bike, Motor,
Traffic light, and Traffic sign. Table 1 shows the num-
ber of objects per class in the BDD100K training data.
While the Car class contains many objects, classes
such as Motorcycle, Rider, and Bicycle contain rel-
atively few objects. Additionally, while there are
70,000 training images, some classes, such as Truck
and Bus, have fewer objects than this, indicating that
there are many images in which certain classes are
not present. Therefore, there will be a class imbal-
ance problem, in which the model will tend to overfit
to classes with many samples when trained for object
detection.
4.2 Experimental Settings
We set the experimental conditions on the basis
of previous research on object detection in semi-
supervised learning (Sohn et al., 2020; Xu et al.,
2021; Chen et al., 2022; Liu et al., 2021; Liu
et al., 2022) and compared out method with semi-
supervised learning and supervised learning meth-
ods.Specifically, we randomly extracted 1, 5, and 10%
of the entire dataset as a supervised set and used the
remaining data as an unlabeled set. When extracting
supervised sets, we set the 5% set to contain 1% of the
data and the 10% set to contain 5% of the data. This
is because supervised sets can cause large gaps in ac-
curacy in semi-supervised learning experiments. To
account for accuracy deviations, the experiment was
conducted with seed values for each of the five pat-
terns, and comparisons were made on the basis the
average accuracy.
VISAPP 2024 - 19th International Conference on Computer Vision Theory and Applications
420

Table 2: Comparison of supervised, semi-supervised learning, and proposed method.
1% 5% 10%
AP AP
50
AP
75
AP AP
50
AP
75
AP AP
50
AP
75
Supervised 13.37 27.19 11.22 20.93 42.35 17.99 23.33 45.80 20.59
Semi-supervised 20.80 40.61 18.23 25.64 50.01 22.28 27.71 53.21 24.64
Proposed 19.68 37.97 17.49 26.12 50.42 23.01 28.20 53.91 25.23
Table 3: Comparison of class accuracy between supervised and semi-supervised learning.
Person Car Rider Bus Truck Bike Motor Traffic light Traffic sign
Supervised 22.81 40.54 13.55 34.02 31.52 14.24 12.38 14.69 26.26
Semi-supervised 26.95 43.29 15.59 39.48 37.94 17.58 14.56 21.34 32.70
Proposed 27.28 43.63 16.62 39.48 36.76 18.50 16.77 21.76 32.98
We used Unbiased Teacher v2 as the semi-
supervised learning method for object detection. The
backbone was ResNet-50 (He et al., 2015), and
the detector used FCOS. We followed the settings
in a previous study (Liu et al., 2022) for the data
augmentation and hyperparameters used. We also
used a model pre-trained on ImageNet as the pre-
training model. The number of training iterations was
180,000, consisting of 30,000 iterations in the burn-
in stage and 150,000 iterations in the Teacher-Student
Mutual Learning stage. The batch size is set to 16,
with 8 supervised and 8 unsupervised images in each
batch.
The hyperparameter γ of the proposed method was
set to 1, which achieved the highest accuracy in this
study.
4.3 Evaluation Metrics
We used mean average precision (mAP) for evalua-
tion, which is a performance metric that can be calcu-
lated by taking the average of precision and recall for
each class. The mAP is defined as follows:
mAP =
∑
c
AP
c
N
c
. (7)
Here, N
c
is the number of object classes and average
precision (AP) of class c is
AP
c
=
Z
1
0
p(r) dr. (8)
where, p denotes precision, r denotes recall, c de-
notes class, N
c
denotes the total number of classes,
and AP
c
denotes the AP for each class.
4.4 Quantitative Results
Table 2 shows the comparison of overall accuracy,
where ”1%”, ”5%”, and ”10%” represent the per-
centage of labeled data in supervised learning. Note
that unsupervised data are not used with the super-
vised learning method. The semi-supervised learning
method outperformed the supervised learning method
in overall accuracy, as shown in both Tables 2 and
3. This result suggests that semi-supervised learning
is effective in datasets consisting only of in-vehicle
camera images. In terms of the difference in AP by
the percentage of labeled data shown in Table 2, the
difference was 7.43 points for 1%, 4.71 points for 5%,
and 4.38 points for 10%. The greater the scarcity of
labeled data, the larger the difference in accuracy be-
tween supervised learning and semi-supervised learn-
ing. Therefore, semi-supervised learning is superior
in situations where labeled data are scarce. Regarding
the class probabilities in Table 3, it is thought that the
decrease in accuracy due to class imbalance occurs
in semi-supervised learning for classes such as Car,
which have many samples, and classes such as Rider
and Motor, which have few samples, where the dif-
ference in accuracy between supervised learning and
semi-supervised learning is small.
Next, we compared a semi-supervised learning
method with our proposed method. Looking at the
difference in AP by the percentage of labeled data
shown in Table 2, the accuracy improved when using
our proposed method with 5% and 10% labeled data.
However, for 1% labeled data, the accuracy of the
semi-supervised method was higher, indicating that
the accuracy of our proposed method decreases when
the labeled data is scarce. This is because weighting
the data on the basis of randomly sampled 1% causes
the difference in weights between classes with few
samples and those with many samples to become too
large. Looking at the differences in accuracy for each
class shown in Table 3, our proposed method achieves
higher accuracy for all classes except for Truck and
Bus. The reason the accuracy did not improve for
these classes may be that they share similar features
Class Weighted Focal Loss for Improving Class Imbalance in Semi-Supervised Object Detection
421

Table 4: Accuracy comparison for different γ.
1% 5% 10%
γ AP AP
50
AP
75
AP AP
50
AP
75
AP AP
50
AP
75
0 17.72 33.77 15.90 24.53 47.47 21.86 26.64 50.45 24.20
1 19.68 37.97 17.49 26.12 50.42 23.01 28.20 53.91 25.23
2 19.44 38.02 17.14 26.04 50.47 22.97 27.93 53.78 24.64
3 19.35 37.17 17.19 25.35 49.15 22.24 27.78 52.91 24.89
Table 5: Accuracy comparison by class for different Gamma.
γ Person Car Rider Bus Truck Bike Motor Traffic light Traffic sign
0 26.68 42.92 15.26 38.07 34.33 18.34 16.12 18.59 29.44
1 27.28 43.63 16.62 39.48 36.76 18.50 16.77 21.76 32.98
2 27.20 43.27 15.93 40.19 38.16 18.59 16.20 20.90 30.94
3 26.91 43.39 15.11 40.73 38.02 17.97 14.62 20.97 32.25
with the Car class and weighting alone is not suffi-
cient to distinguish them.
4.5 Effect of γ
We investigated the effects of changing γ with our pro-
posed method. Table 4 shows the comparison of ac-
curacy for different percentages of labeled data, while
Table 5 shows the comparison of class-wise accuracy
when the labeled data were 10%. Based on the results
in Table 4, except for AP50 when labeled data were
5%, the highest accuracy was achieved when γ was set
to 1. Therefore, it can be concluded that setting γ to
1 is appropriate. However, as we can see from Table
5, for the Bus, Truck, and Bike classes, the highest
accuracy was achieved when γ was set to 2 or 3. This
is because as γ increases, the loss for classes that are
similar to the correct class, such as Bus and Truck,
is almost ignored even if their confidence scores are
not high. This helps improve the learning of Bus and
Truck. Similarly for Bike class, the loss is also almost
ignored when the features are similar to those of the
Motor class.
4.6 Qualitative Results
Qualitative evaluation is shown in Figure 2, 3.
With the supervised-learning method (Figure 2b), the
Truck on the left side of the image was misclassi-
fied as a Car and a false detection is made around the
tire area. With the semi-supervised-learning method
(Figure 2c), a Car was not detected in the center
back. However, the proposed method (Figure 2d)
suppressed false detections for the Truck on the left
side of the image and correctly detected the Car
in the center back. When comparing the proposed
method (Figure 2d) with the semi-supervised-learning
method (Figure 2c), the proposed method detected
objects with higher class probabilities than the semi-
supervised method. However, the proposed method
misclassified the Truck on the left side of the image
as a Car(Figure 2d). Therefore, the proposed method
is not able to acquire features that can distinguish
Trucks similar to Cars through semi-supervised learn-
ing.
In a different scenario, as shown in Figure 3, when
a rider on a motorcycle is positioned in the center of
the screen, it becomes evident that only the proposed
method correctly detects them. Furthermore, the pro-
posed method enables the detection of individuals at-
tempting to cross a pedestrian crossing. This demon-
strates that using the proposed method allows for the
improved detection rate of minority classes, as evi-
dent through qualitative assessment.
5 CONCLUSION
In this paper, we focus on the semi-supervised object
detection of in-vehicle camera images and we pro-
posed class weighted focal loss. Our method is based
on pseudo-labeling approach (Unbiased Teacher v2)
and we introduce the focal loss weighted by class bal-
ances in the training dataset. This enables us to im-
prove detection accuracy on a rare object classes.
In the experiments, we used BDD100K as the
in-vehicle camera image dataset and evaluated the
effectiveness of the proposed method. The pro-
posed method showed improved accuracy compared
with conventional supervised- and semi-supervised-
learning object-detection methods except in cases
where the teacher data was 1%. Since the proposed
VISAPP 2024 - 19th International Conference on Computer Vision Theory and Applications
422
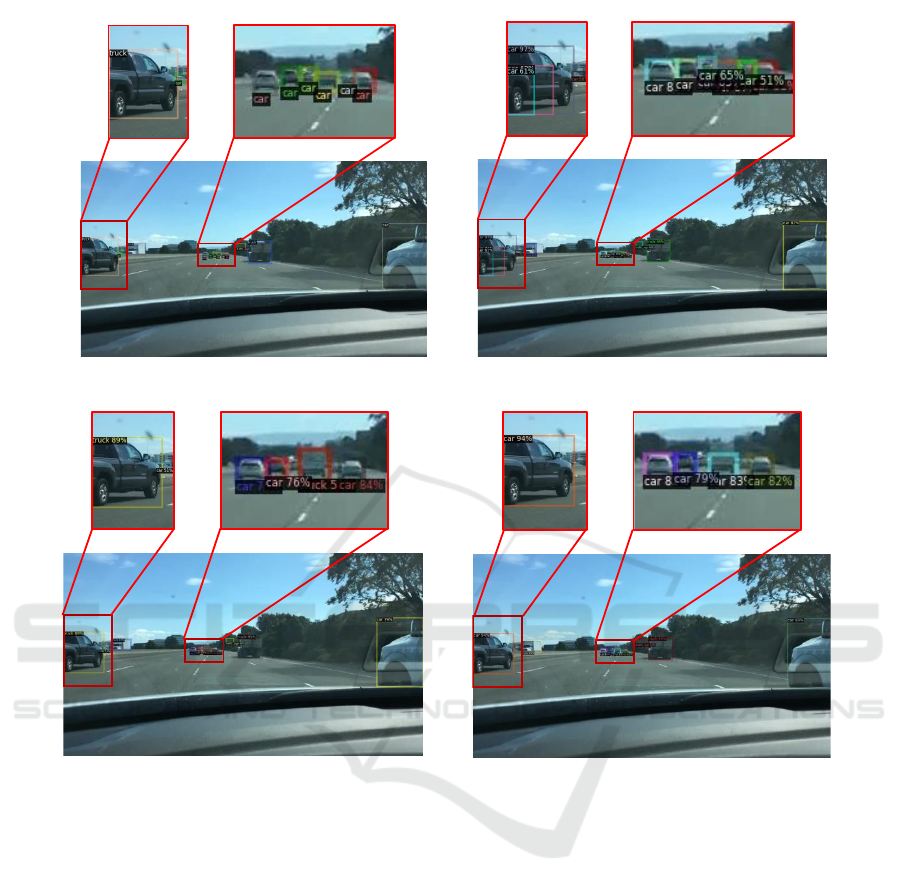
(a) Ground truth
(b) Supervised-learning method
(c) Semi-supervised-learning method
(d) Proposed (γ = 1)
Figure 2: Example of Visualization of Object Detection.
method calculates weights on the basis the number of
samples in the dataset, it enables learning that empha-
sizes classes with fewer samples. However, we found
that simply adding weights does not sufficiently dis-
tinguish between classes with similar characteristics
in some cases, and this does not lead to improved ac-
curacy in certain classes. Future work includes estab-
lishing appropriate class-weight settings and a learn-
ing method focused on fewer samples.
REFERENCES
Bochkovskiy, A., Wang, C.-Y., and Liao, H.-Y. M. (2020).
Yolov4: Optimal speed and accuracy of object detec-
tion.
Chen, B., Li, P., Chen, X., Wang, B., Zhang, L., and Hua,
X.-S. (2022). Dense learning based semi-supervised
object detection.
Cui, Y., Jia, M., Lin, T., Song, Y., and Belongie, S. J. (2019).
Class-balanced loss based on effective number of sam-
ples. CoRR, abs/1901.05555.
Everingham, M., Van Gool, L., Williams, C. K. I., Winn,
J., and Zisserman, A. (2010). The pascal visual ob-
ject classes (voc) challenge. International Journal of
Computer Vision, 88(2):303–338.
He, K., Gkioxari, G., Doll
´
ar, P., and Girshick, R. (2018).
Mask r-cnn.
He, K., Zhang, X., Ren, S., and Sun, J. (2015). Deep resid-
ual learning for image recognition.
Lee, Y., won Hwang, J., Kim, H.-I., Yun, K., Kwon, Y., Bae,
Y., and Hwang, S. J. (2022). Localization uncertainty
estimation for anchor-free object detection.
Lin, T.-Y., Goyal, P., Girshick, R., He, K., and Doll
´
ar, P.
(2018). Focal loss for dense object detection.
Lin, T.-Y., Maire, M., Belongie, S., Bourdev, L., Girshick,
Class Weighted Focal Loss for Improving Class Imbalance in Semi-Supervised Object Detection
423
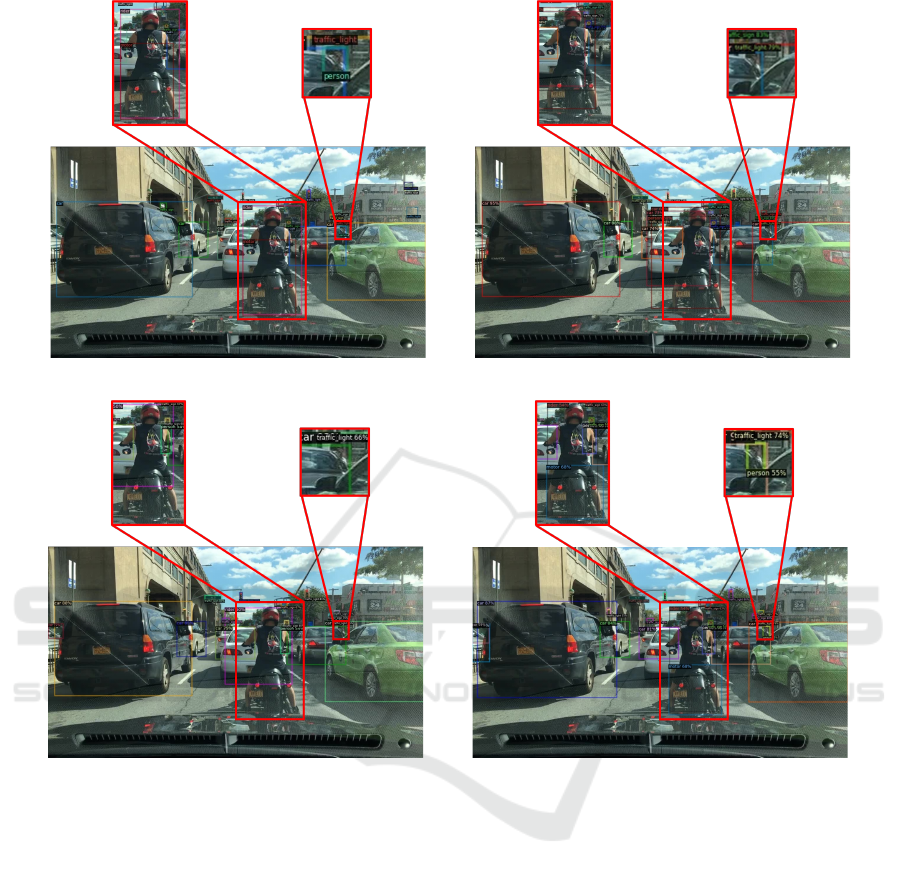
(a) Ground truth (b) Supervised-learning method
(c) Semi-supervised-learning method
(d) Proposed (γ = 1)
Figure 3: Visualization Example with Rider.
R., Hays, J., Perona, P., Ramanan, D., Zitnick, C. L.,
and Doll
´
ar, P. (2015). Microsoft coco: Common ob-
jects in context.
Liu, Y.-C., Ma, C.-Y., He, Z., Kuo, C.-W., Chen, K., Zhang,
P., Wu, B., Kira, Z., and Vajda, P. (2021). Unbiased
teacher for semi-supervised object detection.
Liu, Y.-C., Ma, C.-Y., and Kira, Z. (2022). Unbiased teacher
v2: Semi-supervised object detection for anchor-free
and anchor-based detectors.
Ren, S., He, K., Girshick, R., and Sun, J. (2016). Faster
r-cnn: Towards real-time object detection with region
proposal networks.
Sohn, K., Zhang, Z., Li, C., Zhang, H., Lee, C., and Pfister,
T. (2020). A simple semi-supervised learning frame-
work for object detection. CoRR, abs/2005.04757.
Tan, M. and Le, Q. V. (2020). Efficientnet: Rethinking
model scaling for convolutional neural networks.
Tan, M., Pang, R., and Le, Q. V. (2020). Efficientdet: Scal-
able and efficient object detection.
Tian, Z., Shen, C., Chen, H., and He, T. (2019). Fcos: Fully
convolutional one-stage object detection.
Xu, M., Zhang, Z., Hu, H., Wang, J., Wang, L., Wei, F., Bai,
X., and Liu, Z. (2021). End-to-end semi-supervised
object detection with soft teacher.
Yu, F., Chen, H., Wang, X., Xian, W., Chen, Y., Liu, F.,
Madhavan, V., and Darrell, T. (2020). Bdd100k: A
diverse driving dataset for heterogeneous multitask
learning.
Zhou, X., Wang, D., and Kr
¨
ahenb
¨
uhl, P. (2019). Objects as
points.
VISAPP 2024 - 19th International Conference on Computer Vision Theory and Applications
424
