
New Speed Limit Recognition System: Software and Hardware
Validation
Nesrine Triki
1,2 a
, Mohamed Karray
2b
and Mohamed Ksantini
1c
1
National School of Engineers of Sfax, CEM Lab, University of Sfax, Sfax, Tunisia
2
ESME, ESME Research Lab, Ivry Sur Seine, France
Keywords: Advanced Driver Assistance Systems (ADAS), Automated Driving Systems (ADS), Speed Limit Recognition
System (SLRs), Artificial Intelligence, Belief Functions, Ensemble Learning, Embedded Systems.
Abstract: Recent advancements in intelligent driving have led to the integration of various automated systems into
vehicles, including Speed Limit Recognition systems, which play a crucial role in enhancing road safety and
autonomous driving technologies. This paper presents a comprehensive approach to Speed Limit Recognition,
based on three modules: detection, classification, and the fusion of machine learning and deep learning
classifiers. The proposed approach achieves impressive results, with an accuracy of 99.98% using Dempster
Shafer theory and 99.96% with the voting technique. The system's performance is rigorously evaluated
through simulation and hardware validation using a Raspberry Pi 4 board. Experimental results indicate high
performance rates across nine classes from the German Traffic sign Recognition Benchmark dataset in an
average processing time of 0.15 seconds.
1 INTRODUCTION
Research and development in intelligent driving have
been the subject of numerous projects and efforts in
recent years, thanks to the considerable improvement
in the performance of on-board vehicle equipment.
These advancements have allowed automotive
manufacturers to integrate systems offering various
levels of autonomy and safety into their new vehicles,
such as Advanced Driver Assistance Systems
(ADAS) and Automated Driving Systems (ADS),
both of which fall under the umbrella of automated
driving (Wintersberger et al., 2016). Among these
devices are fatigue detection systems, accident and
pedestrian detection systems, and systems for Traffic
Sign Recognition (TSR).
Speed Limit Recognition (SLR) system has made
significant advancements in recent years to enhance
road safety. In fact, it uses cameras, image
processing, and AI techniques to detect and classify
Speed Limit (SL) signs, either to assist drivers or to
take control of the vehicle. In order to ensure the
detection and classification of SL signs, a multitude
a
https://orcid.org/0000-0002-2770-2526
b
https://orcid.org/0000-0001-7293-8696
c
https://orcid.org/0000-0002-9928-8643
of methods based on color, shape, color and shape,
Machine Learning (ML) and Deep Learning (DL)
algorithms are used. Nevertheless, this system faces
diverse limitations, including weather conditions,
poor lighting, sign occlusion, variability in
nomenclature, etc. (Miyata, 2017). In order to
overcome these challenges, computer vision
algorithms must be robust and able to accurately
identify SL signs across a wide range of scenarios.
For these reasons, this paper proposes a new real-
time SLR system based on ML and DL techniques.
Relevant related works are presented in the second
section, and a detailed explanation of the recognition
process is provided in the third section. In the fourth
section, software and hardware validation are done in
order to confirm the obtained performance. Finally, a
conclusion and some perspectives are proposed.
2 RELATED WORKS
SLR system comprises two main components: the
detection of signs within the image, followed by the
368
Triki, N., Karray, M. and Ksantini, M.
New Speed Limit Recognition System: Software and Hardware Validation.
DOI: 10.5220/0012351000003636
Paper published under CC license (CC BY-NC-ND 4.0)
In Proceedings of the 16th International Conference on Agents and Artificial Intelligence (ICAART 2024) - Volume 3, pages 368-375
ISBN: 978-989-758-680-4; ISSN: 2184-433X
Proceedings Copyright © 2024 by SCITEPRESS – Science and Technology Publications, Lda.

recognition of the speed limit value indicated on the
SL sign during the classification step. In this section,
several studies focusing on a multitude of methods
based on color, shape, ML, and DL techniques are
presented in order to recognize SL signs.
In fact, (Agudo et al., 2016) propose a real-time
framework for detecting and recognizing SL signs in
railway networks. Two different Support Vector
Machines (SVMs) are trained, the first recognizes
sign types and the second recognizes numbers. The
framework achieved a recall rate of approximately
95% on railway videos. A modified version of the
Histogram of Oriented Gradients (HOG) is used with
SVM by (Mammeri et al., 2013) to detect and
recognize over 94% of North American SL signs.
(Kundu and Mackens, 2015) use shape and intensity
information to detect American SL signs after
identifying ROIs as extremely stable extreme regions
(MSERs). They use the Kalman filter to track the
detected signs, considering only linear car
movements in the tracking phase. At the classification
stage, an ANN is used for recognition with an
accuracy of 98% on 12300 images. HOG and MSER
functions are also employed by (Soetedjo and
Somawirata, 2018) for SL sign detection and
classification, achieving a classification rate of
93.67% with a processing time of 10.75 ms. (Liu et
al., 2012) combined log-polar mapping and Locality-
constrained Linear Coding (LLC) to recognize speed
limit signs, achieving an accuracy of 97.31% on the
German Traffic Sign Recognition Benchmark
(GTSRB) dataset. An illumination-robust method for
real-time SL sign using Modified Census Transform
(MCT) and SVM, resulting in a detection rate of
99.8% and a classification rate of 98.4%.
Neural networks are used by (Miyata, 2017) for
the classification of SL signs. Convolutional Neural
Network (CNN) is used by the study (Yan et al.,
2017) in the classification stage, and the authors
achieved a recognition rate of approximately 98.51%.
In addition, (Li et al., 2016) also use CNN for the
detection and classification of SL signs by applying
pre-processing and post-processing to images in order
to improve performance, achieving an accuracy of
over 97% on the LISA-TS dataset. These studies
showcase various approaches and techniques,
including SVMs, HOG, MSER, CNNs, etc.
Unfortunately, these methods exhibit certain
limitations including challenges in generalizing to
diverse conditions, dependency on training data
quality, computational resource requirements,
potential for false positives and negatives, sensitivity
to environmental factors, adaptability to different sign
designs, real-time processing constraints, etc. To
address these limitations and improve SLR
performance, a novel methodology based on fusion
techniques combining ML and DL classifiers is
proposed. This approach will be further explored in
the subsequent section.
3 PROPOSED SPEED LIMIT
RECOGNITION APPROACH
SLR involves three main modules: the first detects
speed limit signs (Speed Limit Detection, SLD), the
second classifies the detected signs (Speed Limit
Classification, SLC), and the last merges pre-trained
classifiers (Speed Limit Classifiers Fusion, SLCF).
The recognition process begins with capturing images
using a camera and applying preprocessing steps. The
pre-processed image is sent to the SLD module for
detection using the Haar Cascade method, a ML
object detection technique introduced by (Viola and
Jones, 2001). It locates swiftly potential Region of
Interests (ROI) within captured images. The SLC
module employs a new developed CNN model (Deep
Speed Limit, DeepSL) trained on SL images from
GTSRB dataset. In order to improve classification, k-
Nearest Neighbors (KNN), Random Forest (RF), and
SVM are used and combined in the SLCF module
using Ensemble Learning (EL) or Dempster Shafer
(DS) theory aiming to enhance the recognition
process by finding the best combination.
3.1 Speed Limit Detection Module
In the context of detecting SL road signs images, the
Haar Cascade method is particularly used for its
effectiveness in real time object detection. In fact, this
method operates by using a set of simple rectangular
features called Haar-like features computed at various
scales and positions across the input image, serving
as templates that capture different characteristics of
the object under consideration, such as edges,
corners, or distinctive patterns. The integral image
technique is applied to efficiently calculate these
features, contributing to a streamlined computational
process. Subsequently, AdaBoost, a cascade ML
classifier is trained to identify a small yet crucial
subset of features capable of effectively
distinguishing between positive and negative
samples. This sequential approach enables the
method to swiftly discard image areas unlikely to
contain the target object. This robust detection system
is then applied to pre-processed images to accurately
locate and extract speed limit signs.
New Speed Limit Recognition System: Software and Hardware Validation
369
3.2 Speed Limit Classification Module
The use of DL models such as Convolutional Neural
Networks (CNNs), Deep Neural Networks (DNNs),
and others has garnered significant interest in both the
academic and industrial communities due to their
high performance in SL classification compared to
traditional ML classifiers using various image
datasets (Triki et al., 2023). In this paper, SL road
signs classes from the GTSRB are used.
3.2.1 Speed Limit Road Signs Dataset
Nine SL Traffic signs classes (20, 30, 50, 70, 80, end
of 80, 100, and 120 km/h) from the GTSRB dataset
are used, including approximately 13200 images
captured under various environmental and weather
conditions. These classes exhibit imbalanced
distributions. In fact, several approaches can be
employed to address this issue. A study conducted by
(Rout et al., 2018) explored the use of data
augmentation, which generates additional samples for
classes by applying various transformations such as
rotation, translation, scaling, or adding noise. This
technique diversifies the training set, mitigates
overfitting, and ultimately improves generalization
performance. Furthermore, oversampling techniques
increase the number of samples in the minority class
through replication or synthetic generation, while
undersampling techniques decrease the number of
samples in the majority class. In order to address this
issue, data augmentation, over-sampling, and under-
sampling techniques are applied to the training image
set.
Before addressing the class imbalance problem in
the data used for training DeepSL, a preprocessing
step is required. Initially, images are converted to
grayscale. Then, histogram equalization is applied to
enhance the overall image contrast. Subsequently,
image normalization and reshaping are performed.
3.2.2 DeepSL Classification Model
DeepSL, a new ConvNet has the architecture detailed
as follows: detected SL grayscale signs, are passed
through an initial Conv2D layer with 32 filters of size
(3x3), followed by a ReLU activation function. This
layer extracts features, such as edges and textures. A
Batch Normalization layer follows the first
convolutional layer, helping to normalize activations
and stabilize network training. Next, a second
Conv2D layer with the same parameters as the first
convolutional layer is added, followed by another
Batch Normalization layer. This sequence of
convolutional and normalization layers is repeated a
second time with 64-sized filters. Between each pair
of convolutional layers, a 2x2 Max pooling 2D layer
is added to extract the most important features from
the previous layer. Dropout layers with a rate of 0.25
are added after each Max pooling layer to prevent
overfitting. Once all features have been extracted, a
Flatten layer is used. Subsequently, a Dense layer
with 512 neurons and a ReLU activation function is
added to perform a linear combination of the
previously extracted features using connection
weights, A Batch Normalization layer, and a Dropout
layer with a rate of 0.5 are added. Finally, a last Dense
layer with nine neurons and a SoftMax activation
function is added to perform the input images
classification into the specified SL classes from
GTSRB dataset.
The DeepSL model is trained for 70 epochs with
a batch size of 32 on a GPU. Results of performance
of the model after applying these three techniques are
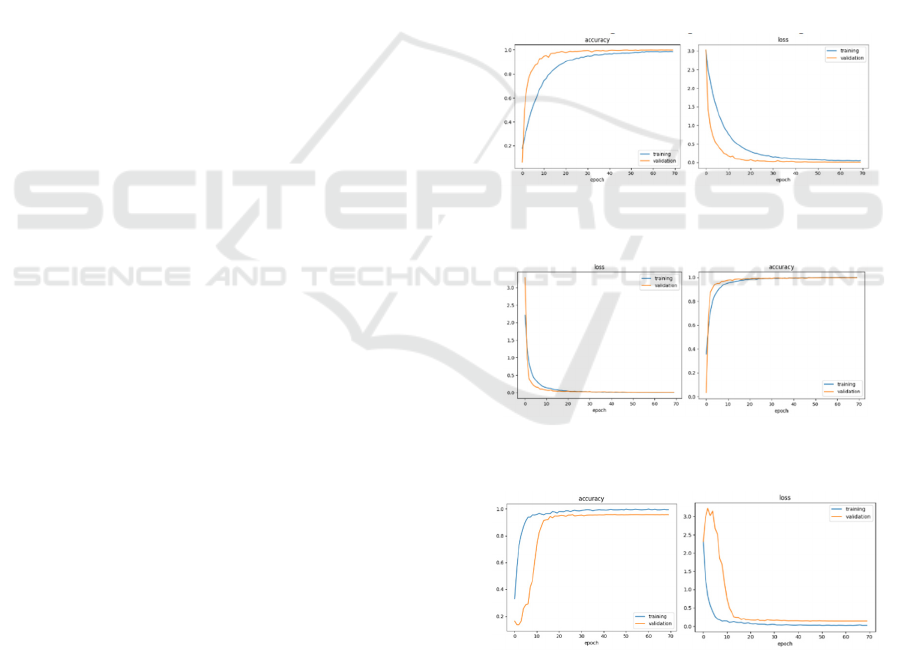
represented in Figure 1, Figure 2, and Figure 3.
Figure 1: Accuracy and loss curves of the training and
testing sets using data augmentation technique.
Figure 2: Loss curves of the training and testing sets using
over-sampling technique.
Figure 3: Loss curves of the training and testing sets using
under-sampling technique.
Examining Figures 1 and 2, the loss curves
demonstrate a remarkable fit of the DeepSL model
when using data augmentation and oversampling,
unlike those in Figure 3, which employ
ICAART 2024 - 16th International Conference on Agents and Artificial Intelligence
370
undersampling and exhibit less significant
performance. The precision (P), recall (R), and F1
weighted average scores are calculated in order to
further evaluate achieved performances. Obtained
weighted average scores are summarized in Table 1.
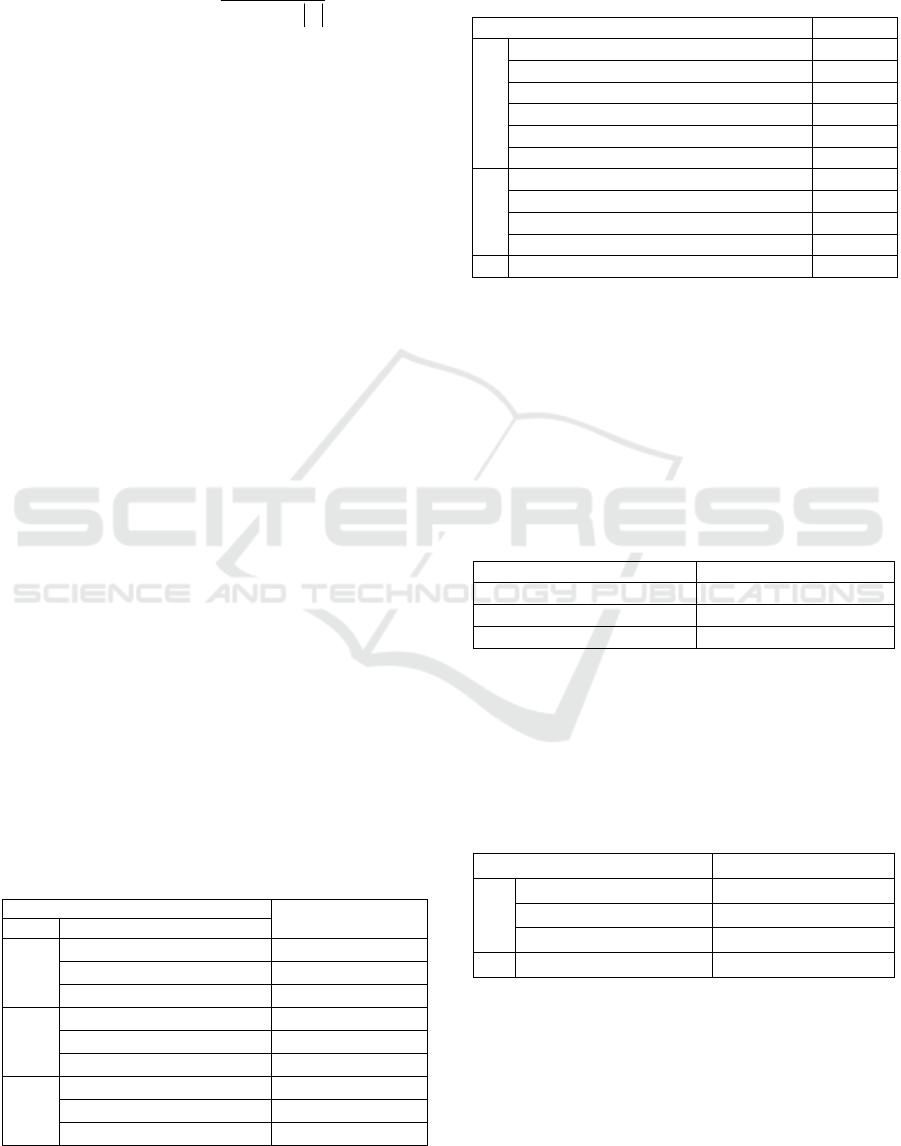
Table 1: Obtained weighted average scores.
Handling
Techniques P (%) R (%) F1 (%)
Data Au
g
mentation 99.81 99.81 99.81
Ove
r
-sam
p
lin
g
99.69 99.69 99.69
Unde
r
-sam
p
lin
g
96.37 96.27 96.27
The F1 score, a harmonic mean of precision and
recall, is used to assess DeepSL performance of the
model. Based on the results presented in Figures 1
and 2 and the weighted F1 scores from Table 1, the
performance of the DeepSL using data augmentation
and oversampling techniques is very close. Therefore,
an evaluation of the model on a real test set is
necessary to select the best model. An example of
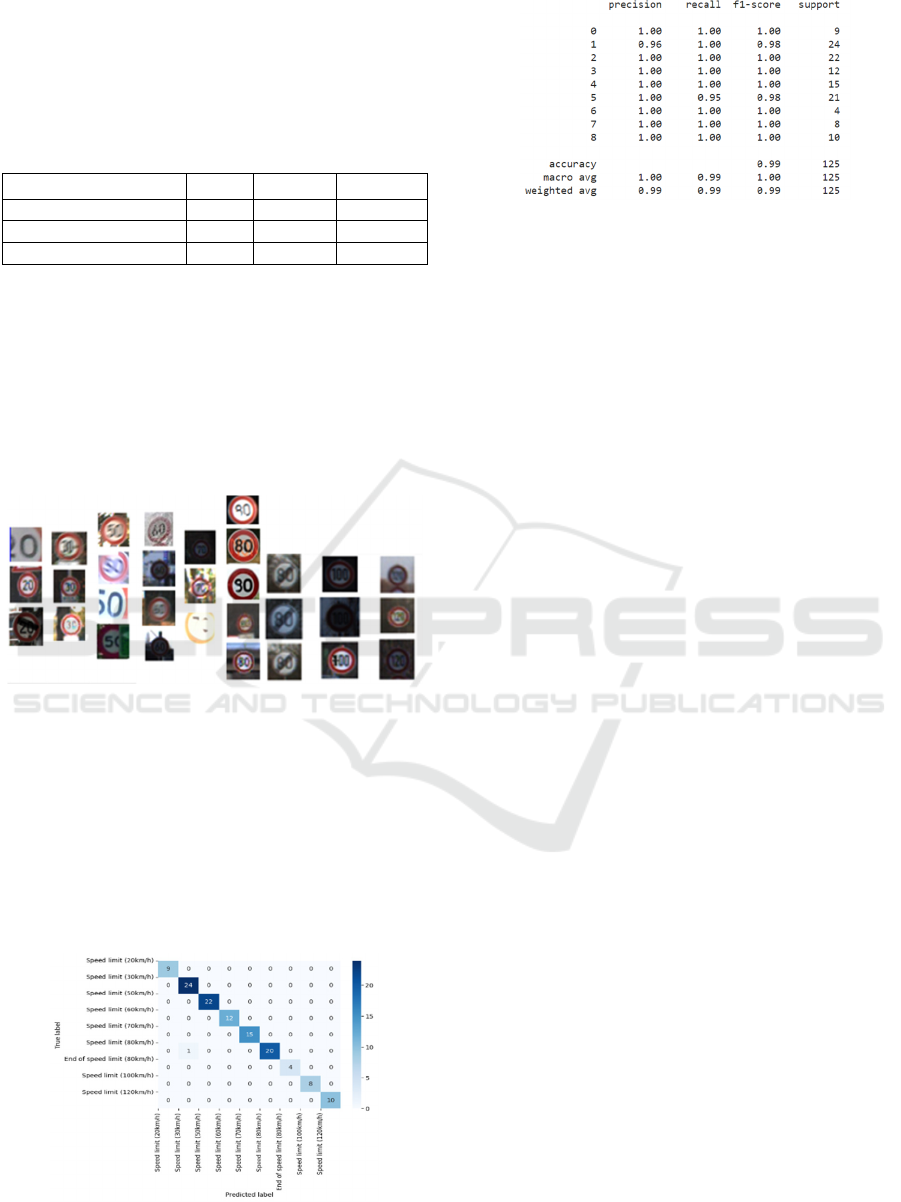
images from the test set is illustrated in Figure 4.
Figure 4: Examples of SL images from the Test set.
By applying the DeepSL model with data
augmentation, the model achieves an F1 score of
99.19%, whereas it is approximately 95.22% when
using oversampling on the data. Consequently, the
DeepSL model using data augmentation is chosen for
its superior classification performance. In addition to
the F1 score, other metrics are used, such as the
confusion matrix and the classification report
illustrated in Figures 5 and 6.
Figure 5: Confusion Matrix of the DeepSL model with data
augmentation on the test set.
Figure 6: Classification report of the DeepSL model with
data augmentation on the test set.
Indeed, in this set of images, only one error was
observed outside the main diagonal of the test
confusion matrix, where a speed limit sign of 80 km/h
was predicted as a 30 km/h speed limit sign.
Moreover, excellent results are obtained for the
classification of SL signs by class. The weighted F1
scores are 98% for 2 classes and 100% for the
remaining 7 classes. In general, prediction errors can
be attributed to various factors, including the quality
and quantity of images used for training or the
classifier itself.
3.3 Speed Limit Traffic Sign Classifiers
Fusion Module
Various methodologies have been applied for image
recognition and have indeed produced good results.
However, they suffer from the loss of details during
feature extraction due to noise in the image, the
presence of similar objects or complex backgrounds,
variations in lighting, etc. To address these issues,
fusion methods combining the results of multiple
classification algorithms are employed such as DS
theory and EL.
In fact, DS theory is a formalism for making
decisions in uncertain situations (Dempster, 2008). It
is based on concepts including:
The mass function (m) is used to represent
uncertain or incomplete information about
hypotheses in a problem. It is defined by:
[]
()
m: 2 0 ,1 with m A 1
A⊆Ω
→=
Ω
(1)
The new mass function of the attenuation
operation defined by equation (2) is applied.
() ()
µ
m A µ * m A ; A =∀≠Ω
(2)
Information fusion is done through the DS
fusion rule by calculating a global mass
function defined by:
() () ()
,:
m(m1 m2 A)C m1 * 2B
AB C A B=∩
⊕=
(3)
New Speed Limit Recognition System: Software and Hardware Validation
371
The pignistic transformation converts a mass
function into a pignistic probability
measure. It is calculated using:
()
()
{A , ω A}
mA
)
Be
((
t
)
pω
1m A
⊆∈
=
−∅
Ω
(4)
The decision will be made by choosing the
element x with the highest probability from
the pignistic transformation using:
() ()()
x
Rp x argmax Betp ω x
∈
=
Ω
(5)
In addition to DS theory, EL, a powerful ML
technique combining multiple classifiers using
various methods to produce more accurate and
reliable final decision is used (Mohammed et al.,
2023). The most common EL techniques include
bagging, boosting, stacking, and voting. The Bagging
involves creating multiple copies of the same model
and training each copy in parallel on random subsets
of the dataset. The Boosting sequentially trains
multiple relatively weak models. Each model is
responsible for correcting the errors of its
predecessor. The Stacking aims to predict the best
classifiers and assign weights to them. The Voting
takes advantage of the performance of numerous
models, making it less susceptible to significant
errors or misclassifications from a single model.
There are two types of voting: Hard Voting (HV) and
Soft Voting (SV). In the following, the DS theory and
the soft voting technique are applied.
3.3.1 Application of Classifiers Fusion Using
DS Theory
First, SVM, KNN, and RF classifiers are trained on
SL signs (13200 images: 75% for training and 25%
for testing) from the GTSRB dataset, using three
feature descriptors (FD): RGB color descriptor
(FD1), 3D color histogram (FD2), and HOG
descriptor (FD3). F1 scores are presented by Table 2
Table 2: F1 scores obtained by SVM, KNN, and RF.
Classification Methods
F1 (%)
FD ML Classifiers
FD1
SVM 34.85
KNN 79.39
RF 74.36
FD2
SVM 93.33
KNN 92.67
RF 96.42
FD3
SVM 95.88
KNN 95.85
RF 92.58
SVM, RF, KNN, and DeepSL classifiers are then
fused using the DS theory. The results of the different
classifier combinations are presented in Table 3.
Table 3: Classification results using the DS theory.
Combined classifiers F1
(
%
)
2
KNN and SVM 99.31
RF and SVM 99.35
RF and KNN 94.48
RF and DeepSL 99.38
KNN and DeepSL 99.29
SVM and Dee
p
SL 93.3
3
KNN and RF and Dee
p
SL 99.93
SVM and KNN and RF 99.91
SVM and KNN and DeepSL 99.91
SVM and RF and DeepSL 99.92
4 SVM and RF and KNN and Dee
p
SL 99.98
3.3.2 Application of Fusion Using Voting
Technique from Ensemble Learning
Initially, features from training images are extracted
using the DeepSL model in order to capture important
features which are then used separately to train KNN,
RF and SVM classifiers. Table 4 summarizes F1
scores of KNN, RF, and SVM on the testing set
described by Figure 4.
Table 4: Weighted F1 Score of the KNN, RF, and SVM.
SL classification methods Wei
g
hted F1 Score
(
%
)
KNN and Dee
p
SL 99.88
RF and DeepSL 99.90
SVM and DeepSL 99.87
According to Table 5, the ML fusion classifiers
using the SV improves significantly F1 score
compared to using each classifier separately. In fact,
the SV collects predicted probabilities for each class
label and predicts it with the highest probability.
Table 5: F1 scores of the fusion of ML classifiers using
DeepSL.
Combined Classifiers
F1 Soft Voting (%)
2
KNN and SVM
99.90
RF and SVM
99.87
RF and KNN
99.96
3 SVM and KNN and RF
99.90
3.4 Comparative Study of SLC
Approaches
Several studies on SLC have been presented.
(Soetedjo and Somawirata, 2018) present a method
for speed limit sign classification using features such
ICAART 2024 - 16th International Conference on Agents and Artificial Intelligence
372
as HOG and Maximally Stable Extremal Regions
(MSER) and achieved a classification rate of
93.67%.Another study introduces a speed limit sign
classification technique based on the HOG and ring
areas by (Soetedjo et al., 2017). The method divides
an image into multiple rings and computes the HOG
feature on each ring. In the matching process, a
weight is assigned to each ring to calculate the HOG
feature distance between the test image and the
reference image. Experimental results show that the
proposed algorithm achieves a high classification rate
of 97.8%. Regarding the study realised by (Saadna et
al., 2019), a two-SVM cascade architecture are
designed in the classification phase. The first SVM is
trained on the GTSRB dataset to determine whether
the detected region is a speed limit sign or not, and
the second SVM is trained on the MNIST dataset to
recognize the value of speed limit signs. The system
achieves a precision of 99.08% on the GTSRB
dataset. Comparing various obtained results through
DS theory and SV fusion, KNN and RF fusion using
DeepSL as a feature extractor are the best, achieving
a classification rate of 99.98% and 99.96%
respectively. Furthermore, this result surpasses the
performance of the other studies mentioned earlier.
To confirm these performances in real-world
scenarios, a validation of the proposed approach is
realised in the next part.
4 IMPLEMENTATION AND
VALIDATION OF THE
PROPOSED SLR SYSTEM
4.1 Software Validation
Software validation is an essential step to confirm the
efficiency and reliability of the proposed SLR system.
In this section, the system is validated using a car
simulator in addition to computer and road scenes.
4.1.1 Simulator Validation
A simulator is a tool that provides interactive virtual
environments similar to real life to simulate situations
in various fields, including the automotive industry.
The choice has been to enhance an open-source
simulator called Udacity (Du et al., 2019), initially
containing only the map, by incorporating various
signs and signals such as 30 km/h, 50 km/h, 60 km/h,
70 km/h, and 80 km/h to test the proposed solution.
In order to validate the SLR system through the
car simulator, two steps must be completed: the
training mode generating a trained CNN model for
autonomous driving and the autonomous mode
testing the effectiveness of the SLR system in real
scenarios. An example of simulating this driving
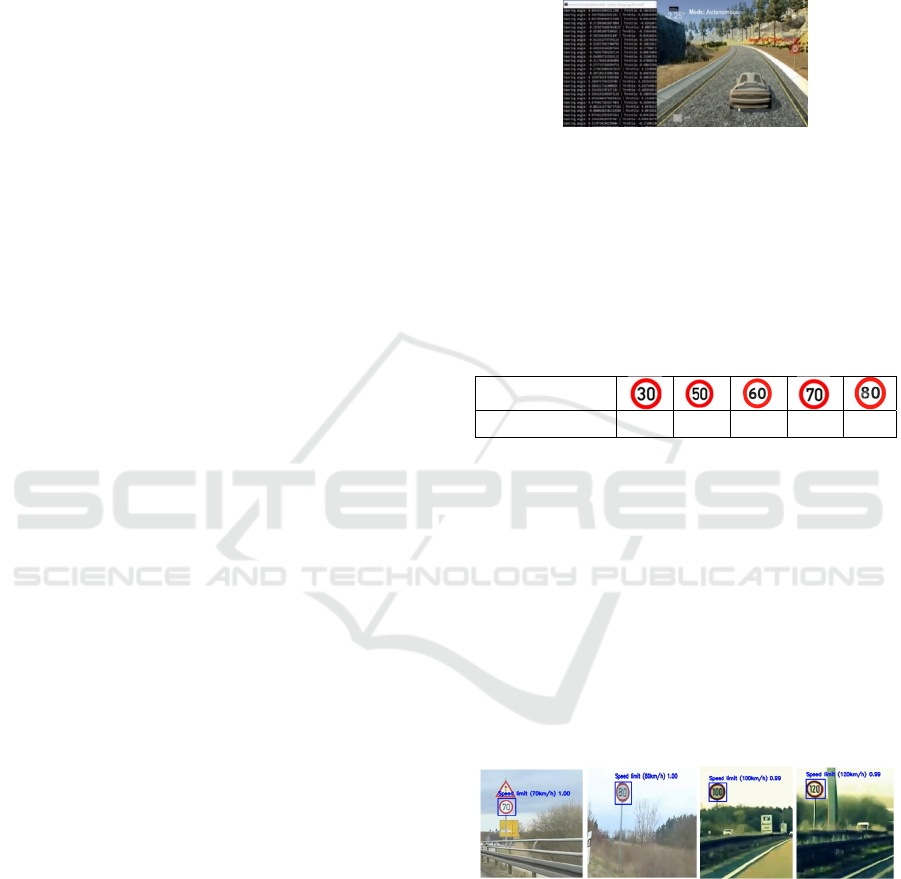
mode is depicted in Figure 7.
Figure 7: Example of recognized sign using the simulator
in autonomous mode.
A test is conducted on the simulator, and its
performance results are collected in Table 6. SLR
system correctly recognizes (CR) various signs which
enhances reliability and provides reassurance for any
potential real tests.
Table 6: Results of SLR system via the simulator.
SL road signs
CR / Total signs 3/3 3/3 1/1 1/1 1/1
4.1.2 Validation by Simulation
Validation by simulation through driving sequences
on urban roads or highways is a common approach
for testing and validating recognition systems,
especially those related to road signs. Indeed, this
type of validation allows for simulating different
environmental driving conditions and evaluating the
recognition system's performance in various
scenarios. In order to validate the proposed SLR
system through simulation, a video sequence
describing a road scene, rich in speed limit signs,
lasting approximately three minutes, is used.
Figure 8: Examples of SL signs correctly recognized by the
SLR system.
Simulation is first performed using a PC (Intel®
Core (TM) i5-7200 CPU, 64-bit, 8 GB RAM) and
Google Colab with 12.4 GB of RAM. To evaluate the
system's performance, recognition time and
classification rate are calculated. The system achieves
an average of 0.06s to identify each detected sign in
the case of PC simulation and an average of 0.025s
New Speed Limit Recognition System: Software and Hardware Validation
373

using Colab. Figure 8 shows examples of correctly
recognized SL signs by SLR system.
4.2 Hardware Validation
The hardware architecture of a system varies
depending on its specific processing and performance
requirements. Indeed, there are different hardware
architectures based on a CPU (Central Processing
Unit), GPU (Graphics Processing Unit), FPGA
(Field-Programmable Gate Array), or heterogeneous
architectures that combine different types of units to
leverage their specific advantages (Hu et al., 2022).
In order to validate an architecture on a hardware
target, the performance of the core used for image
processing (execution time and accuracy), available
memory and its type for efficient resource use, and
the availability of libraries and development tools to
facilitate implementation, testing, and future
improvements must be taken into account. Based on
a study of the characteristics of the different types of
boards, the validation and evaluation of the SLR
system are carried out on the Raspberry Pi 4. Indeed,
this choice is based on its technical specifications and
its adaptability for artificial intelligence applications.
In fact, featuring a quad-core ARM Cortex-A72
processor, the used Raspberry Pi 4 board provides
enhanced processing capabilities with 4GB of RAM.
Moreover, it is configured with the necessary
software and with the appropriate image processing
and ML and DL libraries such as OpenCV,
TensorFlow, Keras, etc. necessary for the proper
functioning of the system. Once the system is
installed, the same driving sequence used for software
validation is reused to perform hardware validation in
order to be faithful to the real-world environment. In
this step, the camera is positioned facing the screen to
view the video sequence. Tests are conducted to
assess the SLR performance, including processing
speed and the recognition rate of road signs. Obtained
results are summarized in Table 7.
Table 7: Evaluation results of the SLR system on Raspberry
Pi 4 board.
Results
Raspberry Pi
4
Correctl
y
reco
g
nized SL si
g
ns 18/20
Unrecognized SL signs 0/20
Incorrectly recognized SL signs 2/20
Average SL sign recognition spee
d
0.15s (6 ips)
Some work related to the SLR system has
undergone experiments on the Raspberry Pi board.
(Akshay et al., 2018) develop a SLR system using a
Raspberry Pi, focusing on SL signs, and considering
the stability of color detection under varying daylight
conditions. The results show that their system
achieves an accuracy of 80% with processing times
of up to 2s. Furthermore (Isa et al., 2022) implement
a real-time SLR system using the Raspberry Pi 3
board with ML algorithms to identify sign types and
send alerts to the driver, considering 5 different sign
classes. Results show that the average accuracy of
sign recognition across the five classes is above 90%,
and the maximum average time to determine the sign
type in the system is 3.44 s when the car is traveling
at 50 km/h. The proposed SLR system surpasses the
mentioned approaches in terms of precision
concerning the number of classes, with a score of
90% (18 well
recognized signs /20) for 9 classes and in
terms of processing time, with an average of 0.15 s.
5 CONCLUSIONS
The design and implementation of autonomous
vehicles are fields of research that are constantly
evolving. SLR system is an important component for
ADAS and ADS, given its considerable contribution
to user comfort, improved road safety, and adherence
to traffic rules. To achieve reliable recognition,
several parameters and constraints must be taken into
account, including environmental conditions and
response time. Indeed, signs may exhibit variations in
their appearance, degradation, and partial obstruction.
Moreover, this system must be fast and efficient in
sign detection, classification, and interpretation to
make appropriate decisions within timely intervals.
This paper proposes a comprehensive SLR
approach, covering a detection module based on Haar
Cascade technique, a classification module
employing a new model (DeepSL), and a fusion
module using the DS theory and EL. Obtained results
are very satisfactory. In fact, the classification rates
reach 99.98% and 99.96%, respectively, for DS
theory and the voting technique. The proposed
approach is rigorously evaluated through simulation
and hardware validation on the Raspberry Pi 4 board,
demonstrating promising results in terms of accuracy
and processing time, achieving a correctly
recognizing 18 out of 20 road signs images, across 9
different SL classes (from the GTSRB dataset) with a
processing time of 0.15 s. Ultimately, this research
significantly contributes to the improvement of the
driver road safety and the transportation efficiency by
providing valuable insights for the implementation of
an SLR system. As a continuation of this work, we
propose to expand the SLR system to recognize a
wider range of sign categories from different
ICAART 2024 - 16th International Conference on Agents and Artificial Intelligence
374

countries in order to improve recognition in various
contexts. Additionally, we contemplate hardware
validation using various hardware architectures like
SoC and Nano Jetson boards for real-world testing.
REFERENCES
Agudo, D., Sánchez, Á., Vélez, J.F., Belén Moreno, A.,
2016. Real-time railway speed limit sign recognition
from video sequences, in 2016 International
Conference on Systems, Signals and Image Processing
(IWSSIP).
Akshay, G., Dinesh, K., Scholars, U., 2018. Road sign
recognition system using raspberry pi.” International
Journal of Pure and Applied Mathematics 119, 15 ,
1845–1850.
Bi, Y., 2012. The impact of diversity on the accuracy of
evidential classifier ensembles. International Journal of
Approximate Reasoning 53 4 , 584–607.
Brown, J.B., 2018. Classifiers and their Metrics Quantified.
Molecular Informatics 37 1–2 , 1700127.
Dempster, A., 2008. Upper and Lower Probabilities
Induced by a Multivalued Mapping. pp. 57–72.
Du, S., Guo, H., Simpson, A., 2019. Self-Driving Car
Steering Angle Prediction Based on Image Recognition
Hu, N., Wang, C., Zhou, X., 2022. FLIA: Architecture of
Collaborated Mobile GPU and FPGA Heterogeneous
Computing. Electronics 11 22 , 3756.
Isa, I.S.B.M., Yeong, C.J., Azyze, N.L.A. bin M.S., 2022.
Real-time traffic sign detection and recognition using
Raspberry Pi. International Journal of Electrical and
Computer Engineering (IJECE) 12 1 , 331–338.
Kundu, S., Mackens, P., 2015. Speed Limit Sign
Recognition Using MSER and Artificial Neural
Networks.
Li, Y., Mogelmose, A., Trivedi, M.M., 2016. Pushing the
“Speed Limit”: High-Accuracy US Traffic Sign
Recognition With Convolutional Neural Networks.
IEEE Transactions on Intelligent Vehicles.
Liu, B., Liu, H., Luo, X., Sun, F., 2012. Speed Limit Sign
Recognition Using Log-Polar Mapping and Visual
Codebook.
Mammeri, A., Boukerche, A., Feng, J., Wang, R., 2013.
North-American speed limit sign detection and
recognition for smart cars, in: 38th Annual IEEE
Conference on Local Computer Networks - Workshops.
pp. 154–161.
Minary, P., Pichon, F., Mercier, D., Lefevre, E., Droit, B.,
2017. Face pixel detection using evidential calibration
and fusion. International Journal of Approximate
Reasoning 91, 202–215.
Miyata, S., 2017. Automatic Recognition of Speed Limits
on Speed-Limit Signs by Using Machine Learning.
Journal of Imaging 3 3 , 25.
Mohammed, A., Kora, R., 2023. A comprehensive review
on ensemble deep learning: Opportunities and
challenges. Journal of King Saud University -
Computer and Information Sciences 35 2 , 757–774.
Rout, N., Mishra, D., Mallick, M., 2018. Handling
Imbalanced Data: A Survey. pp. 431–443.
Saadna, Y., Behloul, A., Mezzoudj, S., 2019. Speed limit
sign detection and recognition system using SVM and
MNIST datasets. Neural Computing and Applications
31.
Soetedjo, A., Somawirata, I., 2017. Circular traffic sign
classification using hogbased ring partitioned
matching. International Journal on Smart Sensing and
Intelligent Systems 10, 735–753.
Soetedjo, A., Somawirata, I.K., 2018. Speed Limit Traffic
Sign Classification Using Multiple Features Matching,
in: Electrical Engineering. Springer, Singapore, pp.
210–217.
Triki, N., Karray, M., Ksantini, M., 2023. A Real-Time
Traffic Sign Recognition Method Using a New
Attention-Based Deep Convolutional Neural Network
for Smart Vehicles. Applied Sciences 13 8 , 4793.
Triki, N., Ksantini, M., Karray, M., 2021. Traffic Sign
Recognition System based on Belief Functions Theory,
in: Proceedings of the 13th International Conference on
Agents and Artificial Intelligence, SCITEPRESS, pp.
775–780.
Viola, P., Jones, M., 2001. Rapid object detection using a
boosted cascade of simple features, in: Proceedings of
the 2001 IEEE Computer Society Conference on
Computer Vision and Pattern Recognition, USA, p. I-
511-I–518.
Wintersberger, P., Riener, A., 2016. Trust in Technology as
a Safety Aspect in Highly Automated Driving. i-com 15
3 , 297–310. doi:10.1515/icom-2016-0034
Xu, P., Davoine, F., Zha, H., Denœux, T., 2016. Evidential
calibration of binary SVM classifiers. International
Journal of Approximate Reasoning, BELIEF 2014 –
Third International Conference on Belief Functions 72,
55–70.
Yan, G., Ming, Y., Shi, S., Feng, C., 2017. The recognition
of traffic speed limit sign in hazy weather. Journal of
Intelligent & Fuzzy Systems 33, 1–11.
New Speed Limit Recognition System: Software and Hardware Validation
375
