
Contactless Camera-Based Detection of Oxygen Desaturation Events and
ODI Estimation During Sleep in SAS Patients
Belmin Ali
´
c
1 a
, Samuel Tauber
1 b
, Reinhard Viga
1 c
, Christian Wiede
2 d
and Karsten Seidl
1,2 e
1
Department of Electronic Components and Circuits, University of Duisburg-Essen, Duisburg, Germany
2
Fraunhofer Institute for Microelectronic Circuits and Systems, Duisburg, Germany
Keywords:
Contactless, Camera-Based, Oxygen Desaturation Detection, ODI, Sleep Apnea, SAS, Feature Extraction,
rPPG, Near-Infrared, Far-Infrared.
Abstract:
Recurrent nocturnal breathing cessation leads to the reduction of the blood oxygen level and eventually to
oxygen desaturation. Oxygen desaturation events are traditionally detected during a polysomnography in a
sleep laboratory. In this work, a contactless camera-based oxygen desaturation detection and oxygen desatu-
ration index (ODI) estimation method based on the analysis of multispectral videos is proposed. The method
is based on the extraction and analysis of remote photoplethysmography (rPPG) signals at wavelengths of 780
nm and 940 nm from the forehead and a breath temperature signal via far-infrared (FIR) thermography from
the subnasal region. A manual feature extraction is designed to extract relevant medical and physiological pa-
rameters out of the aforementioned signals in order to design a Feed-Forward Neural Network (FFNN)-based
classifier, which classifies between periods with and without desaturation events. For the evaluation of the pro-
posed method, a patient dataset involving 23 symptomatic sleep apnea patients is collected. The classification
accuracy between desaturation events and periods without a desaturation based on the leave-one-patient-out
cross-validation (LOPOCV) metric is 95.4 %. The ODI stage estimation resulted in a correct estimation in 22
out of 23 patients for a two-stage ODI classification and in a correct estimation in 21 out of 23 patients for a
four-stage ODI classification.
1 INTRODUCTION
The sleep apnea syndrome (SAS) is a sleeping dis-
order characterized by recurring cessations of airflow
during sleep, leading to a number of complaints, such
as daytime sleepiness, concentration problems, and
risk of cardiovascular diseases (Rundo, 2019). Re-
current breathing cessation leads to the reduction of
the blood oxygen level and eventually hypoxemia
(Rashid et al., 2021). Episodes of hypoxemia dur-
ing sleep are referred to as oxygen desaturation events
(Smith et al., 1996). A desaturation is defined as a
decrease in the SpO
2
value by at least 3 % (Berry
et al., 2020). The prevalence of desaturation events is
summarized in the oxygen desaturation index (ODI),
which is the average number of desaturation events
a
https://orcid.org/0000-0002-2630-3945
b
https://orcid.org/0009-0003-9227-1288
c
https://orcid.org/0000-0002-7019-6307
d
https://orcid.org/0000-0002-2511-4659
e
https://orcid.org/0000-0001-6197-5037
per hour of sleep (Temirbekov et al., 2018). The ODI,
together with the apnea-hypopnea index (AHI), is one
of the two most important indicators for the severity
of SAS (Rashid et al., 2021).
The gold standard for diagnosing SAS is
polysomnography (PSG), a multi-parametric mea-
surement conducted in sleep laboratories. A PSG in-
volves a high number of contact-based sensors, result-
ing in patient discomfort and unnatural sleeping be-
havior, which may lead to biased measurement results
(Smolley, 2023). A contactless alternative the poten-
tial to reduce the drawbacks of a PSG and further-
more, enable sleep diagnostics outside of sleep lab-
oratories. A very promising direction for contactless
sleep diagnostics are camera-based solutions.
In this work, an oxygen desaturation detection
and ODI estimation method based on the analysis
of multispectral videos is proposed. The method is
based on the extraction and analysis of remote pho-
toplethysmography (rPPG) signals from two near-
infrared (NIR) wavelengths from the forehead and a
breath temperature signal from the subnasal region.
Ali
´
c, B., Tauber, S., Viga, R., Wiede, C. and Seidl, K.
Contactless Camera-Based Detection of Oxygen Desaturation Events and ODI Estimation During Sleep in SAS Patients.
DOI: 10.5220/0012349100003657
Paper published under CC license (CC BY-NC-ND 4.0)
In Proceedings of the 17th International Joint Conference on Biomedical Engineering Systems and Technologies (BIOSTEC 2024) - Volume 1, pages 599-610
ISBN: 978-989-758-688-0; ISSN: 2184-4305
Proceedings Copyright © 2024 by SCITEPRESS – Science and Technology Publications, Lda.
599
2 RELATED WORK
The first method for measuring a photoplethysmog-
raphy (PPG) signal without direct contact to the hu-
man skin was proposed in (Humphreys et al., 2005).
Light from two infrared LEDs (760 nm and 880 nm)
was emitted through the index finger and the trans-
mitted light was measured by a CMOS camera 40
cm away. Later the same year, in (Wieringa et al.,
2005), the concept for a contactless PPG-based mea-
surement of the peripheral oxygen saturation (SpO
2
)
via rPPG was introduced. Between 2005 and 2023,
a total of twelve studies dealing with the contactless
measurement of SpO
2
have been obtained in a litera-
ture screening conducted as a part of this study. An
overview of these studies is provided in Table 1.
Ten studies involved optical methods based on the
analysis of rPPG signals from multiple wavelengths,
while two are based on respiratory movement analy-
sis via radar. The regions of interest (ROI) for the sig-
nal source varied between the hand (Wieringa et al.,
2005) (Tsai et al., 2014) (Liao et al., 2023) and the
face (Lingqin et al., 2013) (Guazzi et al., 2015) (Shao
et al., 2016) (Addison et al., 2017) (Vogels et al.,
2018) (Rosa and Betini, 2020) (Wieler et al., 2021)
for methods based on rPPG, and the thorax (Tran and
Al-Jumaily, 2019) (Toften et al., 2021) for methods
based on the Doppler effect. All studies introduced
a regression analysis method to determine the SpO
2
value, except (Addison et al., 2017), where detection
of hypoxia was performed. Three studies involved
sleeping subjects (Vogels et al., 2018) (Tran and Al-
Jumaily, 2019) (Toften et al., 2021), out of which the
latter two involved symptomatic SAS patients.
The following observations and conclusions are
made based on the overview of related work: (1) the
regression of the SpO
2
value via contactless meth-
ods is a non-trivial task; (2) there are still insufficient
patient studies for conclusive evidence on the med-
ical applicability of the proposed methods; (3) the
majority (9 out of 12) of studies are conducted with
100
1000
10000
100000
1000000
300 400 500 600 700 800 900 1000
Molar extinction coefficient / cm
-1
/M
Wavelength / nm
Hb HbO2
780 nm
940 nm
Visible lightUV NIR
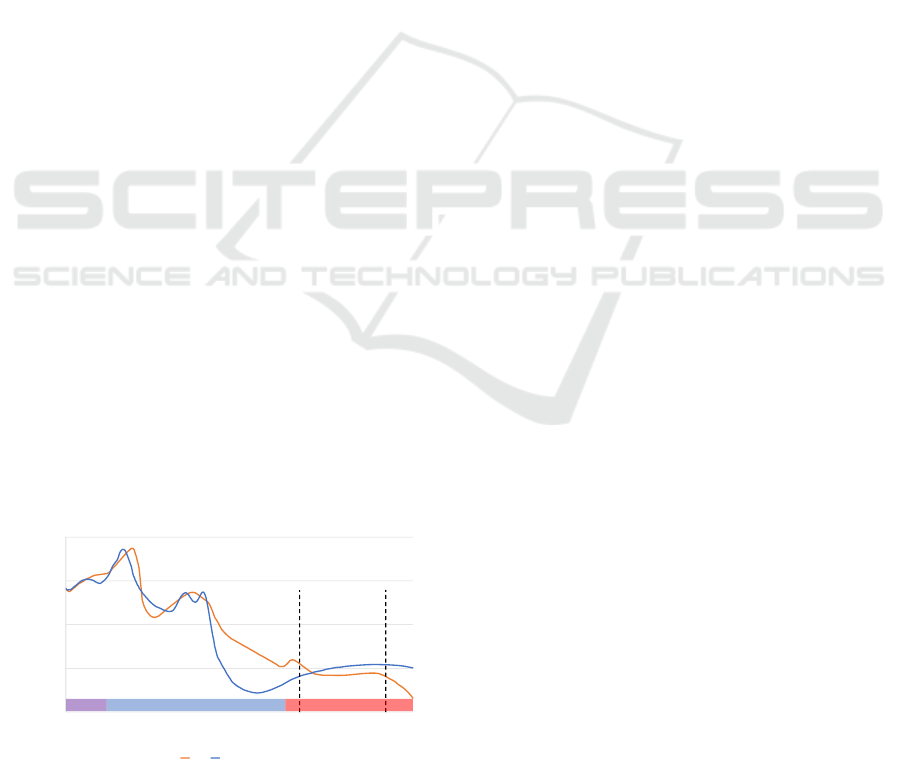
Figure 1: Absorption behavior of Hb (orange) and HbO
2
(blue) with respect to the wavelength of the incident light
(Prahl, 1998).
healthy test subjects and only three included measure-
ments in the hypoxemic range; (4) all studies have a
small number of test subjects (in the one-digit or low
double-digit range), which is insufficient for conclu-
sive proof of principle concerning demographic vari-
ability; (5) none of the listed studies dealt with the
detection of oxygen desaturation events nor the esti-
mation of the ODI score; and (6) there is an evident
necessity for further work in this area.
3 METHODS
3.1 Selection of Biosignals
Peripheral oxygen saturation (SpO
2
) is the percentage
of oxyhemoglobin in the total hemoglobin. Oxyhe-
moglobin and deoxyhemoglobin experience dissimi-
lar light absorption behavior, as shown in Figure 1
(Prahl, 1998). In order to determine the amount of
oxyhemoglobin in the blood, at least two rPPG signals
at distinct wavelengths need to be measured. Further-
more, the first wavelengths should be chosen so that
the absorption ratio of oxyhemoglobin is higher than
the absorption ratio of deoxyhemoglobin, and vice
versa for the second wavelength. Further details on
this principle may be found in (Mannheimer et al.,
1997).
An external light source is necessary for a contin-
uous SpO
2
measurement during the night with a cam-
era. In order not to interrupt the sleeping person, the
light source, as well as the wavelengths of the rPPG
signals, need to be selected in the NIR spectrum. By
analyzing the Hb and HbO
2
absorption behavior from
Figure 1, taking into account the selection criteria
mentioned previously, and considering the specifica-
tions of optical components available on the market,
a combination of the 780 and 940 nm wavelengths is
selected.
Oxygen desaturation events often take place di-
rectly after a patient experiences an apneic event, due
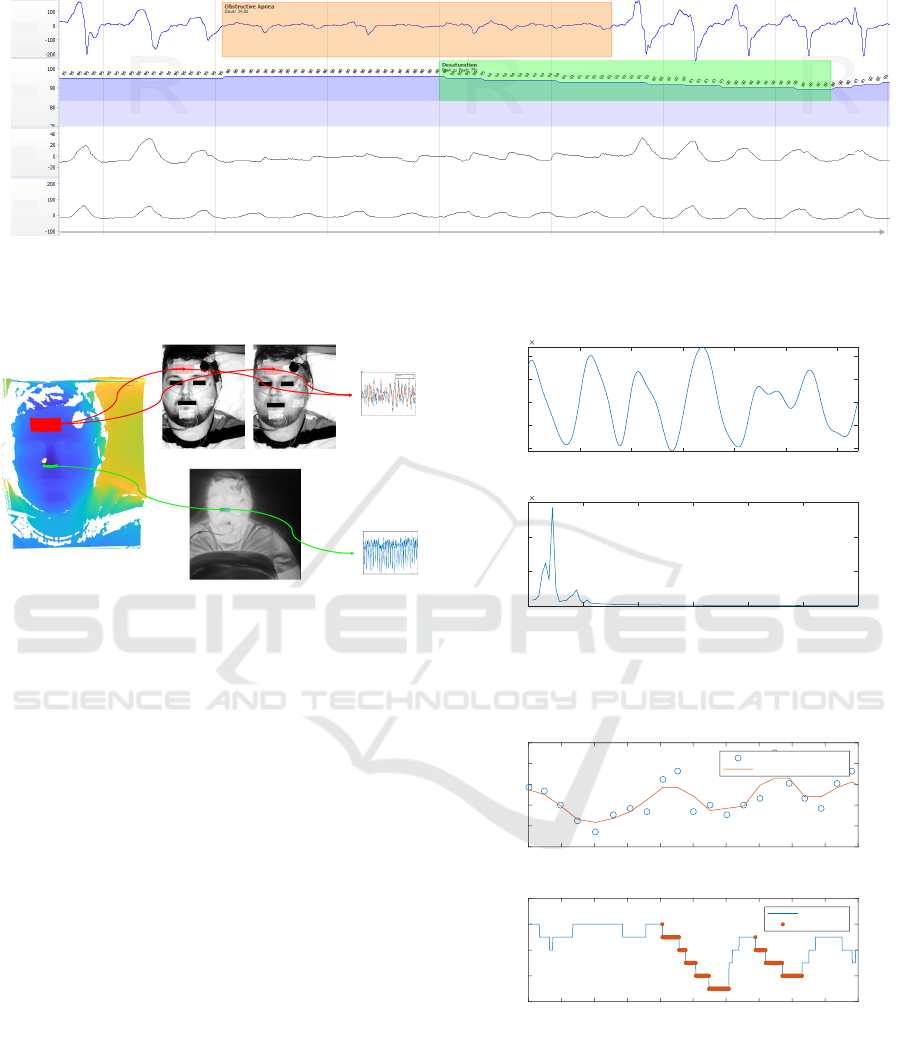
to the continued cessation in breathing. Figure 2
shows a section of a PSG measurement from a pa-
tient enrolled in this study which displays four biosig-
nals: 1) the airflow measured with a nasal cannula; 2)
the SpO
2
value measured with a pulse oximeter; 3)
the movement of the thorax measured with an induc-
tive respiration sensor; and 4) the movement of the
abdomen measured also by an inductive respiration
sensor. An obstructive apnea is detected and labeled
on the airflow signal, while a desaturation event is la-
beled on the SpO
2
signal. By examining the timing
of these two events, it can be noticed that the de-
saturation event starts approx. 20 seconds after the
BIOSIGNALS 2024 - 17th International Conference on Bio-inspired Systems and Signal Processing
600

Table 1: Overview of publications on contactless measurement of SpO
2
.
Publication Study topic ROI Test subjects
(Wieringa et al., 2005) Proof of concept study Hand healthy, awake
(Lingqin et al., 2013) SpO
2
Regression via rPPG Face healthy, awake
(Tsai et al., 2014) SpO
2
Regression via rPPG Hand healthy, awake
(Guazzi et al., 2015) SpO
2
Regression via rPPG Face healthy, awake
(Shao et al., 2016) SpO
2
Regression via rPPG Face sick, awake
(Addison et al., 2017) Hypoxia detection via rPPG Face healthy, awake (porcine)
(Vogels et al., 2018) SpO
2
Regression via rPPG Face healthy, asleep
(Tran and Al-Jumaily, 2019) SpO
2
Regression via Radar Thorax sick, asleep
(Rosa and Betini, 2020) SpO
2
Regression via rPPG Face healthy, awake
(Toften et al., 2021) SpO
2
Regression via Radar Thorax sick, asleep
(Wieler et al., 2021) SpO
2
Regression via rPPG Face healthy, awake (infant)
(Liao et al., 2023) SpO
2
Regression via rPPG Hand healthy, awake
apnea. Furthermore, the desaturation event ends ap-
prox. 20 seconds after the apnea has ended, leading to
a restoration of the baseline SpO
2
level. This corre-
lation between nocturnal respiratory events and oxy-
gen desaturation events could therefore be a signifi-
cant tool to detect oxygen desaturation events. Hence,
in addition to the two rPPG signals, a new biosignal
is introduced: the breath temperature signal measured
in the subnasal region (equivalent to the measurement
location of a nasal cannula during PSG) via FIR ther-
mography.
3.2 Signal Acquisition
For the acquisition of the three aforementioned
biosignals, a multi-modal camera system is used. The
camera systems consists of: 1) a real-time NIR 3D
sensor for analyzing head motion; 2) a NIR cam-
era with a central wavelength of λ
c
= 780 nm and a
full width at half maximum bandwidth of FW HM =
10 nm; 3) a NIR camera with λ
c
= 940 nm and
FW HM = 10 nm; 4) a far-infrared (FIR) thermogra-
phy camera with a noise equivalent temperature dif-
ference of NET D < 0.05
◦
C at 30
◦
C/50 mK; and 5)
one LED with λ
c
= 780 nm and FWHM = 28 nm and
three LEDs with λ
c
= 940 nm and FW HM = 37 nm.
More details on the multi-modal camera system may
be found in previous publications (Zhang et al., 2020)
(Ali
´
c et al., 2023a) (Ali
´
c et al., 2023b).
Two ROIs are detected and tracked on the 3D im-
age sequences, namely an ROI on the forehead for the
extraction of the rPPG signals and an ROI in the sub-
nasal region for the extraction of the breath tempera-
ture signal. The generated 3D ROIs are then projected
onto the 2D images from the NIR and FIR cameras.
The rPPG signals are extracted using the approach
presented in (Zhang et al., 2020), which is based on
Eulerian video magnification (Wu et al., 2012). The
breath temperature signal is generated by pixel-wise
averaging of temperature values in the ROI in each
frame of the FIR thermography camera. The signal
acquisition is demonstrated in Figure 3.
3.3 Data Labeling
The labeling of desaturation events in the PSG mea-
surement is done semi-automatically. A first label-
ing iteration is done automatically by the Noxturnal
sleep scoring software. In the second iteration, a sleep
physician manually confirms the labeled events and
checks for missed events. The extracted time-series
signals are synchronized with the corresponding data
from a PSG reference measurement by system clock
alignment. The timestamps of the labeled desatura-
tion events and periods with a stable SpO
2
value are
applied to the extracted biosignals. Resaturation pe-
riods, i.e. periods after a desaturation in which the
SpO
2
value is being restored to the baseline value, are
not labeled.
3.4 Signal Preprocessing
The first step in the preprocessing of the three raw
time-domain signals is detrending. Detrending is per-
formed with the Detrending moving average algo-
rithm with a window size of 150 samples (equiva-
lent to ten seconds). Hereby, the superimposed DC
signal components are removed for a more system-
atic data comparison. The DC components may differ
during one or between two measurements due to en-
vironmental and lighting factors (e.g. ambient light,
moonlight and sky clearness), patient demographics
(e.g. age and skin type) and movements (e.g. sleep
position, head rotation and restless leg syndrome).
After detrending, three finite impulse response
band-pass filters with distinct cut-off frequencies are
applied. The high-pass (HP) and low-pass (LP) cut-
off frequencies for each filter are given in Table 2.
Contactless Camera-Based Detection of Oxygen Desaturation Events and ODI Estimation During Sleep in SAS Patients
601
00:00:00 00:00:10 00:00:20 00:00:30 00:00:40 00:00:50 00:01:00 t / hh:mm:ss
Flow
mcmH
2
O
SpO
2
%
Thorax
μV
Abdomen
μV
Figure 2: A section of a PSG recording in Noxturnal consisting of (from top to bottom): 1) Respiratory flow signal with a
labeled obstructive apnea; 2) SpO
2
signal with a labeled desaturation event; 3) Thorax movement signal; and 4) Abdomen
movement signal.
rPPG signals
Temperature
signal
3D image
Thermal (FIR) image
780 nm 940 nm
Forehead ROI
Nostrils ROI
0 200 400 600 800 1000 1200 1400 1600 1800 2000
video frame index
35.8
35.9
36
36.1
36.2
36.3
36.4
36.5
36.6
te
m
pe
r
atu
r
e of n ost
r
ils
RO
I
160 180 200 220 240 260 280 300 320 340
video frame index
-16
-14
-12
-10
-8
-6
-4
-2
0
2
4
i
nt
e
ns
i
ty
10
-4
ppgsignal 780 nm
ppgsignal 940 nm
Figure 3: Extraction of rPPG and temperature (FIR) signals
from multi-modal 3D video data.
The cut-off frequencies of each band-pass filter are
designed in order to emphasize relevant information
in designated frequency spectra: 1) to remove high-
frequency noise; 2) to isolate signal components as-
sociated with the heart rate; and 3) to isolate signal
components associated with the respiration rate. A
list of filters, their respective cut-off frequencies, and
the signals to which they are applied are given in Ta-
ble 2.
3.5 Feature Extraction
The main challenge in differentiating between pe-
riods with and without a desaturation event is de-
tecting and extracting medically significant features,
which are able to distinguish between the two event
classes. The feature detection process is conducted
in two approaches: (1) through discussions with sleep
medicine experts on expected physiological processes
and biosignal behavior; and (2) through screening of
the signal waveform, spectral and statistical analysis.
A desaturation event is expected to occur 10 to 30
seconds after the beginning of an apneic event (Borer,
2011). Consequently, the analysis of the respiratory
activity prior to an event may contribute to the dis-
100 105 110 115 120 125 130
Time[s]
-2
-1
0
1
2
Amplitude
10
-3
Filtered 780nm [HP: 0.1Hz , TP: 0.5Hz]
0 0.5 1 1.5 2 2.5 3
Frequency [Hz]
0
0.5
1
1.5
Amplitude
10
-3
FFT of Filtered 780nm Signal
Figure 4: Section of the filtered 780 nm signal (above); and
its Fourier transformation to determine the respiration rate
(below).
160 170 180 190 200 210 220 230 240 250 260
Time [s]
10
11
12
13
14
15
Respiration Rate
Estimated Respiration Rate from 780nm Peaks
Current Respiration Rate
Moving Average
160 170 180 190 200 210 220 230 240 250 260
Time [s]
88
90
92
94
96
SpO2 [%]
SpO2
SpO2 Signal
Desaturation
Figure 5: Respiration rate estimation by peak-to-peak anal-
ysis of the 780 nm signal (above); and SpO
2
reference sig-
nal with labeled desaturation events (below).
tinction between desaturation events and stable SpO
2
periods. Furthermore, due to the restoration of respi-
ratory activity after the end of the apneic event, higher
respiratory activity is to be expected during and di-
rectly after desaturation events. To qualitatively ex-
BIOSIGNALS 2024 - 17th International Conference on Bio-inspired Systems and Signal Processing
602
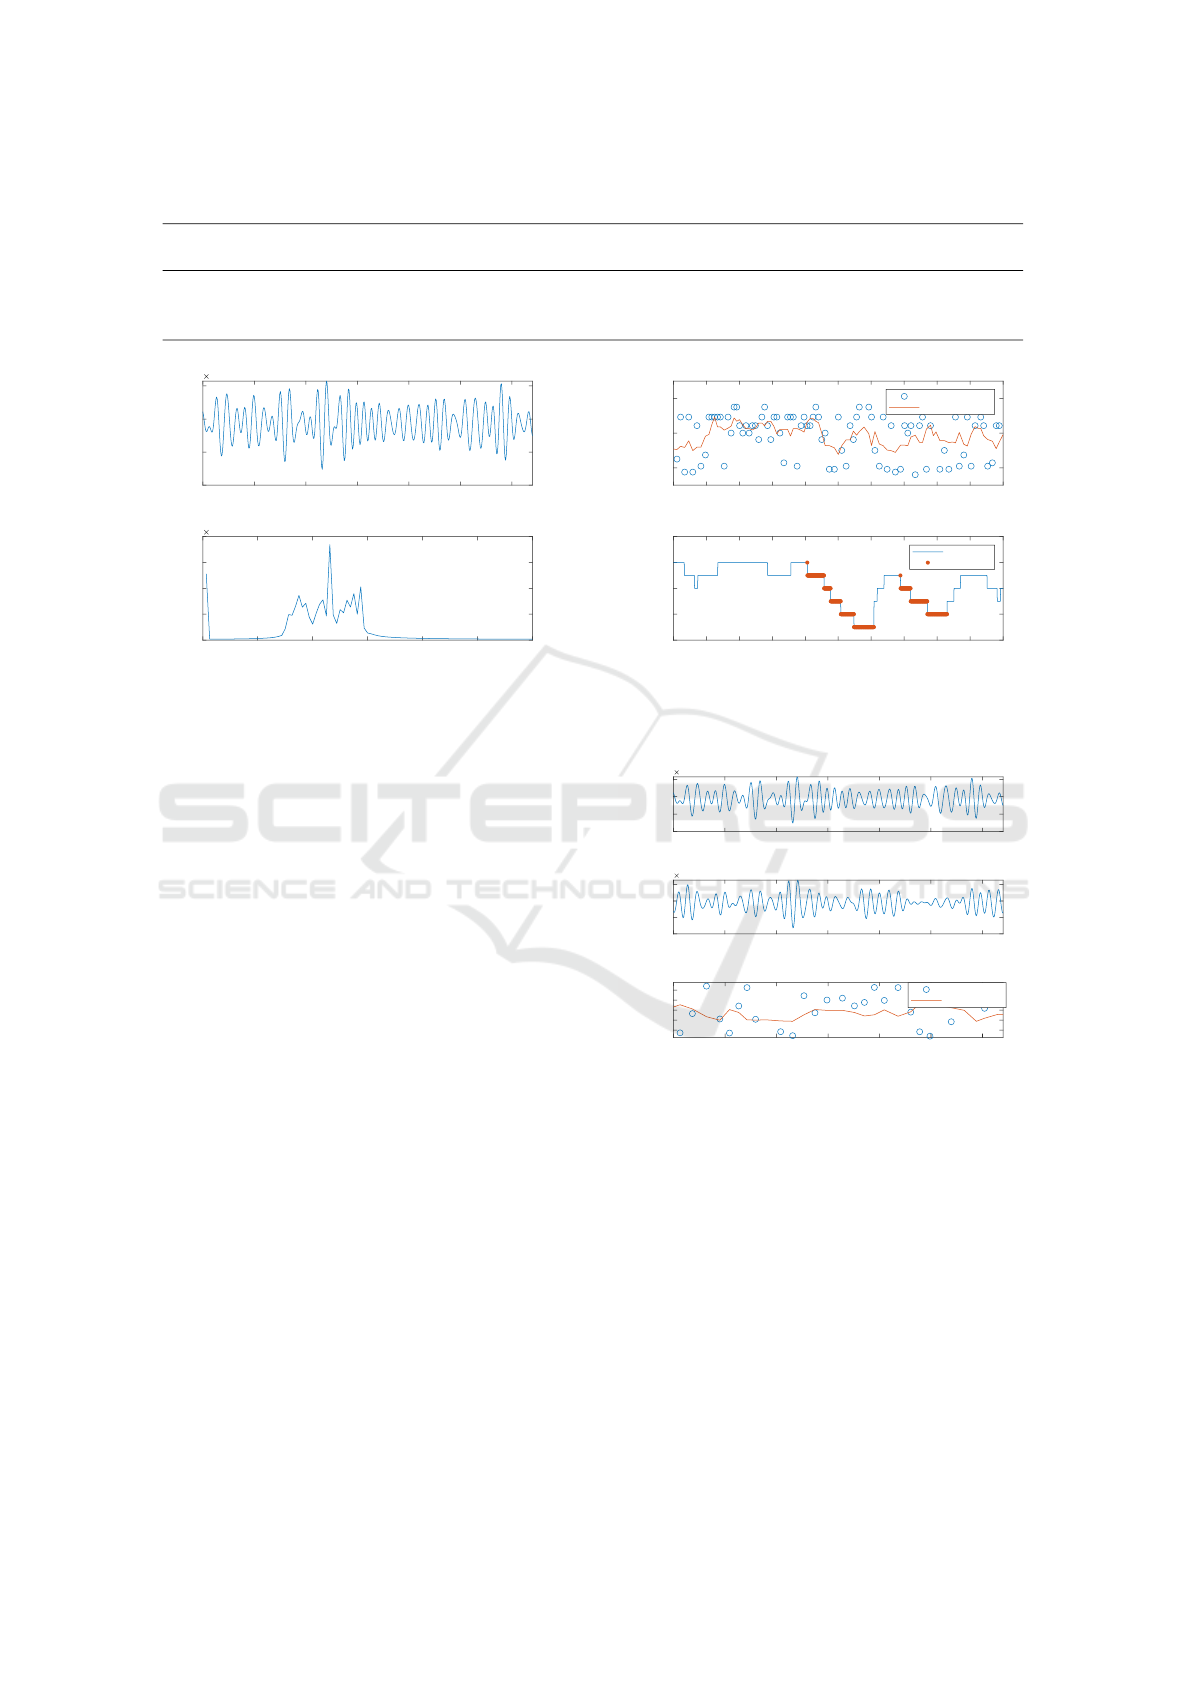
Table 2: Characterization of band-pass filters applied to the 780 nm and 940 nm rPPG signals and FIR thermography signal.
HP
(Hz)
LP
(Hz)
HP
(rpm)
LP
(rpm)
Applied to
780 nm signal
Applied to
940 nm signal
Applied to
FIR signal
Filter purpose
0.1 3 6 180 yes yes yes Denoising
0.8 1.4 48 84 yes yes no Isolating heart rate
0.1 0.5 6 30 yes yes yes Isolating respiration rate
100 105 110 115 120 125 130
Time [s]
-10
-5
0
5
Amplitude
10
-4
Filtered 780nm [HP: 0.8Hz , TP: 1.4Hz]
0 0.5 1 1.5 2 2.5 3
Frequency [Hz]
0
0.5
1
1.5
2
Amplitude
10
-4
FFT of Filtered 780nm Signal
Figure 6: Section of the filtered 780 nm signal (above) and
its Fourier transformation to determine the heart rate (be-
low).
amine this hypothesis, a section of a 780 nm rPPG
signal is selected and a Fast Fourier Transformation
(FFT) is applied to it (after band-pass filtering) in or-
der to detect the respiratory rate. The respiratory rate
is assumed to be the highest peak in the frequency
spectrum. This rPPG signal section is presented in
Figure 4. By increasing the section to a 100-second-
long sample, computing the instantaneous peak fre-
quency, and applying a moving average filter (with a
window size of four samples), the hypothesis stated
previously is confirmed. A decreased respiratory ac-
tivity is registered before both desaturation events in
the sample, while an increased respiratory activity is
registered during the desaturation events. This sample
is presented in Figure 5.
Due to reduced oxygen intake, the body activates
adaptation mechanisms to compensate for the lack of
oxygen. This may lead to increased and arrhythmic
heart rate (Rossi et al., 2012). In order to qualitatively
analyze the correlation between changes in heart rate
and oxygen saturation, the same analysis is performed
on the same signal sample with the only difference
being the cut-off frequencies of the band-pass filter.
There is no qualitatively detectable change in heart
rate during or after a desaturation event. This analysis
is presented in Figures 6 and 7. Nevertheless, fea-
tures for analyzing the correlation between arrhyth-
mic heart activity and desaturation events are imple-
mented and evaluated in the feature selection stage.
160 170 180 190 200 210 220 230 240 250 260
Time [s]
40
60
80
Heart Rate
Estimated Heart Rate from 780nm Peaks
Current Heart Rate
Moving Average
160 170 180 190 200 210 220 230 240 250 260
Time [s]
88
90
92
94
96
SpO2 [%]
SpO2
SpO2 Signal
Desaturation
Figure 7: Heart rate estimation by peak-to-peak analysis of
the 780 nm signal (above); and SpO
2
reference signal with
labeled desaturation events (below).
100 105 110 115 120 125 130
Time [s]
-10
-5
0
5
Amplitude
10
-4
100 105 110 115 120 125 130
Time[s]
-10
-5
0
5
Amplitude
10
-4
100 105 110 115 120 125 130
Time [s]
0
0.2
0.4
0.6
0.8
Ratio
Current Ratio
Moving Average
Filtered 780nm [HP: 0.8Hz , TP: 1.4Hz]
Filtered 940nm [HP: 0.8Hz , TP: 1.4Hz]
Ratio of Ratios of 780nm and 940nm Signal
Figure 8: Section of the filtered 780 nm signal (above); sec-
tion of the filtered 940 nm signal (middle); and Ratio-of-
ratios estimation (below).
Having two PPG signals with correctly chosen
wavelengths enables the direct computation of the
SpO
2
value by using the ratio-of-ratios method. How-
ever, the SNR of rPPG signals is significantly lower
compared to contact-based PPG. Qualitative analyses
showed that the direct computation of the SpO
2
value
with the collected rPPG signals and the ratio-of-ratios
method is not feasible. Nevertheless, is it analyzed
whether there is a correlation between the computed
ratio-of-ratios and desaturation events by performing
the same analysis as previously, with the addition of
adding the 940 nm rPPG signal (Figure 8). The mov-
Contactless Camera-Based Detection of Oxygen Desaturation Events and ODI Estimation During Sleep in SAS Patients
603
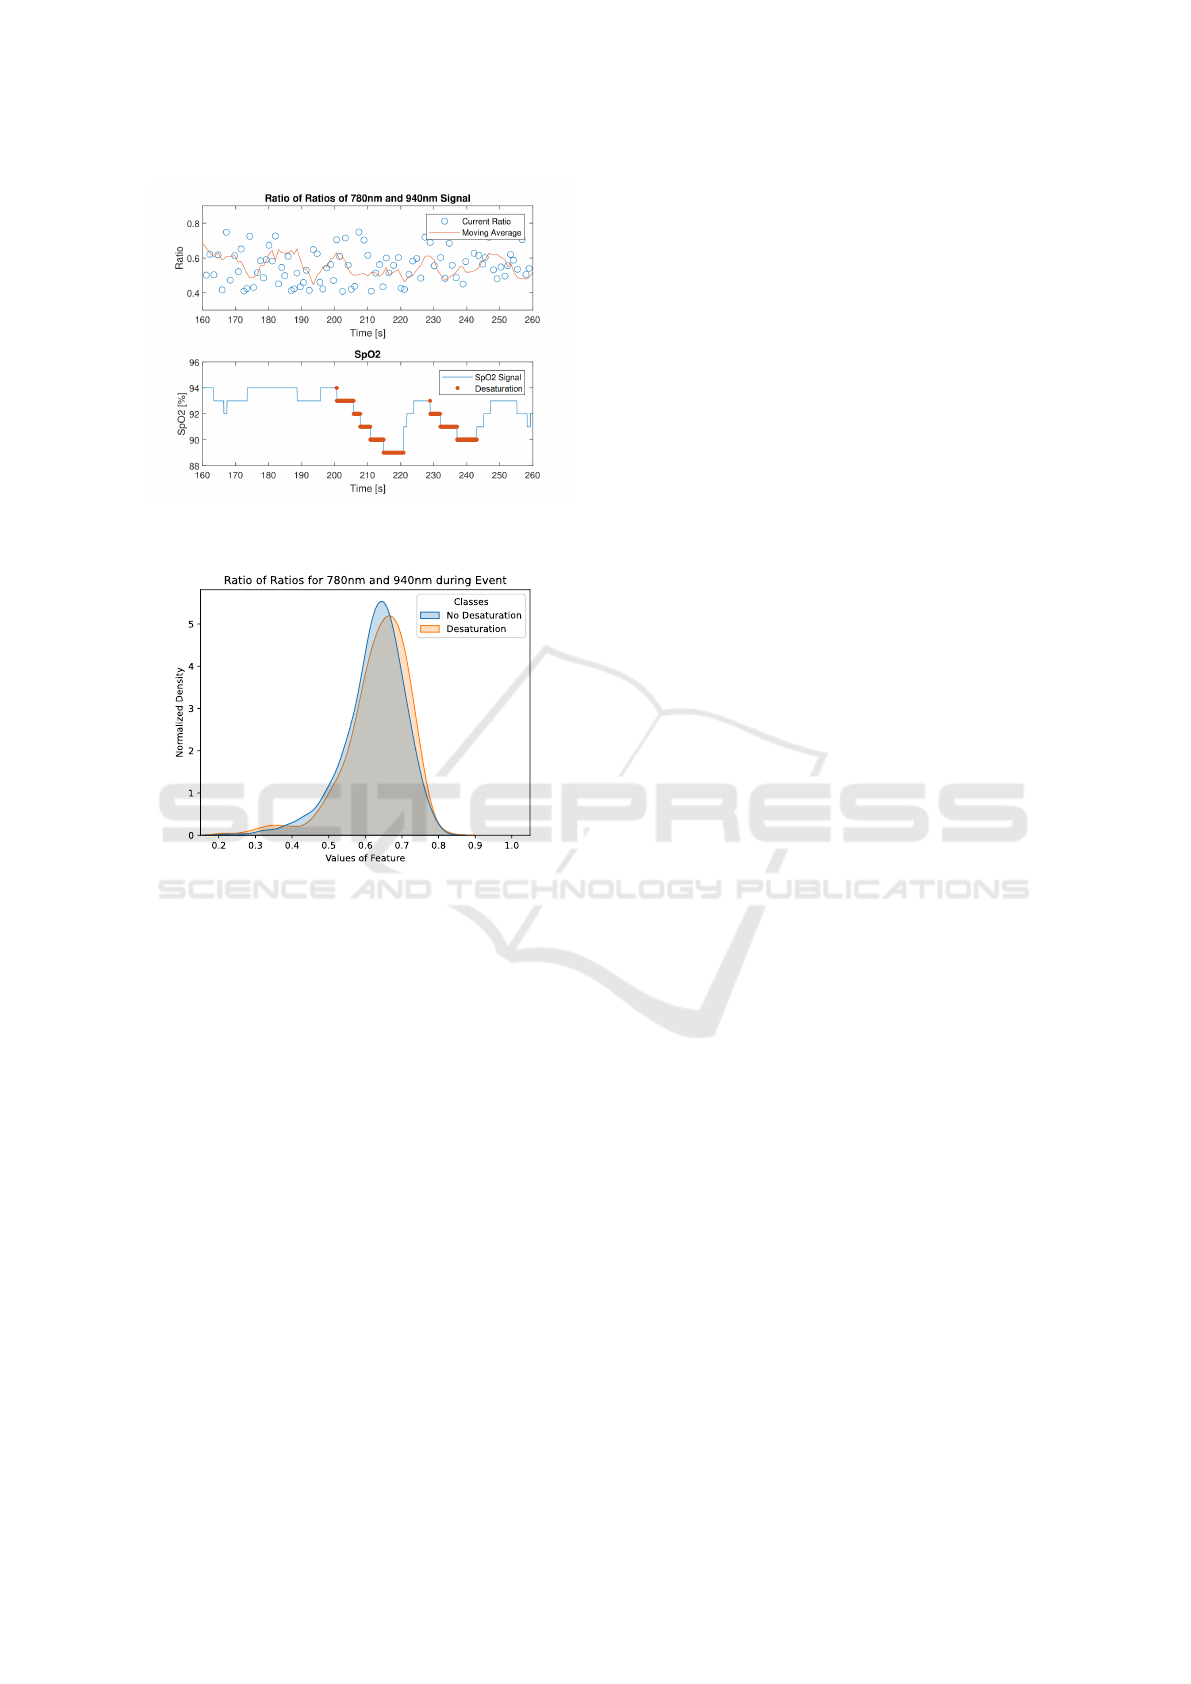
Figure 9: Ratio-of-ratios estimation (above); and SpO
2
ref-
erence signal with labeled desaturation events (below).
Figure 10: Histogram of the distribution of the Ratio-of-
ratios value between periods with and without a desatura-
tion event.
ing average of the ratio value in Figure 9 shows no
evident correlation neither to the reference SpO
2
nor
to the periods before or during a desaturation event.
The cross-correlation of the two signals resulted in
r = 0.21, indicating a low correlation. To further ana-
lyze the significance of the ratio-of-ratios as a feature,
a continuous histogram showing the statistical distri-
bution of the value of this feature among the collected
patient dataset is computed and presented in Figure
10. There is a significant overlap of the two classes
with a slight tendency for a higher value in desatura-
tion event samples.
Besides features implemented based on expected
physiological behavior, statistical, spectral, and signal
waveform features are implemented. Due to space re-
strictions, only a few selected features are presented
in detail, while the best-performing features are pre-
sented in subsection 3.6. During the analysis of the
expected physiological behavior, it is concluded that
not only the behavior during the event is of interest,
but also periods prior to and directly after the event.
This approach is applied to the other types of features
as well.
Figure 11 shows the continuous histograms of four
selected features. The upper left histogram shows the
distribution of the mean value of the 940 nm rPPG
signal during an event. The upper right histogram
shows the distribution of the median value of the
FIR signal during an event. The lower left histogram
shows the distribution of the total energy of the 780
nm rPPG signal during an event. The lower right his-
togram shows the distribution of the spectral centroid
of the 940 nm rPPG signal prior to an event. The
first observation that can be made is that there is no
significant correlation between the features, meaning
that the features show properties of statistical inde-
pendence. The second observation with all four fea-
tures is that there is no feature that can completely
separate the two classes. However significant areas
without overlap of the two classes exist, which could
indicate that they may contribute to the classification
among the event classes.
3.6 Feature Selection
A multi-stage sequential backward selection (SBS)
method for feature selection is applied in order to
determine the optimal feature subset for subsequent
classification. The SBS is evaluated with a random
forest classifier. The fourth iteration of SBS resulted
in an optimal feature subset of the size 25 with a
classification accuracy of 81 %. Additional SBS it-
erations give lower accuracies and are therefore dis-
carded. The optimal feature subset, together with sig-
nals the features are applied to, filtering strategy, and
the timing are summarized in Table 3. Regarding the
type of features in the optimal subset, eight are re-
lated to respiratory activity, six are statistical, five are
spectral, three are based on the signal waveform, two
are related to heart rate activity and the final one is
the ratio-of-ratios. Regarding the timing, thirteen are
during the event, eight are prior to the event and four
are after the event.
3.7 Event Classification
For the classification between desaturation events and
events with a stable SpO
2
value, a fully connected
feedforward neural network (FFNN) classifier is de-
signed. The number of input neurons is equal to
the number of features in the optimal subset (25),
while there is a single neuron in the output layer.
The network topology and hyper-parameter optimiza-
tion are performed iteratively. The best-performing
network topology is shown to be a two-hidden-layer
BIOSIGNALS 2024 - 17th International Conference on Bio-inspired Systems and Signal Processing
604
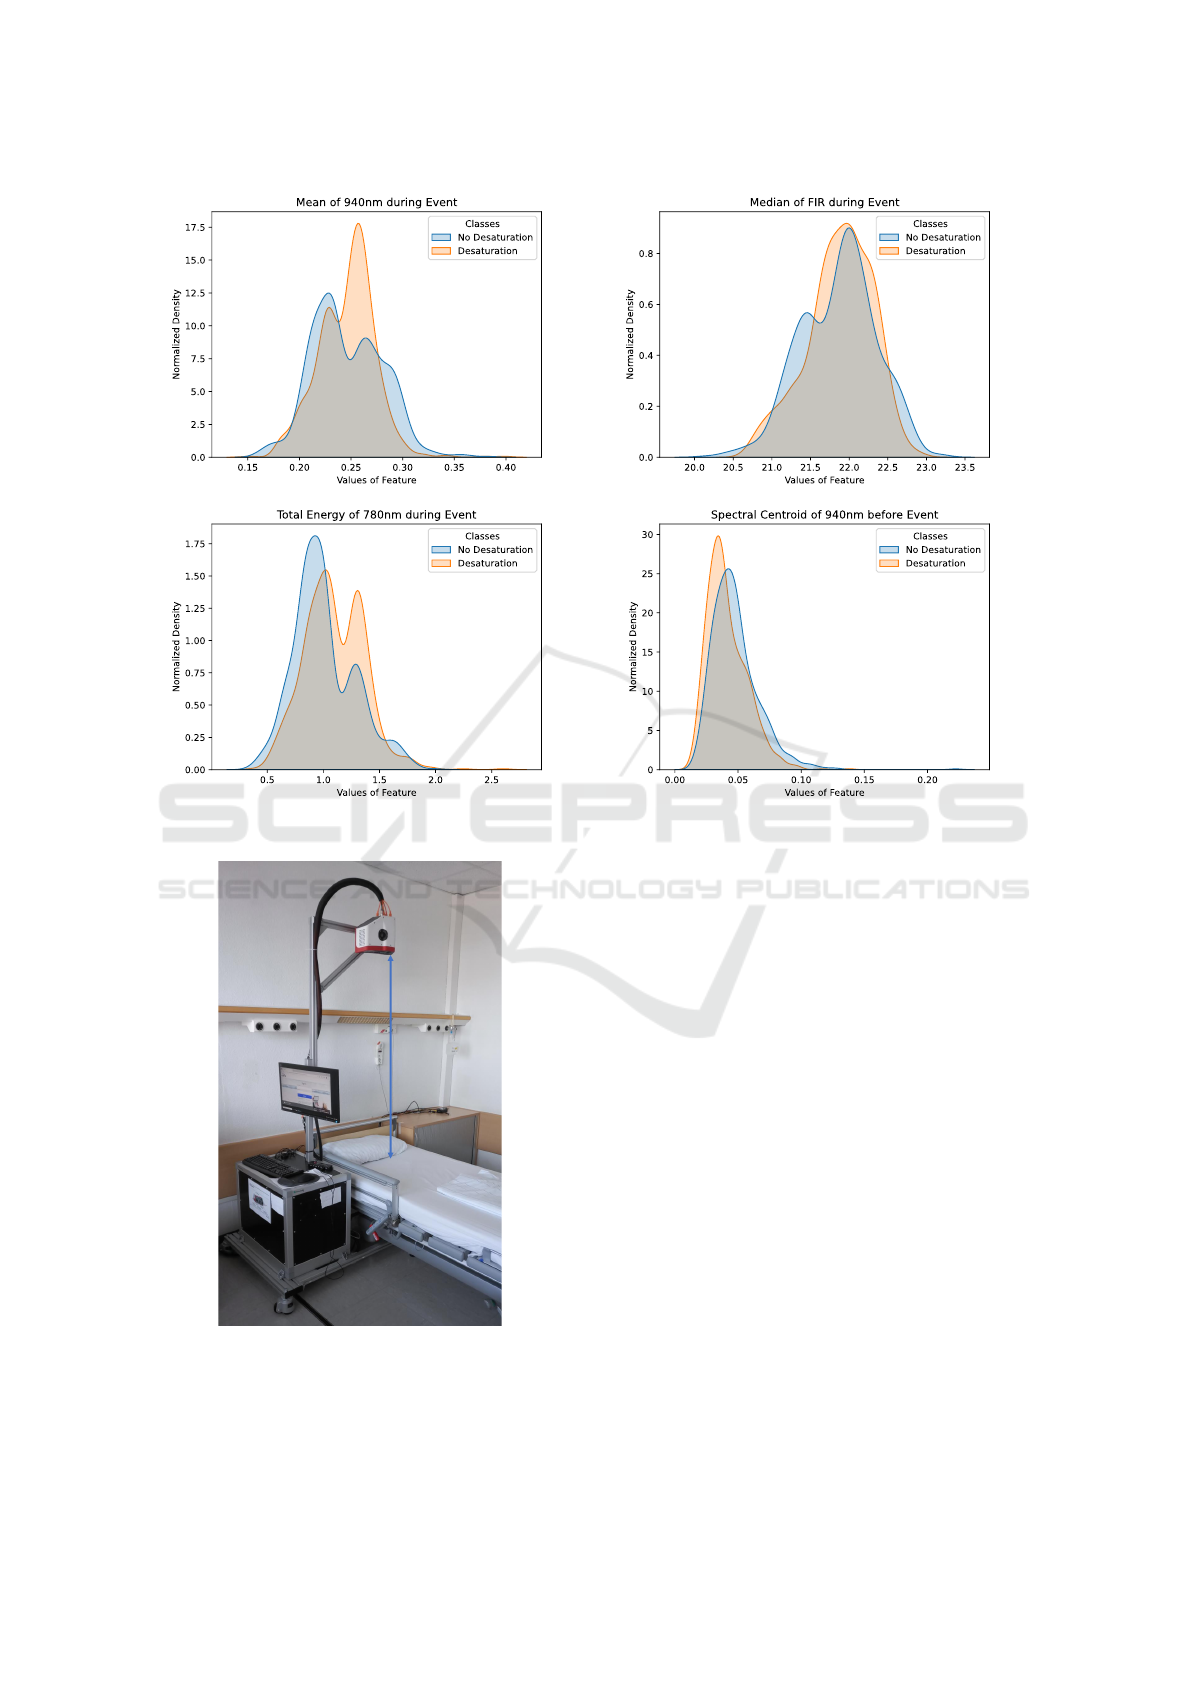
Figure 11: Histograms showing the distribution of four statistical features among classes with and without desaturation events.
150 cm
Figure 12: Measurement setup in the sleep laboratory.
structure with 64 and 32 neurons in the first and
second hidden layer respectively. The activation
function in both hidden layers is the rectified lin-
ear unit (ReLU), while a sigmoid activation function
is used for the output neuron. The optimal hyper-
parameter set, as well as the trial range for each hyper-
parameter, is shown in Table 4. The evaluation of
the model accuracy is based on leave-one-patient-out
cross-validation (LOPOCV). In LOPOCV, the data
from one patient is left aside for validation and a
model is trained using the data from the remaining
patients. This process is repeated N times, where N is
the number of patients in the dataset. As a result, N
classification accuracies from the N cross-validation
iterations are obtained. The final model accuracy is
given as the average classification accuracy of the N
iterations.
3.8 ODI Estimation
The ODI value estimation is performed with a linear
regression analysis based on forming the quotient of
the number of detected desaturation events n
desat
and
the recorded sleep duration t
rec
. The mathematical de-
scription of the regression model is given in Equation
1. The coefficients a and b are computed in the train-
ing phase. The evaluation of the model is based on
LOPOCV.
Contactless Camera-Based Detection of Oxygen Desaturation Events and ODI Estimation During Sleep in SAS Patients
605

Table 3: The list of the best 25 features computed by a multi-stage sequential backward selection.
Feature Signals Filtering strategy Period
Mean 940 nm, FIR Denoising During event
Mean 940 nm, FIR Denoising Prior to event
Median 940 nm, FIR Denoising During event
Spectral Slope 940 nm Denoising During event
Spectral Centroid 940 nm Denoising During event
Spectral Kurtosis FIR Denoising During event
Spectral Entropy 780 nm, FIR Denoising During event
Auto-correlation 780 nm Denoising During event
Total Energy 780 nm, 940 nm Denoising During event
Fundamental Frequency 780 nm Isolating respiration rate Prior to event
Fundamental Frequency 780 nm, FIR Isolating respiration rate After event
Spectral Distance 780 nm, 940 nm, FIR Isolating respiration rate Prior to event
Peak to Peak Distance FIR Isolating respiration rate Prior to event
Peak to Peak Distance FIR Isolating respiration rate During event
Fundamental Frequency 780 nm, 940 nm Isolating heart rate After event
Ratio-of-ratios 780 nm, 940 nm Isolating heart rate During event
Table 4: Hyper-pinarameter tuning range and final parame-
ter set for FFNN classifier.
Hyper-parameter Trial set Optimal set
Activation
function
Sigmoid,
ReLU, Tanh
ReLU
Learning
rate
0.001, 0.005,
0.01, 0.05, 0.1
0.001
Epochs
50, 100,
150, 200
200
Batch Size
1, 5, 20,
32, 64, 128
5
ODI severity is typically classified either in two
stages or in four stages (Varghese et al., 2022). The
distinction between the stages is based on predefined
ODI value thresholds. The threshold values are pre-
sented in Table 5.
ODI
Est
= a ·
n
desat
t
rec
+ b (1)
3.9 Patient Study
In order to collect data and evaluate the proposed
methods, a patient study is conducted in cooperation
with the Center for Sleep Medicine of the University
Hospital Essen. The multi-modal camera system is
installed in a dedicated room in the sleep laboratory
and patients undergoing a PSG are filmed with the
camera system in parallel to the PSG. The measure-
ment setup is shown in Figure 12. The sensor head
is placed perpendicularly to the pillow at a 150 cm
distance from the mattress. This sensor positioning
allows for successful signal extraction while the pa-
tients sleep on their backs. However, a signal extrac-
Table 5: Distribution of ODI score severity in two and four
stages.
Two-stage ODI Four-stage ODI
ODI Severity ODI Severity
≤ 5 normal
< 15 normal 5 < ODI < 15 mild
≥ 15 abnormal 15 ≤ ODI < 30 moderate
≥ 30 severe
tion is not possible if the head of the patient is com-
pletely rotated to the side, or the patient sleeps on their
stomach. This leads to ”blind” measurement periods.
A total of 40 patients between April 2022 and
April 2023 were recruited for the study. All 40
patients were transferred to the Center for Sleep
Medicine because of a suspected SAS and this was
their initial diagnosis measurement. The patients slept
without any therapeutic devices, such as continuous
positive airway pressure (CPAP) machines or oral ap-
pliances. The study yielded 23 successful measure-
ments with sleeping periods recorded by the camera
system. Four measurements were unsuccessful due
to camera failure, while no useful image sequences
could be extracted from 13 measurements. The mean
AHI in the 23 successful recordings is 26.8 (21.7),
while the mean ODI is 26.0 (17.9). The trend that
male patients suffer from SAS more frequently com-
pared to female patients is noticeable in the sample
since 70 % of the patients are male. The mean age
is 53.6 (13.1) and the mean BMI is 26.9 (5.5). A to-
tal of 796 desaturation events and 799 periods with
stable SpO
2
values are recorded. An overview of the
patient sample is provided in Table 6. The column
Recorded time [h] indicates the number of sleep hours
successfully recorded by the camera system. The col-
BIOSIGNALS 2024 - 17th International Conference on Bio-inspired Systems and Signal Processing
606
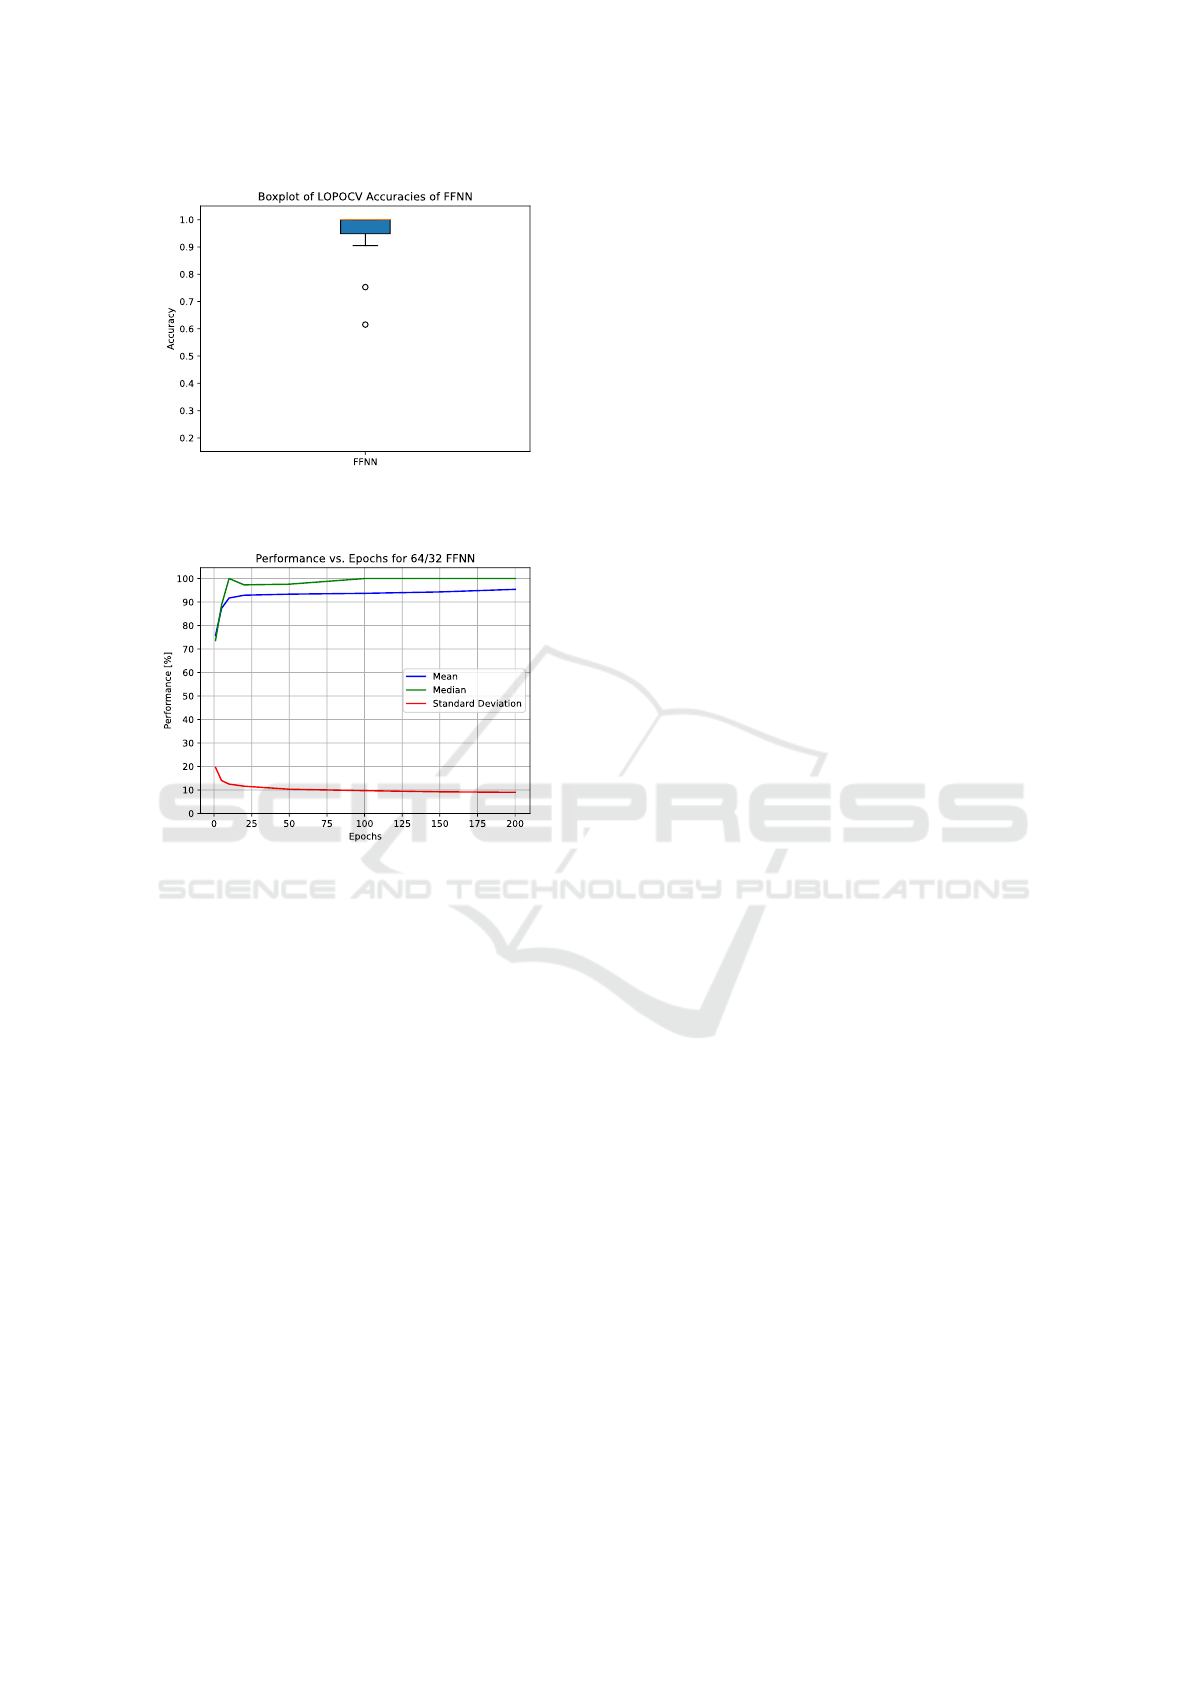
Figure 13: Boxplot of the LOPOCV classification accuracy
of the 64/32 FFNN classifier.
Figure 14: Training performance of the 64/32 FFNN classi-
fier.
umn Desats recorded indicates the number of desat-
uration events present in that time (according to the
PSG and not the camera-based detection algorithm).
The column ODI during recorded time [h] represents
the quotient of the two aforementioned columns, in-
dicating the reference ODI value during the periods
successfully recorded by the camera system.
This study is approved by the Ethics Committee
of the Faculty of Medicine, University of Duisburg-
Essen (approval no. 21-10312-BO).
4 RESULTS
The classification accuracy between desaturation
events and periods with a stable SpO
2
value is deter-
mined by the FFNN model presented in subsection
3.7 and evaluated using LOPOCV. The accuracy for
all 23 patients is presented in form of a boxplot in Fig-
ure 13. The mean classification accuracy is 95.4 %.
A classification accuracy of over 90 % is achieved
with 21 patients, having only two outliers at 75 %
and 62 %. The training performance of the model is
shown in Figure 14.
The results of the ODI value estimation are pre-
sented in the Bland-Altman plot in Figure 15. As can
be seen from the plot, there is no evident bias present
between the two values. Regarding the 95 % limits
of agreement (LoA), 21 measurements are within the
LoA, while there are only two outliers slightly over
the LoA. The results of the ODI stage estimation are
divided into a two-stage and a four-stage problem, as
defined in Table 5. The two-stage problem resulted
in a correct prediction with 22 out of the 23 patients
(96 %). The four-stage problem resulted in a correct
prediction with 21 out of the 23 patients (91 %). Fig-
ure 16 shows the true and predicted ODI stages for
all 23 patients. Patients with the IDs 0000 and 0019
are the only two patients whose ODI stage is not pre-
dicted correctly. However, in both of these cases, the
difference between the true and predicted stages is off
by one stage. For patient 0000 a moderate ODI is
predicted, while the reference system indicates a mild
ODI. On the other hand, for patient 0019 a severe ODI
is predicted, while the reference system indicated a
moderate ODI. In both cases, the estimation algorithm
overestimated the ODI stage of the patients.
5 DISCUSSION
The focus of this work is the detection of oxygen de-
saturation events and their distinction to periods with-
out a desaturation event, rather than the regression of
the SpO
2
value. The previous studies listed in Section
2 do not deal with such a distinction, thus making a
direct comparison of algorithm accuracy unfeasible.
Regarding the desaturation detection accuracy of ex-
isting sleep scoring software tools for PSG, a study
was conducted in (Karhu et al., 2022), where the event
detection accuracy of three sleep scoring tools was
compared to manual scoring. The following accura-
cies were achieved on a sample of 100 patients: 1)
Noxturnal: 97.3 %; 2) ABOSA: 97.1 % and 3) Pro-
fusion: 96.1 %. The detection accuracy of 95.4 %
achieved by the contactless approach presented in this
paper on a sample of 23 patients deviates from the de-
tection accuracy of the best-performing sleep scoring
tool Noxturnal by only 1.9 %. Sleep medicine ex-
perts from the University Hospital Essen gave a pos-
itive evaluation for this accuracy and stated that the
accuracy is sufficiently high to be applied in medical
practice.
Since ODI estimation with contactless methods
was not conducted in any of the related studies men-
tioned in Section 2, a direct comparison and evalua-
tion are not feasible. Therefore, the results of the ODI
Contactless Camera-Based Detection of Oxygen Desaturation Events and ODI Estimation During Sleep in SAS Patients
607
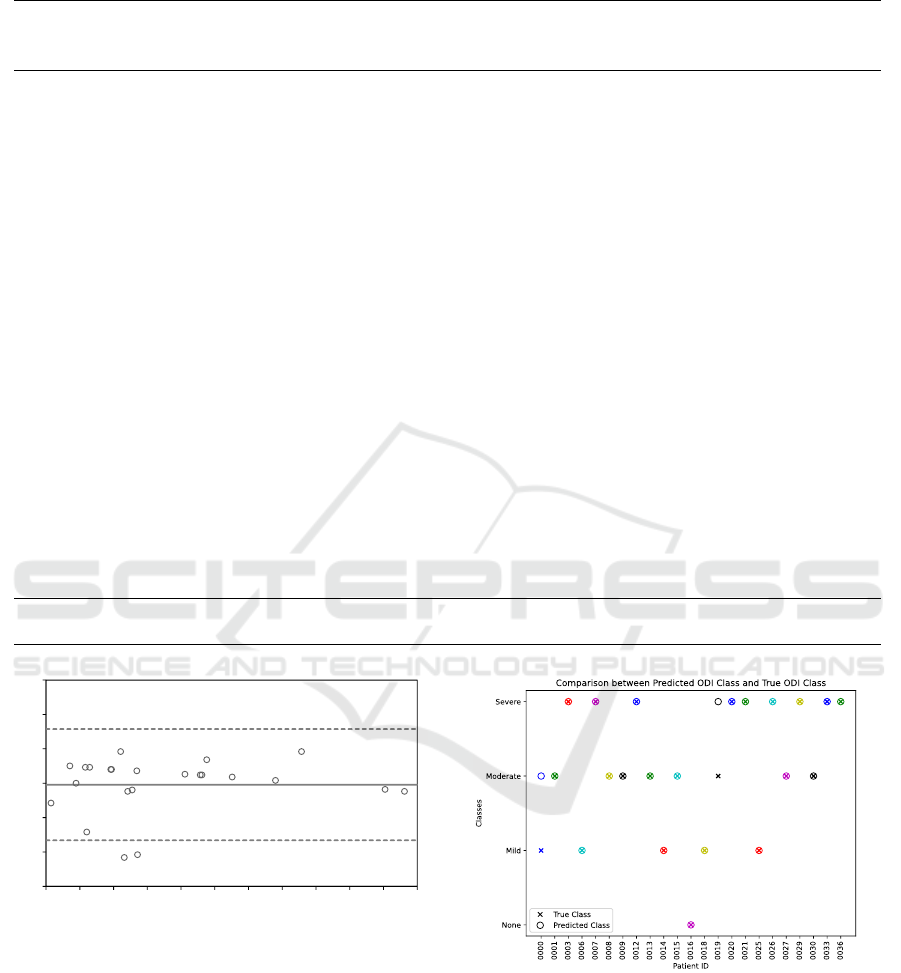
Table 6: Overview of the collected patient sample.
Patient
ID
Sex Age BMI AHI ODI
Sleep
time [h]
Recorded
time [h]
ODI during
recorded
time [h]
Desats.
in PSG
Desats.
recorded
0000 m 27 29.7 14.5 9.4 5.45 3.90 8.5 59 33
0001 m 48 30.2 11.9 33.7 2.85 1.18 17.8 144 21
0003 f 51 28.7 29.0 34.6 6.23 2.78 49.3 210 137
0006 f 52 22.0 12.2 10.2 5.00 0.90 8.9 64 8
0007 m 56 35.9 69.9 78.0 5.62 2.86 78.0 483 223
0008 m 37 33.6 30.2 28.9 1.52 0.68 23.6 179 16
0009 f 57 33.3 9.9 8.8 4.75 0.76 25.0 70 19
0012 m 52 32.1 12.7 12.2 5.58 0.79 41.8 91 33
0013 m 50 27.8 12.1 16.7 7.42 0.41 24.4 124 10
0014 m 80 21.1 20.9 10.7 5.40 3.69 14.1 64 52
0015 f 63 36.5 12.2 16.5 5.08 0.49 20.4 116 10
0016 m 67 28.7 7.4 25.9 5.23 0.09 0.0 152 0
0018 f 54 37.6 35.2 29.0 3.08 1.57 8.3 156 13
0019 m 58 35.1 59.7 62.8 6.18 0.96 21.9 422 32
0020 m 45 30.5 84.9 65.6 6.28 0.18 106.0 434 19
0021 m 51 34.6 55.6 63.3 5.97 0.22 68.2 435 15
0025 m 60 30.0 55.0 28.8 3.43 0.78 12.8 169 10
0026 f 27 18.9 5.2 10.7 5.78 0.77 46.8 67 36
0027 f 55 31.2 18.6 16.0 4.18 3.02 20.2 89 61
0029 m 62 24.8 53.3 44.5 3.96 0.09 55.6 252 5
0030 m 63 27.5 29.8 13.1 6.33 0.18 27.8 150 5
0033 m 79 25.2 14.0 22.8 6.86 0.07 100.0 157 7
0036 m 38 43.4 31.9 30.9 5.95 0.67 46.3 197 31
Mean 0.7 m 53.6 29.6 26.8 26.0 5.1 1.2 35.9 186.3 34.6
STD n/a 13.1 5.5 21.7 17.9 1.4 1.2 28.5 128.4 48.9
-15
-10
-5
0
5
10
15
0 10 20 30 40 50 60 70 80 90 100 110
Difference between ODI
True
and
ODI
Est
Average of ODI
True
and ODI
Est
Figure 15: Bland–Altman plot comparing the reference
value ODI
True
and the estimated value ODI
Est
.
estimation are discussed with the sleep medicine ex-
perts from the University Hospital Essen. They have
stated that the high prediction accuracy for the ODI
stage is satisfactory and sufficient for diagnosis appli-
cations in sleep laboratories.
The core of the presented approach is the man-
ual feature extraction based on both medical expert
knowledge, as well as, statistical, signal waveform,
and spectral analysis. The first novel approach is the
introduction of periods 30 seconds before and after
Figure 16: Comparison of the predicted and true ODI
stages.
an event into the feature analysis. The decision to in-
clude these phases is based on the findings presented
in Section 3.5. By analyzing the optimal feature sub-
set from Table 3, it can be observed that both the peri-
ods before and after an event have a significant contri-
bution to the classification. Therefore, it can be con-
cluded that changes in physiological processes before,
during, and after an event are detectable by the pre-
BIOSIGNALS 2024 - 17th International Conference on Bio-inspired Systems and Signal Processing
608

sented method and that they exhibit a significant con-
tribution in detecting desaturation events. The second
novel approach is the introduction of features based
on the analysis of the respiratory and heart rate be-
havior. These features are developed as a result of
discussions with sleep medicine experts on the corre-
lations between heart rate, respiration rate, and SpO
2
.
These features have also proven to be vital in the clas-
sification process.
Persistent hypoxemic SpO
2
values during sleep
are associated with numerous severe health risks, such
as organ damage, heart failure, tachycardia, persis-
tent headaches, and shortness of breath (Berry, 2012).
Additionally, several studies report the association
with cognitive deficits, deficits in memory, visuospa-
tial, and decision-making abilities (Bucks et al., 2013)
(Delazer et al., 2016). These health risks emphasize
the importance of SpO
2
monitoring and the timely di-
agnosis and treatment of sleep-related breathing dis-
orders (SRBD). However, the vast majority of SRBDs
remain undiagnosed mostly due to socioeconomic
reasons associated with high cost and long waiting
times for sleep lab examinations and patient unaware-
ness of the condition (Faria et al., 2021). The intro-
duction of alternatives to a PSG has the potential to
reduce the prevalence of undiagnosed SRBDs and de-
crease the public health burden they pose by lower-
ing costs and increasing the availability of SRBD di-
agnostic tools. The importance and benefits of con-
tactless solutions for patient diagnostics have already
been proven (Ali
´
c et al., 2023), but the number of so-
lutions and research in this field is still scarce. This
presents a challenge and an opportunity for further
work in this, for both SRBDs and other types of ill-
nesses as well.
6 CONCLUSION
The presented work introduces a novel approach for
contactless camera-based detection of oxygen desat-
uration events and ODI score estimation in SAS pa-
tients. The core of the novel approach is the feature
extraction method based on the analysis of medically
significant events in the rPPG and breath temperature
signals. The feature analysis includes not only the
periods during the event but also 30-second-long pe-
riods before and after an event, in order to capture
expected respiratory and heart rate activity associated
with oxygen desaturation events. The method is eval-
uated on a balanced dataset of 1595 events captured
in a patient study involving 23 symptomatic SAS pa-
tients. The classification accuracy between desatura-
tion events and periods without a desaturation based
on the LOPOCV metric is 95.4 %. The ODI stage
estimation resulted in a correct estimation in 22 out
of 23 patients for a two-stage ODI classification and
in a correct estimation in 21 out of 23 patients for a
four-stage ODI classification.
In future work, the presented method is to be eval-
uated with a larger patient dataset, taking into account
the influence of various demographic parameters on
the classification accuracy. Furthermore, the method
shall be expanded in order to distinguish between de-
saturation depths instead of observing all levels of de-
saturation as a single class.
ACKNOWLEDGEMENTS
This work is funded through a research grant (No.:
458611451) from the German Research Foundation
(DFG). We would like to thank our project part-
ners from the Department of Mechanical Engineering,
Technical University of Ilmenau, and the Center for
Sleep Medicine, University Hospital Essen for their
cooperation in this research project.
REFERENCES
Addison, P. S., Jacquel, D., Foo, D. M. H., Antunes, A., and
Borg, U. R. (2017). Video-based physiologic moni-
toring during an acute hypoxic challenge: Heart rate,
respiratory rate, and oxygen saturation. Anesthesia &
Analgesia, 125(3):860–873.
Ali
´
c, B., Zauber, T., Wiede, C., and Seidl, K. (2023). Cur-
rent methods for contactless optical patient diagnosis:
a systematic review. BioMedical Engineering OnLine,
22(1):61.
Ali
´
c, B., Zauber, T., Wiede, C., Viga, R., and Seidl, K.
(2023a). Contactless camera-based ahi score estima-
tion in sas patients. Current Directions in Biomedical
Engineering.
Ali
´
c, B., Zauber, T., Zhang, C., Liao, W., Wildenauer, A.,
Leosz, N., Eggert, T., Dietz-Terjung, S., Sutharsan,
S., Weinreich, G., Sch
¨
obel, C., Notni, G., Wiede, C.,
and Seidl, K. (2023b). Contactless optical detection of
nocturnal respiratory events. Proceedings of the 18th
International Joint Conference on Computer Vision,
Imaging and Computer Graphics Theory and Appli-
cations (VISIGRAPP 2023), pages 336–344.
Berry, R., Quan, S., Abreu, A., and et al. (2020). The
AASM Manual for the Scoring of Sleep and Associ-
ated Events: Rules, Terminology and Technical Spec-
ifications, Version 2.6. American Academy of Sleep
Medicine.
Berry, R. B. (2012). Chapter 22 - sleep and obstructive
lung disease. In Berry, R. B., editor, Fundamentals of
Sleep Medicine, pages 409–428. W.B. Saunders, Saint
Louis.
Contactless Camera-Based Detection of Oxygen Desaturation Events and ODI Estimation During Sleep in SAS Patients
609

Borer, J. (2011). Obstructive Sleep Apnea in Adults. Karger
Medical and Scientific Publishers, Basel.
Bucks, R. S., Olaithe, M., and Eastwood, P. (2013). Neu-
rocognitive function in obstructive sleep apnoea: A
meta-review. Respirology, 18(1):61–70.
Delazer, M., Zamarian, L., Frauscher, B., Mitterling, T.,
Stefani, A., Heidbreder, A., and H
¨
ogl, B. (2016). Oxy-
gen desaturation during night sleep affects decision-
making in patients with obstructive sleep apnea. Jour-
nal of Sleep Research, 25(4):395–403.
Faria, A., Allen, A. H., Fox, N., Ayas, N., and Laher, I.
(2021). The public health burden of obstructive sleep
apnea. Sleep Sci, 14(3):257–265.
Guazzi, A. R., Villarroel, M., Jorge, J., Daly, J., Frise,
M. C., Robbins, P. A., and Tarassenko, L. (2015).
Non-contact measurement of oxygen saturation with
an RGB camera. Biomedical Optics Express,
6(9):3320.
Humphreys, K., Ward, T., and Markham, C. (2005). A
CMOS camera-based pulse oximetry imaging system.
In 2005 IEEE Engineering in Medicine and Biology
27th Annual Conference. IEEE.
Karhu, T., Lepp
¨
anen, T., T
¨
oyr
¨
as, J., Oksenberg, A., Myl-
lymaa, S., and Nikkonen, S. (2022). Abosa – freely
available automatic blood oxygen saturation signal
analysis software: Structure and validation. Computer
Methods and Programs in Biomedicine, 226:107120.
Liao, W., Zhang, C., Sun, X., and Notni, G. (2023). Oxygen
saturation estimation from near-infrared multispectral
video data using 3d convolutional residual networks.
Proceedings of SPIE, 12621.
Lingqin, K., Zhao, Y., Dong, L., Jian, Y., Jin, X., Li, B.,
Feng, Y., Liu, M., Liu, X., and Wu, H. (2013). Non-
contact detection of oxygen saturation based on visi-
ble light imaging device using ambient light. Optics
express, 21:17464–71.
Mannheimer, P., Cascini, J., Fein, M., and Nierlich, S.
(1997). Wavelength selection for low-saturation pulse
oximetry. IEEE Transactions on Biomedical Engi-
neering, 44(3):148–158.
Prahl, S. (1998). Tabulated molar extinction coefficient for
hemoglobin in water. Oregon Medical Laser Center.
Rashid, N. H., Zaghi, S., Scapuccin, M., Camacho, M.,
Certal, V., and Capasso, R. (2021). The value of
oxygen desaturation index for diagnosing obstructive
sleep apnea: A systematic review. The Laryngoscope,
131(2):440–447.
Rosa, A. d. F. G. and Betini, R. C. (2020). Noncontact
spo2 measurement using eulerian video magnifica-
tion. IEEE Transactions on Instrumentation and Mea-
surement, 69(5):2120–2130.
Rossi, V. A., Stradling, J. R., and Kohler, M. (2012). Ef-
fects of obstructive sleep apnoea on heart rhythm. Eu-
ropean Respiratory Journal, 41(6):1439–1451.
Rundo, J. (2019). Obstructive sleep apnea basics. Cleveland
Clinic Journal of Medicine, 86:2–9.
Shao, D., Liu, C., Tsow, F., Yang, Y., Du, Z., Iriya, R.,
Yu, H., and Tao, N. (2016). Noncontact monitoring
of blood oxygen saturation using camera and dual-
wavelength imaging system. IEEE Transactions on
Biomedical Engineering, 63(6):1091–1098.
Smith, M. L., Niedermaier, O. N., Hardy, S. M., Decker,
M. J., and Strohl, K. P. (1996). Role of hypoxemia in
sleep apnea-induced sympathoexcitation. Journal of
the Autonomic Nervous System, 56(3):184–190.
Smolley, L. (2023). Adult polysomnography. Academic
Press, Oxford, second edition edition.
Temirbekov, D., Gunes, S., Yazici Almaz, Z., and Sayin,
I. (2018). The ignored parameter in the diagnosis of
obstructive sleep apnea syndrome the oxygen desatu-
ration index. Turkish archives of otorhinolaryngology,
56.
Toften, S., Kjellstadli, J. T., Tyvold, S. S., and Moxness,
M. H. S. (2021). A pilot study of detecting individual
sleep apnea events using noncontact radar technology,
pulse oximetry, and machine learning. Journal of Sen-
sors, 2021:1–9.
Tran, V. P. and Al-Jumaily, A. A. (2019). A novel oxygen-
hemoglobin model for non-contact sleep monitor-
ing of oxygen saturation. IEEE Sensors Journal,
19(24):12325–12332.
Tsai, H.-Y., Huang, K.-C., Chang, H.-C., Yeh, J.-L. A.,
and Chang, C.-H. (2014). A noncontact skin oxygen-
saturation imaging system for measuring human tissue
oxygen saturation. IEEE Transactions on Instrumen-
tation and Measurement, 63(11):2620–2631.
Varghese, L., Rebekah, G., N, P., Oliver, A., and Kurien, R.
(2022). Oxygen desaturation index as alternative pa-
rameter in screening patients with severe obstructive
sleep apnea. Sleep Science, 15:224–228.
Vogels, T., van Gastel, M., Wang, W., and de Haan, G.
(2018). Fully-automatic camera-based pulse-oximetry
during sleep. In Proceedings of the IEEE Conference
on Computer Vision and Pattern Recognition (CVPR)
Workshops.
Wieler, M. E., Murphy, T. G., Blecherman, M., Mehta, H.,
and Bender, G. J. (2021). Infant heart-rate measure-
ment and oxygen desaturation detection with a digital
video camera using imaging photoplethysmography.
Journal of Perinatology, 41(7):1725–1731.
Wieringa, F., Mastik, F., and van der Steen, A. (2005). Con-
tactless multiple wavelength photoplethysmographic
imaging: A first step toward “spo2 camera” technol-
ogy. Annals of biomedical engineering, 33:1034–41.
Wu, H.-Y., Rubinstein, M., Shih, E., Guttag, J., Durand, F.,
and Freeman, W. (2012). Eulerian video magnifica-
tion for revealing subtle changes in the world. ACM
Trans. Graph., 31(4).
Zhang, C., Gebhart, I., K
¨
uhmstedt, P., Rosenberger, M.,
and Notni, G. (2020). Enhanced contactless vital sign
estimation from real-time multimodal 3d image data.
Journal of Imaging, 6(11).
BIOSIGNALS 2024 - 17th International Conference on Bio-inspired Systems and Signal Processing
610
