
Spatial-Temporal Graph Neural Network for the Detection of Container
Escape Events
Yuchen Guo
a
and James Pope
b
Intelligent Systems Laboratory, School of Engineering Mathematics and Technology, University of Bristol, Bristol, U.K.
Keywords:
Graph Neural Network, Anomaly Detection, Computer Security.
Abstract:
Internet of Things (IoT) devices bring an attack surface closer to personal life and industrial production. With
containers as the primary method of IoT application deployment, detecting container escapes by analyzing
audit logs can identify compromised edge devices. Since audit log data contains temporal property of events
and relational information between system entities, existing analysis methods cannot comprehensively analyze
these two properties. In this paper, a new Temporal Graph Neural Network (GNN) -based model was designed
to detect anomalies of IoT applications in a container environment. The model employed Gated Recurrent
Unit (GRU) and Graph Isomorphism Network (GIN) operators to capture temporal and spatial features. Using
unsupervised learning to model the application’s normal behavior, the model can detect unknown anomalies
that have not appeared in training. The model is trained on a dynamic graph generated from audit logs, which
records security events in a system. Due to the lack of real-world datasets, we conducted experiments on a
simulated dataset. Audit log records are divided into multiple graphs according to their temporal attribute to
form a dynamic graph. Some nodes and edges are aggregated or removed to reduce the complexity of the
graph. In the Experiments, The model has an F1 score of 0.976 on the validation set, which outperforms the
best-performing baseline model, with an F1 score of 0.845.
1 INTRODUCTION
While the Internet of Things (IoT) is bringing con-
venience to people’s lives and efficiency to industrial
production, it is also exposing the real world to se-
curity threats from cyberspace. With the rapid growth
of communication technology, more smart devices are
used in personal and industrial areas.
Container is a standard method to deploy applica-
tions on edge devices in IoT networks. Isolation is the
system’s primary method to restrict containers’ access
to host resources. Container escape refers to an appli-
cation in a container that breaks out of its normal iso-
lation environment and is an essential step in an attack
chain. The process of container escape involves a se-
ries of abnormal operations, which system audit tools
can record. This paper focuses on detecting container
escape in edge devices by analyzing audit logs.
The aim of this paper is to detect container es-
capes from IoT applications through Temporal GNN-
based anomaly detection. In addition to automated
feature extraction by regular neural networks, the em-
ployment of RNN and GNN layers makes the model
a
https://orcid.org/0009-0003-9389-2051
b
https://orcid.org/0000-0003-2656-363X
independent of manual feature engineering on spa-
tial and temporal. Moreover, the model adopts un-
supervised learning for anomaly detection. A benefit
of unsupervised learning is the ability to detect un-
known threats, which is crucial for effectively defend-
ing against ever-changing cyber security threats.
This research uses dynamic graphs to represent
events in audit logs, using entities such as processes,
threads, and computing resources of the operating
system in audit logs as nodes, events between entities
as edges, and dividing them into multiple graphs at a
specific scale according to the temporal attributes in
the records. The graph structure extraction algorithm
identifies and distinguishes different entities from the
text records and connects them with events. The con-
tributions of this research are summarized as follows:
• Develop an algorithm that extracts node and edge
information from the audit log and builds a dy-
namic graph.
• Develop a Temporal GNN-based model to handle
dynamic graph anomaly detection tasks and train
the model on the simulated dataset.
326
Guo, Y. and Pope, J.
Spatial-Temporal Graph Neural Network for the Detection of Container Escape Events.
DOI: 10.5220/0012347800003636
Paper published under CC license (CC BY-NC-ND 4.0)
In Proceedings of the 16th International Conference on Agents and Artificial Intelligence (ICAART 2024) - Volume 3, pages 326-333
ISBN: 978-989-758-680-4; ISSN: 2184-433X
Proceedings Copyright © 2024 by SCITEPRESS – Science and Technology Publications, Lda.

2 RELATED WORK
2.1 GNN in Static Graph Anomaly
Detection
GNN-based models for anomaly detection tasks do
not require constant reliance on expertise and manual
feature extraction of constructed statistics and have
good generalization capabilities when dealing with
unseen graph data. Graph Auto-Encoder (GAE) com-
bined GNN and auto-encoder and has good perfor-
mance on link prediction tasks in citation networks
(Kipf and Welling, 2016). They also propose a vari-
ational version of GAE, which replace the specific
value in latent vectors with a probability distribution.
With a two-layer GCN encoder and an inner product
decoder, the model calculates loss value based on a
reconstructed adjacency matrix from latent vectors.
The target of anomaly detection for graph data
can categorize current models into three types: for
nodes, for edges, and for subgraphs. In the design of
GAE, the structure and number of encoders and de-
coders vary depending on the target and data type of
anomaly detection. Researchers have typically used
GNN-based encoders while implementing decoders is
more flexible. GAE can be extend to Attributed Net-
works to form an anomaly rank list of nodes (Ding
et al., 2019). Their model contains a three-layer GCN
network as the encoder to embed node attributes and
structure information to latent vectors. Structure and
attribute property of graph can also be processed by
two sperate auto-encoders to provide comprehensive
analyses (Fan et al., 2020).
2.2 GNN in Dynamic Graph Anomaly
Detection
GCN can be extended to the temporal GCN to cap-
ture the temporal features (Zheng et al., 2019). The
authors first apply GCN on the hidden state matrix
of the previous time slot and a contextual attention-
based model on a hidden state sequence to the short-
term and long-term pattern, then use GRU to combine
them.
Following the idea of Variational Graph Auto-
encoder, a multi-scale graph auto-encoder that can be
used on dynamic graph (Yang et al., 2023). They ex-
tract multi-scale spatial and temporal features and in-
fer the mean and variance of posterior and the prior
according to the feature in the corresponding scale. A
GCN and GRU-based supervised classification model
based on API sequences are used to detect malware
(Zhang et al., 2022). Their model captures time-
changing patterns by GRU cells, which feed by con-
catenation of node embedding from the current time
slot and hidden state from the previous one.
3 DATA PREPROCESS
3.1 Data Source
The data used in this paper is generated from the
simulation of IoT containers and attack events (Pope
et al., 2021). The simulation runs containers execut-
ing normal workloads and containers with misconfig-
urations or malicious code. The dataset contains sce-
narios of Denial of Service (DoS) and Privilege Es-
calation (Privesc) attack events on both the Umbrella
Edge device and the Linux Raspian virtual machine.
The operating system enabled Auditd as an audit tool
to record system events during each simulation.
3.2 Audit Log to Graph
Audtid monitors events during simulated experiments
based on customized rules. Each row of the audit log
file output by Auditd records a part of a particular
event. Each record has a specific event id and times-
tamp. Regular expressions can extract the record type,
event ID, and timestamp from key-value pairs in each
row. Then, grouping by event ID, multiple records
can be composed into a complete event.
Following the existing method of extracting node
and edge attributes (Pope et al., 2022), the audit log
file is transformed into graph as shown in the first and
second parts of Figure 1. We restrict the entity types
to the five most common types in the log: process,
executable, user, file, and socket transform them into
vectors as the attributes of the nodes. There are var-
ious audit event types in the log file, and to simplify
the graph structure, this paper focuses on system call
(syscall) events and use the syscall type as the edge
attribute.
3.3 Dynamic Graph
The sequential order of snapshots in the dynamic
graph expresses the temporal property of an audit
event. The nodes and edges described above are split
into snapshots at equal intervals according to times-
tamps.
3.3.1 Graph with Dynamic Node
The implementation of dynamic graphs varies from
the demand of the problem. The difference is mainly
Spatial-Temporal Graph Neural Network for the Detection of Container Escape Events
327

Figure 1: Steps in Data Processing from Audit Log to Dynamic Graph.
about which parts of the dynamic graph will change
over time. For example, the three dynamic graph
types presented in (Rozemberczki et al., 2021) have
static nodes but differ in the temporal consistency of
the node attributes, the edge attributes, and the edges
themselves, respectively. Unlike the above graphs,
the dynamic graph used to represent the audit log in
this problem has nodes that change over time.
System entities are dynamic during system run-
ning, such as creating a file or killing a process. In
the audit log, records over a period of time relate to
only a subset of system entities, which are described
as active in this paper, while the remaining entities
not referred to in the records are inactive. Corre-
spondingly, nodes representing these entities are also
labeled as active or inactive in the snapshot according
to the event split.
Embedding and reconstructing attributes of both
active and inactive nodes in each snapshot incurs un-
necessary consumption. In contrast, graphs with dy-
namic nodes would not distract the model from rec-
ognizing inactive nodes and focuses on active nodes.
Therefore, in this paper, we adopt a dynamic node
structure in constructing a dynamic graph and design
the functions and data structures to feed data into the
model, which will be described in section 5.3.1.
3.3.2 Entity Index and Edge Index
The nodes of each snapshot in the dynamic graph map
into the system entities by one-to-one function. Sup-
pose all entities in the audit log are put into an array
for each snapshot. In that case, the injection func-
tion between active nodes and system entities can be
represented by an array of entity indexes, i.e., each
node in a snapshot corresponds to the index of the
entity it represents. This design facilitates the pass-
ing of node-level hidden states between neighboring
snapshots when analyzing the temporal features of
dynamic graphs using the recurrent neural network
structure. The design for time series analysis is de-
scribed in section 4.1.1. Note that the edge index
in each snapshot is composed of the indexes of local
nodes rather than the indexes of global entities.
4 MODEL DESIGN
Auto-encoder is used to carry out the anomaly detec-
tion task on dynamic graphs. Auto-encoder is an un-
supervised learning model consisting of an encoder
and a decoder, where the encoder compresses the
samples into code tensors with much smaller sizes.
Then, the decoder takes the code tensors to recon-
struct the input information.
4.1 Encoder Model
The auto-encoder’s encoder part extracts input data
features and compresses them into a code tensor. This
subsection describes the design of the encoder from
the temporal and spatial aspects, respectively.
4.1.1 Time Series Analysis
Audit events have temporal properties and can form a
time series. Some system entities may remain active
as they are present in multiple events for more than
one interval. There might be connections among the
information of these nodes in different snapshots, so
the model needs to explore the potential temporal fea-
tures therein. In this study, as previously described,
audit events are segmented by timestamp and repre-
sented in a sequence of snapshots in a dynamic graph.
Some nodes representing the same system entity are
active in consecutive snapshots. The model uses a Re-
current Neural Networks (RNN) structure to pass in-
formation between neighboring snapshots to extract
temporal features.
4.1.2 Spatial Structure Analysis
Audit events are represented as edges in a dynamic
graph and connect the nodes representing the entities
involved to each other to form a complex spatial struc-
ture. Regular neural networks can only process these
ICAART 2024 - 16th International Conference on Agents and Artificial Intelligence
328

Figure 2: Structure of Spatio-Temporal Auto-Encoder.
connected samples independently to extract features
from the node attributes and ignore spatial structure
in their relationships. On the other hand, Graph Neu-
ral Networks (GNN) can build node embedding with
spatial features at the node level by passing messages
between nodes. Graph Convolution Network (GCN),
Graph Isomorphism Network (GIN), and Graph At-
tention Network (GAT) are common graph convolu-
tion operators. GAT and GIN are more complex than
GCN but require more computing resources. Exper-
iments are conducted to compare the performance of
models using these three graph convolution operators
for anomaly detection.
4.1.3 Combining Temporal and Spatial
Time series analysis of dynamic graphs requires a
combination of GNN and RNN. Our approach is to
replace the linear layer in a regular RNN cell with a
graph convolution operator to build the function and
pass the hidden state on the node level, called GNN-
based RNN. The advantage of the this approach is
that it fully considers the spatial information in the
graph data in the computation of each vector and al-
lows each part of the RNN to extract spatial informa-
tion on demand.
4.2 Decoder Model
This paper proposes a novel decoder design named
Reverse-edge Decoder that focuses on the message-
passing process in the graph. The decoder takes the
spatial structure and temporal context in the dynamic
graph as part of its input and reconstructs the node
attributes from the code tensor of each node via the
GNN-based RNN layer. The direction of edges fed
to the decoder is reversed, which will invert message
passing performed by graph convolutional operators
in the decoder so that the effects from neighboring
nodes in the code tensor can be passed back along the
reversed edges.
5 IMPLEMENTATION
5.1 Data Description
The dataset used for the experiment consists of 184
audit log files, of which 92 contain DoS attack events,
and 89 contain Privesc attack events. After transform-
ing them into dynamic graphs, there are 3383 snap-
shots with an average of 51.4 nodes and 135.7 edges.
We split 50% of the dataset as training dataset, 50%
as validation.
5.2 Spatio-Temporal Auto-Encoder
The model proposed in this paper, Spatio-Temporal
Auto-Encoder (STAE), comprehensively analyzes
temporal and spatial features in dynamic graph data
and unsupervised learning for anomaly detection
tasks.
The encoder and decoder of the model consist of
two sets of symmetric neural networks, as shown in
Figure 2. The encoder starts with an embedding net-
work for simple feature extraction, then a GNN-based
RNN layer, and followed with a deciding network for
information compression. The embedding and de-
cision networks are sequential models with multiple
fully connected layers and activation functions.
5.2.1 GNN-based RNN Layer
The GNN-based RNN layer in the encoder and de-
coder implements spatio-temporal analysis in this
model. Figure 3 shows how the GNN-based RNN
layer propagates forward and passes hidden states be-
tween snapshots. This layer is based on the Gated
Recurrent Unit (GRU) structure, whose output is node
embeddings containing spatio-temporal features. The
node embeddings also act as a node-level hidden state
that propagates from the previous snapshot to the
next. The layer uses six GNN units instead of the
Spatial-Temporal Graph Neural Network for the Detection of Container Escape Events
329

Figure 3: Schematic Diagram of Forward Propagation in GNN-based RNN Layer.
linear layer in a regular GRU. Each GNN unit in a
GNN-based RNN layer comprises a stack of multiple
GCN operators, which enables a node to receive infor-
mation from its neighboring nodes within a multi-hop
range.
5.2.2 Hidden State of Dynamic Nodes
Since the dynamic graph in this problem has dynamic
nodes, the hidden state cannot be propagated directly
from one snapshot to the next. As shown in Figure 3,
a snapshot has an array of indexes of the entities rep-
resented by its nodes. By matching the entity indexes
of the previous and next snapshots, the hidden state
of the nodes that appeared in both snapshots is copied
to form a matrix, while the nodes that did not appear
in the previous snapshots are placed by zero vectors
instead.
5.3 Training
5.3.1 Batch Training of Dynamic Graph
Feeding the dynamic graphs in the dataset into the
model one by one during the training process will
waste considerable computational time reading the
data and executing a loop with repetitive code, re-
sulting in low GPU utilization. To construct dynamic
graph batches, equal-length snapshot sequences can
be randomly selected from the dynamic graph dataset.
By aligning these sequences at an index, snapshots
of the same index can be used as subgraphs to form
a larger graph. Since these subgraphs are not con-
nected, message passing in graph convolution will not
occur across the subgraphs. In this way, the model
can process multiple dynamic graphs simultaneously
while keeping the sequence of snapshots.
5.3.2 Reconstruction and Loss
In STAE model, the array of node attributes in the
concatenated graph batch is compressed by the en-
coder part of the model into a code tensor, where each
row corresponds to a node in the input batch. The de-
coder then uses the code tensor to reconstruct the node
attributes and output reconstructed attributes in an ar-
ray with the same order. The reconstructed array is the
same size as the node attribute array in the batch, and
each row corresponds to the same node. The model
applies Root Mean Squared Error (RMSE) function
to calculate the difference between these two arrays
as reconstruction loss and update learnable parame-
ters according to this loss value in backward propaga-
tion.
5.4 Prediction
The model performs anomaly detection at the graph
level. Based on the timestamp of the attack event in
the annotation file recorded by the simulation script,
the snapshot involving the attack event will be marked
as an anomaly. A readout function will aggregate
node-level loss into graph-level loss and determine
whether the snapshot is anomalous based on the con-
figured anomaly threshold.
5.4.1 Evaluation Metrics
The evaluation of anomaly detection models differs
from that of regular classification models. Preci-
sion, recall, F1 score and Area under the ROC Curve
(AUC) metric are applied to evaluate the performance
of the model.
ICAART 2024 - 16th International Conference on Agents and Artificial Intelligence
330
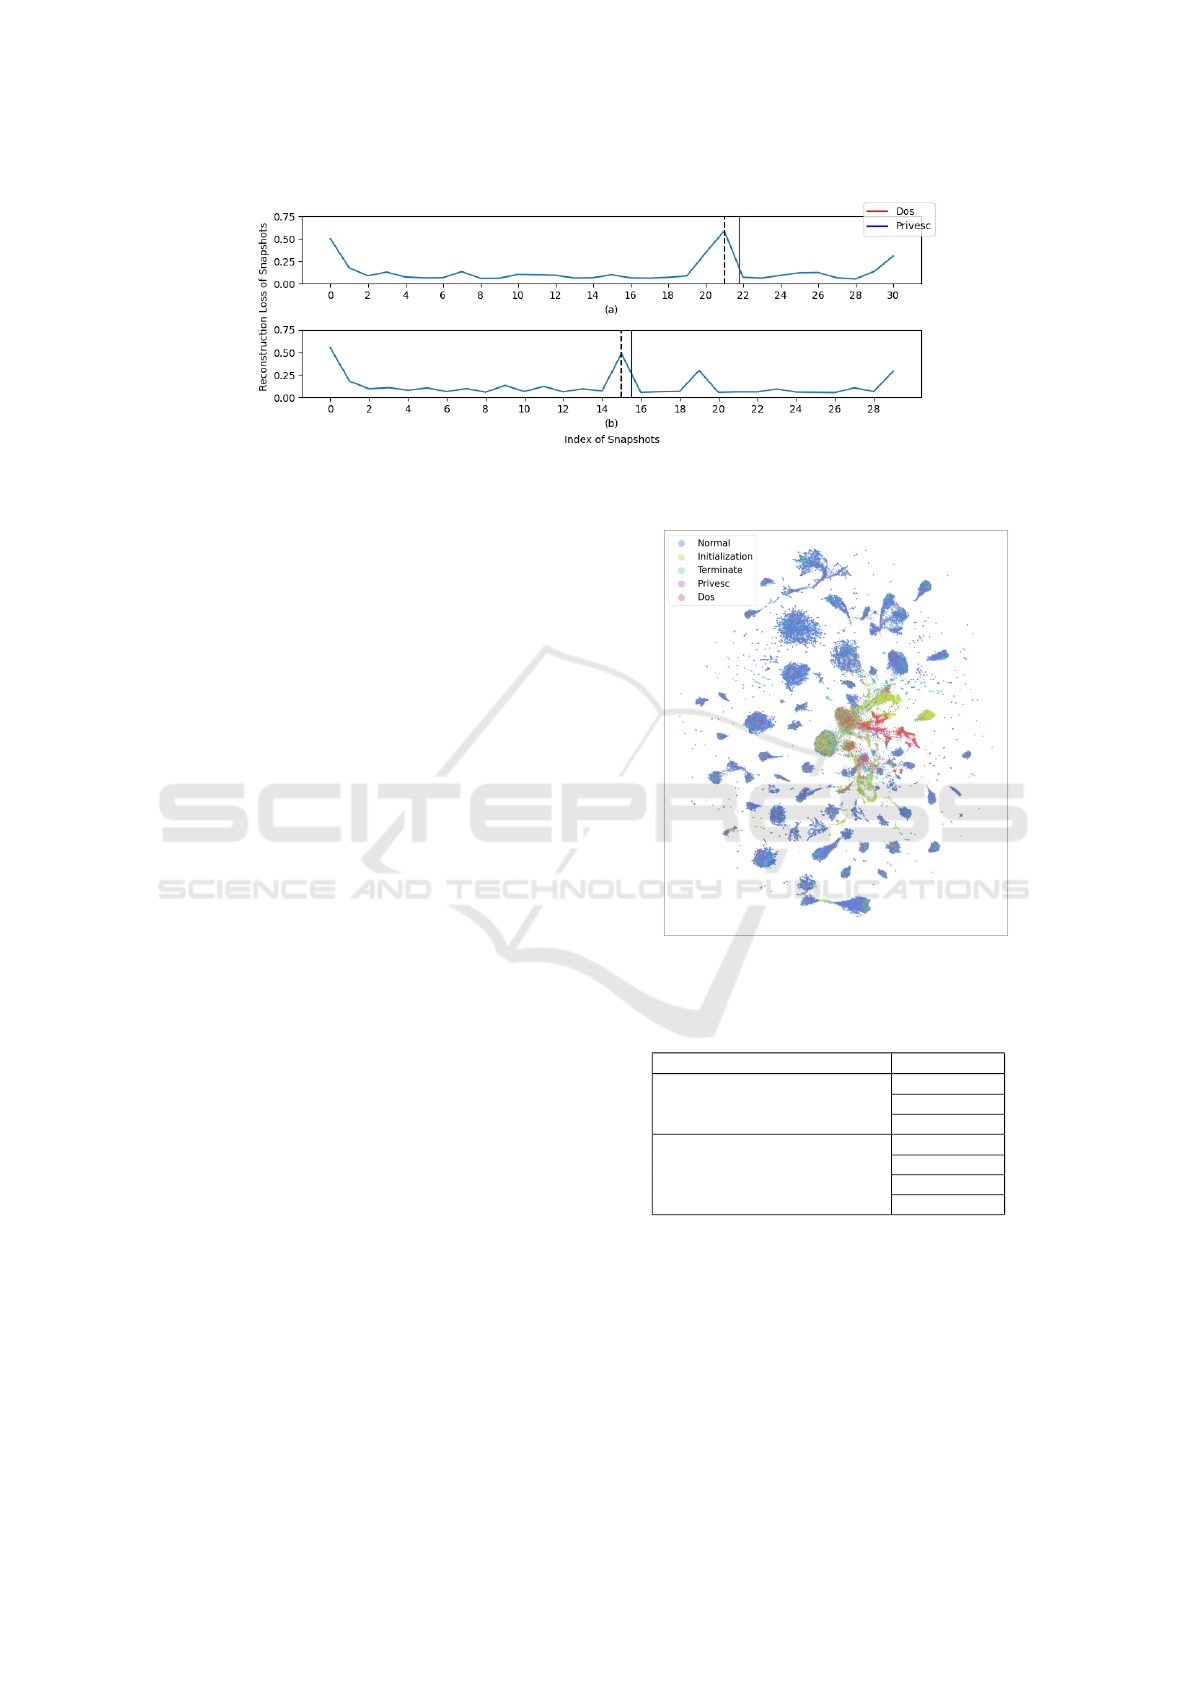
Figure 4: Line Graph of Snapshots Reconstruction Loss.
6 EVALUATION
6.1 Abnormal Data Analysis
In preliminary trials, the model was trained using
the entire dynamic graph, and the obtained results
were not as good as expected. After 1000 epochs
of training, the F1 score of the model on the valida-
tion set was still below 0.8. Further analysis of the
prediction shows that the initialization and termina-
tion phases of the simulation have significantly high
anomaly scores.
As shown in Figure 4 below, the line graph illus-
trates the change of reconstruction loss for each snap-
shot in the dynamic graph. The dynamic graph rep-
resented by Figure 4(a) contains the denial-of-service
attack event, and the dynamic graph represented by
Figure 4(b) contains the privilege escalation attack
event. The time of the attack event triggered is in-
dicated by the red and blue lines in the plots, and the
black dashed lines mark the snapshots involved in the
attack event.
We reduced the code tensor to 2-dimension using
UMAP and plotted them in Figure 5 to test whether
the model can separate initialization, termination, and
attack events. Each scatter in the plot represents a
node in the dynamic graph and is colored by the la-
bel. Scatters representing DoS attack and simulation
initialization form relatively well-separated clusters.
While most of the clusters are dominated by normal
scatters, there are quite a few scatters with other la-
bels mixed in. Likely, this is because the scatters are
labeled only at the snapshot level, while some snap-
shots contain both normal and abnormal events and
are labeled as abnormal.
As it is unable to label the initialization and termi-
nation parts accurately from the dynamic graph, in the
following experiments, the leading and trailing parts
of the dynamic graph will be removed to minimize
the effect of the initialization and termination on the
Figure 5: Scatter Plot of Code Tensor by UMAP.
prediction results of the model.
Table 1: Structure of Embedding and Deciding Network.
Dense Network Hidden size
Embedding Network (3 layer)
128
512
256
Deciding Network (4 layer)
256
128
128
64
6.2 Hyperparameter Selection
6.2.1 Dense Network Structure
The model contains two dense networks in each of
the encoder and decoder. In experiments, it is found
that the model is not sensitive to the structure in these
dense networks, such as the number of layers and the
Spatial-Temporal Graph Neural Network for the Detection of Container Escape Events
331
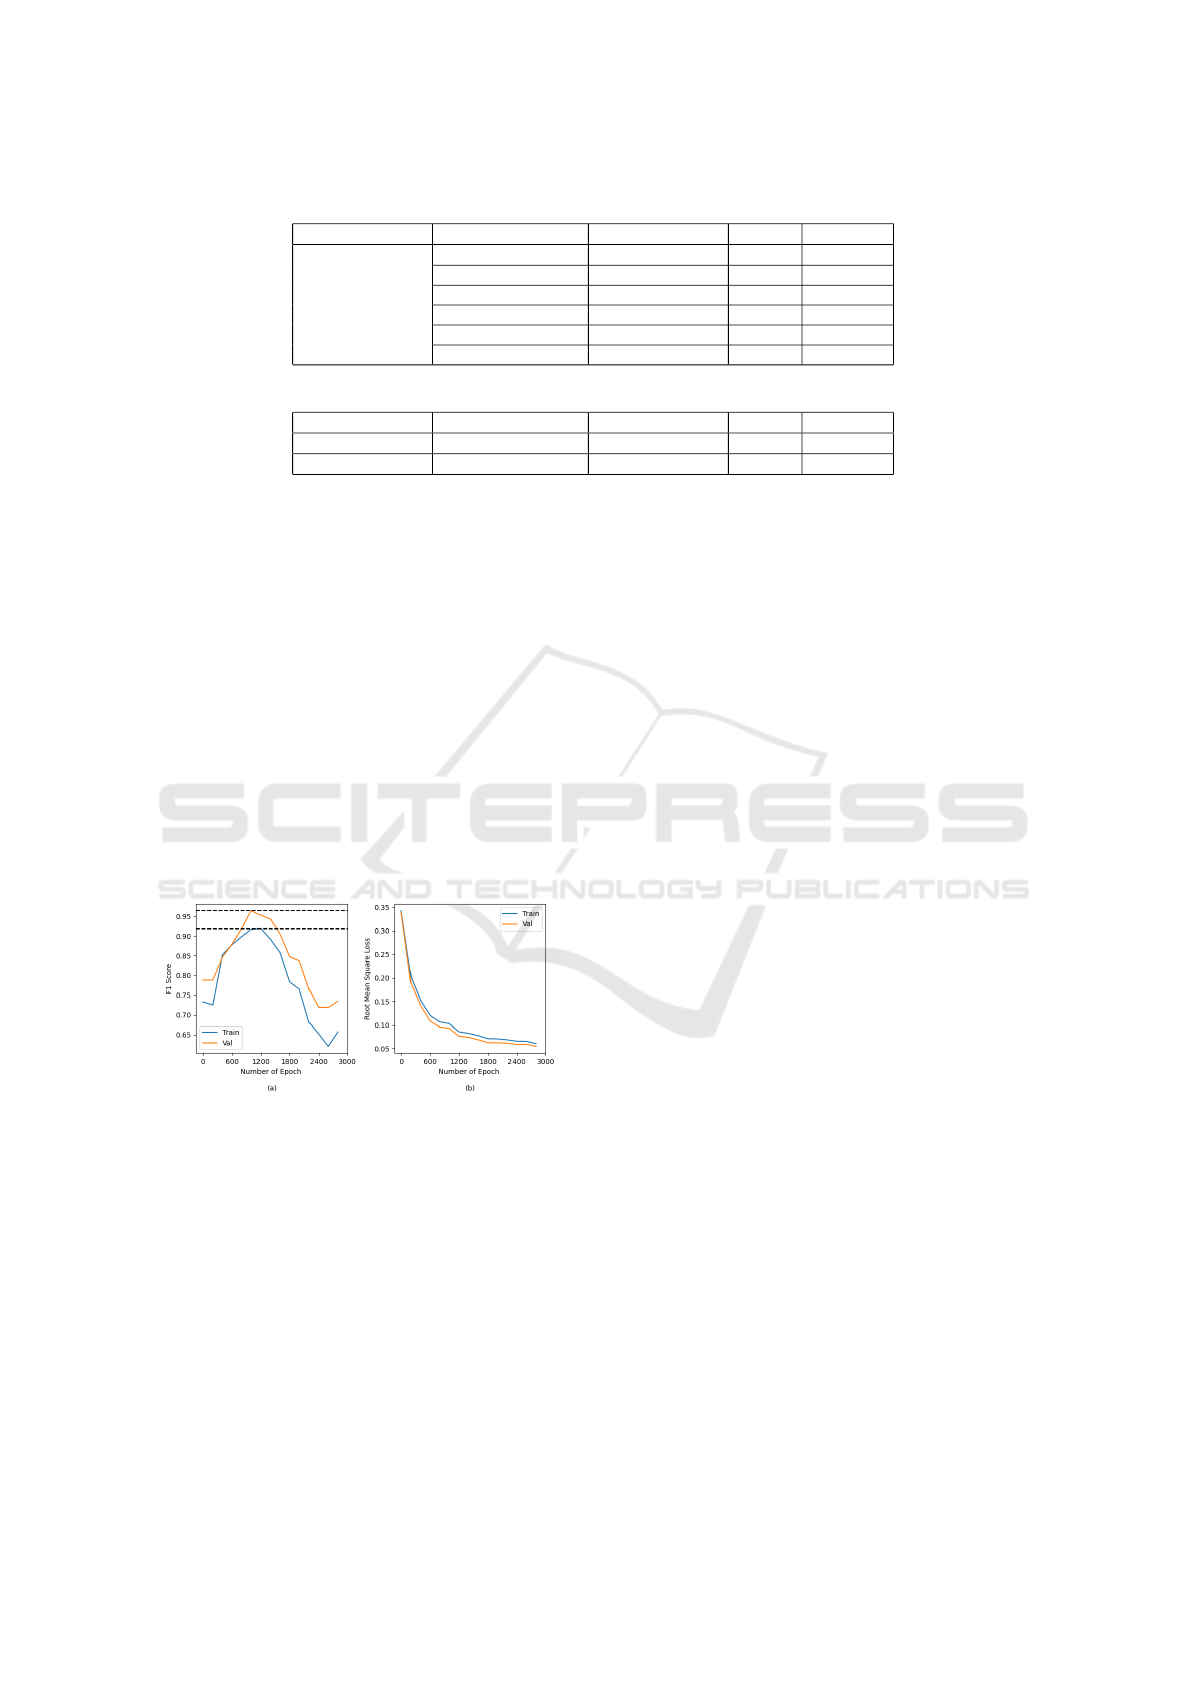
Table 2: Results of Code Tensor Size and GNN Channels Tuning in GCN.
GCN Operator Code Tensor Size GNN Channels Val F1 Val AUC
GCN
16 64 0.837 0.996
16 128 0.816 0.996
16 256 0.943 0.999
32 64 0.837 0.997
32 128 0.831 0.996
32 256 0.867 0.997
Table 3: Optimal Results of Code Tensor Size and GNN Channels Tuning in GIN and GAT.
GCN Operator Code Tensor Size GNN Channels Val F1 Val AUC
GIN 32 256 0.941 0.998
GAT 16 256 0.897 0.996
hidden size of each layer. Therefore, models in the
subsequent experiments use the same dense network
structure as shown in Table 1.
6.2.2 Code Tensor Size and GNN channels
The size of the code tensor and the input channels
(GNN channels) of the GNN-based RNN layer are
vital hyperparameters to be tuned in the model struc-
ture. The code tensor is the bottleneck that connects
the encoder and decoder parts of the model while the
GNN-based RNN layer contains most of the learnable
parameters. Detailed tuning results are shown in Ta-
ble 2. These two parameters in the model using GIN
and GAT as operators in the GNN-based RNN layer
were tuned using the same method. The results are
shown in Table 3.
Figure 6: F1 Score and RMSE Loss on 3000 Epochs.
6.3 Over-Reconstruction
When raising the number of epochs for training to
around 3000, there is a continuous decrease in the
model’s loss values on both the test and training sets.
Along with a decrease in the model’s performance on
anomaly detection, as shown in Figure 6. Unlike over-
fitting in regular neural networks, the performance on
the training set of our model also decreases as the
epoch number increases. This is because the loss val-
ues for updating the parameters come from the recon-
struction of nodes by the model rather than being di-
rectly related to anomaly node detection.
We suspect that the model loses its ability to de-
tect anomalies with further training because it cap-
tures how to reconstruct some anomaly nodes’ at-
tributes—resulting in a decrease in the loss value of
some anomaly snapshots that cannot be distinguished
from the normal ones. Therefore, the experiments
adopt the early stop method to terminate the training
to avoid over-reconstruction on anomaly samples by
the model.
6.4 Overview of Experiment Results
In this section, the Spatio-Temporal Auto-Encoder
(STAE) models using GCN, GIN, and GAT operators
perform predictions for each of the two attack types in
the dataset respectively based on the optimizations in
the model structure and hyperparameters in the pre-
vious section and are compared with the prediction
results of Baseline Auto-Encoder (Baseline AE) as
shown in Table 4.
Table 4 shows that the STAE model using the GIN
operator performs best among all the options, and
its F1 score is 0.976 on the validation set. More-
over, comparing the prediction results of the model
on different attack types, the model performs better
in detecting denial of service attacks than privilege
elevation. In comparison with the baseline model,
even the model using the GAT operator, which has
relatively poor performance, achieves an F1 score of
0.911 on the validation set, which is much higher than
the dense baseline auto-encoder, which is the best per-
former in baseline models, with an F1 score of 0.845.
Furthermore, comparing the three baseline mod-
els, we observe that the RNN Baseline AE, which
uses temporal property between nodes only, outper-
forms the GNN Baseline AE, which focuses on spatial
structure. One possible explanation is that the tem-
poral property of the dynamic graph in this problem
is more valuable than its spatial property in detecting
anomaly snapshots.
ICAART 2024 - 16th International Conference on Agents and Artificial Intelligence
332

Table 4: Results of STAE Model and Baselines.
Model AttackType
Val
Precision Recall F1 AUC
GCN STAE
ALL 0.930 0.976 0.952 0.999
Privesc 0.905 1 0.950 0.998
DoS 0.957 1 0.978 0.999
GIN STAE
ALL 0.953 1 0.976 0.999
Privesc 0.950 1 0.974 0.998
DoS 0.957 1 0.978 0.999
GAT STAE
ALL 0.837 1 0.911 0.998
Privesc 0.792 1 0.884 0.996
DoS 0.880 1 0.936 0.997
Dense Baseline AE ALL 0.732 1 0.845 0.996
RNN Baseline AE ALL 0.456 1 0.626 0.971
GNN Baseline AE ALL 0.182 1 0.308 0.884
7 CONCLUSIONS
Our work addressed the problem by converting con-
tainer escape audit logs into a graph suitable for
anomaly detection. In addition to the spatial aspects,
we focus on retaining temporal information in the
logs. Our proposed STAE model uses dynamic graph
structures combined with the graph auto-encoder ar-
chitecture. Moreover, STAE model uses a novel de-
coder that passes the message through the reverse
edge direction to reconstruct the node attributes. Ex-
perimental results show that the STAE model results
in a 12% improvement in accuracy over the baseline
model and the model using the GIN operator in the
GNN-based RNN layer has the best performance.
Future work will be to evaluate the approach on
other, larger datasets. Obtaining real-world data or
implementing the extensions to simulate container es-
capes is necessary to improve further and validate the
models and methods proposed in this paper. Besides,
hyper-graphs might be an ideal data structure to rep-
resent relationships among multiple objects when rep-
resenting events in audit logs.
ACKNOWLEDGEMENTS
This work was supported, in part, by the Engineering
and Physical Sciences Research Council [grant num-
ber EP/X036871/1] and Horizon Europe [grant num-
ber HORIZON-MISS-2022-CIT-01-01].
REFERENCES
Ding, K., Li, J., Bhanushali, R., and Liu, H. (2019). Deep
anomaly detection on attributed networks. In Proceed-
ings of the 2019 SIAM International Conference on
Data Mining, pages 594–602. SIAM.
Fan, H., Zhang, F., and Li, Z. (2020). Anomalydae: Dual
autoencoder for anomaly detection on attributed net-
works. In ICASSP 2020-2020 IEEE International
Conference on Acoustics, Speech and Signal Process-
ing (ICASSP), pages 5685–5689. IEEE.
Kipf, T. N. and Welling, M. (2016). Variational graph auto-
encoders. arXiv preprint arXiv:1611.07308.
Pope, J., Liang, J., Kumar, V., Raimondo, F., Sun, X., Mc-
Conville, R., Pasquier, T., Piechocki, R., Oikonomou,
G., Luo, B., et al. (2022). Resource-interaction graph:
Efficient graph representation for anomaly detection.
arXiv preprint arXiv:2212.08525.
Pope, J., Raimondo, F., Kumar, V., McConville, R.,
Piechocki, R., Oikonomou, G., Pasquier, T., Luo, B.,
Howarth, D., Mavromatis, I., et al. (2021). Container
escape detection for edge devices. In Proceedings of
the 19th ACM Conference on Embedded Networked
Sensor Systems, pages 532–536.
Rozemberczki, B., Scherer, P., He, Y., Panagopoulos, G.,
Riedel, A., Astefanoaei, M., Kiss, O., Beres, F., ,
Lopez, G., Collignon, N., and Sarkar, R. (2021). Py-
Torch Geometric Temporal: Spatiotemporal Signal
Processing with Neural Machine Learning Models.
In Proceedings of the 30th ACM International Con-
ference on Information and Knowledge Management,
page 4564–4573.
Yang, C., Wen, H., Hooi, B., Wu, Y., and Zhou, L. (2023).
A multi-scale reconstruction method for the anomaly
detection in stochastic dynamic networks. Neurocom-
puting, 518:482–495.
Zhang, Z., Li, Y., Wang, W., Song, H., and Dong, H. (2022).
Malware detection with dynamic evolving graph con-
volutional networks. International Journal of Intelli-
gent Systems, 37(10):7261–7280.
Zheng, L., Li, Z., Li, J., Li, Z., and Gao, J. (2019). Ad-
dgraph: Anomaly detection in dynamic graph using
attention-based temporal gcn. In IJCAI, volume 3,
page 7.
Spatial-Temporal Graph Neural Network for the Detection of Container Escape Events
333
