
Feature Selection Improves Speech Based Parkinson’s Disease Detection
Performance
Ays¸e Nur Tekindor
1 a
and Eda Akman Aydın
2 b
1
Electrical and Electronics Engineering, Graduate School of Natural and Applied Sciences,
Gazi University, Ankara, Turkey
2
Department of Electrical and Electronics Engineering, Faculty of Technology, Gazi University, Ankara, Turkey
Keywords:
Parkinson’s Disease, Speech Analysis, mRMR, Bark Spectrum, Mel Frequency Cepstral Coefficients,
Gammatone Cepstral Coefficients, Spectral Features.
Abstract:
Parkinson’s disease (PD) is a neurodegenerative disorder that is caused by decrease in dopamine levels in
the brain. There is currently no cure for PD; however, the progression of the disease can be brought under
control by diagnosis made in early stages. Studies have shown that speech impairments are early symptoms
of PD. In this study, an approach for the early diagnosis of patients with PD using speech based features was
proposed. In order to detect the PD, four feature groups such as Bark Spectrum coefficients, Mel Frequency
Cepstral Coefficients (MFCCs), Gammatone Cepstral Coefficients (GTCCs), and Spectral-Temporal Features
were created. Minimum Redundancy Maximum Relevance (mRMR) based feature selection was applied
to each feature group. Three classifiers including decision tree, Naive Bayes, and support vector machine
were employed to evaluate the performance of the feature sets. The proposed method was validated on the
Italian speech dataset. Feature selection improved the PD diagnosing performance, especially for the Naive
Bayes model which obtained 96.01% accuracy by overall feature selection and 96.17% by group-based feature
selection.
1 INTRODUCTION
Parkinson’s disease (PD) is a neurodegenerative dis-
ease that is the result of decreased dopamine level,
which is a brain chemical produced by neurons work-
ing as a neurotransmitter in the brain (Appakaya and
Sankar, 2018). The reason behind PD is still un-
known, but genetic and environmental factors are
thought to be the cause ((Polat and Nour, 2020),
(Tolosa et al., 2021)). There is no definitive treatment
for the disease; however, some drugs used to control
symptoms in the early stages have an important effect
on the progression of the disease. Changes in speech
and handwriting, tremors, slowed movements, muscle
stiffness, deterioration of postural and balance control
and loss of automatic movements are common symp-
toms in Parkinson’s patients.
Vocal problems are one of the most important
symptoms seen in the early stages of the disease in
approximately 90% of people with PD (Connolly and
Lang, 2014). The number of studies focused on de-
a
https://orcid.org/0000-0002-6124-5621
b
https://orcid.org/0000-0002-9887-3808
tecting PD from speech signals in early stages of the
disease is increasing day by day. Dataset collected by
(Sakar et al., 2013), which is one of the first examples
in the literature, has been used in many studies. This
dataset consists of extracted features including time-
frequency-based features of audio signals of healthy
controls (HC) and patients with PD. In a study (Priya
et al., 2021) that uses this dataset; decision tree, naive
bayes, support vector machines, k-nearest neighbor,
random forest classifiers were compared obtaining ac-
curacy rates of 91, 61, 64, 64 and 95% respectively.
Since the dataset consists of extracted features instead
of original audio signals, studies using this dataset
do not include preprocessing and feature extraction
steps. In another study, (Dimauro and Girardi, 2019)
published the dataset they collected to use in their
study (Dimauro et al., 2017) where a system designed
to convert the voice of PD patients into text. This
dataset contains the original speech signals, and it was
used in several studies to examine feature extraction
techniques.
A study (Appakaya et al., 2020) that uses the
same dataset by extracting Mel Frequency Cepstral
726
Tekindor, A. and Aydın, E.
Feature Selection Improves Speech Based Parkinson’s Disease Detection Performance.
DOI: 10.5220/0012347300003657
In Proceedings of the 17th International Joint Conference on Biomedical Engineering Systems and Technologies (BIOSTEC 2024) - Volume 1, pages 726-732
ISBN: 978-989-758-688-0; ISSN: 2184-4305
Copyright © 2024 by Paper published under CC license (CC BY-NC-ND 4.0)

Coefficients (MFCC) and pitch synchronous features
trained 25 classifiers and obtained a mean classifica-
tion accuracy of 88.5%. Another study (Appakaya
et al., 2021) that used the same dataset achieved 85%
classification accuracy with Logistic regression and
Linear SVM using the features extracted by autoen-
coders. With the application of leave-one-subject-out
(LOSO) classification, 84% accuracy was obtained.
(Lamba et al., 2023) used a hybrid dataset, one of
them is the same Italian speech dataset. The ex-
tracted features include duration, fundamental fre-
quency, harmonic to noise ratio (HNR), jitter, shim-
mer, and principal component analysis (PCA). After
applying a genetic algorithm method for feature se-
lection, k-nearest neighbor, XGBoost, random forest,
and logistic regression classifiers obtained 90% mean
accuracy.
In this study, it is aimed to evaluate the effect of
feature extraction and feature selection on the per-
formance of Parkinson’s disease diagnosis based on
speech signals. In this scope, four feature groups,
such as, Bark Spectrum coefficients, Mel Frequency
Cepstral Coefficients (MFCCs), Gammatone Cepstral
Coefficients (GTCCs) and other (spectral-temporal)
features were extracted. The most significant features
in the groups were determined by the feature selec-
tion method based on Minimum Redundancy Max-
imum Relevance (mRMR). Proposed approach was
validated on the dataset collected by (Dimauro and
Girardi, 2019). The performance of the proposed
method was evaluated by accuracy, precision, recall,
F1 score, and feature reduction rate metrics. The
results of the study revealed that the mRMR-based
feature selection method could improve the accuracy
rates.
This study consists of five sections. In Section 2,
the dataset, feature extraction methods, feature selec-
tion and classification method used in the study are
explained. Experimental results are presented in Sec-
tion3. Theresultsofthestudyareinterpreted in Section
4, and finally, the study is summarized in Section 5.
2 METHODOLOGY
2.1 Dataset
The dataset used in this study was collected by (Di-
mauro et al., 2017) and can be accessed from IEEE
Dataport. Italian speech recordings of 50 speakers
with 29 males (19 PD, 10 HC) and 21 females (9
PD, 12 HC) are contained. Speakers with PD aged
between 40 and 80 years and healthy controls aged
between 60 and 77 years. Original dataset consists
of records where a passage that is phonetically bal-
anced is read twice, /pa/ and /ka/ syllables for 5 sec,
reading of some phonemically balanced words, read-
ing of some phonemically balanced phrases and two
phonations of the vowels /a/, /e/, /i/, /o/ and /u/. Sam-
pling frequency for speech samples is 16 kHz. Dis-
tance between the speaker and microphone is 15 to
25 cm and recordings were made in noise-free con-
ditions. Speakers exhibit no speech pathology except
for PD. In the scope of this study, exclusive utiliza-
tion was made of vowel recordings from the dataset
encompassing speech signals. Two speakers of HC
whose recordings are poor in quality were excluded.
Also, after some trials of feature extraction, it was
observed that the dataset is dramatically imbalanced
in terms of recording length. In order to handle this
problem, speakers with a long recording time were
excluded and PD-HC distribution was balanced. One
vowel phonation of other speakers for each group was
included.
2.2 Feature Extraction
The datasets contain voice recordings stored as
“.wav” files. MATLAB is utilized for both fea-
ture extraction and classification. Speech signals ex-
hibit non-stationarity due to variations in their statis-
tical characteristics over time. Applying windowing
techniques to process speech signals involves treat-
ing them as approximately stationary (Kumar et al.,
2022). Typically, window durations fall within the
range of 20 to 40 ms. In this study, we divided the
dataset into non-overlapping segments of 50 ms each,
resulting in 800 samples per window. 73 features
in four feature groups were extracted. They include
bark spectrum, MFCC, GTCC, and other features
consisting of spectral centroid, spectral crest, spectral
decrease, spectral entropy, spectral flatness, spectral
flux, spectral kurtosis, spectral rolloff point, spectral
skewness, spectral slope, spectral spread, consisting
of pitch, harmonic ratio, zero cross rate, and short
time energy. The descriptions of the extracted fea-
tures are given below:
2.2.1 Bark Spectrum
Bark spectrum refers to a psychoacoustic frequency
scale that approximates the human perception of
sound.
2.2.2 Mel Frequency Cepstral Coefficients
(MFCC)
MFCC is the expression of the short-time power spec-
trum of the audio signal on the Mel scale.
Feature Selection Improves Speech Based Parkinson’s Disease Detection Performance
727

2.2.3 Gammatone Cepstral Coefficients
(GTCCs)
GTCCs are features derived from Gammatone filters
which are inspired biologically to approximate the au-
ditory filtering performed by the human ear.
2.2.4 Other Features
This feature group includes other spectral and tempo-
ral features.
Spectral Centroid: Spectral centroid is a measure
that indicates the central frequency or “balance point”
of a spectrum.
Spectral Crest: Spectral crest measures the relation-
ship between the highest point in a spectrum and the
average value of the spectrum.
Spectral Decrease: Spectral decrease measures the
extent of the spectrum’s decrease, focusing on the
slopes of lower frequencies.
Spectral Entropy: Spectral entropy gauges the peak-
iness of the spectrum.
Spectral Flatness: Spectral flatness calculates the ra-
tio between the geometric mean and the arithmetic
mean of a spectrum.
Spectral Flux: Spectral flux measures the variability
of a spectrum over time.
Spectral Kurtosis: Spectral kurtosis quantifies the
flatness or non-Gaussianity of a spectrum around its
center frequency.
Spectral Rollof Point: Spectral rolloff point mea-
sures the bandwidth of the audio signal by determin-
ing the frequency bin under which a given percentage
of the total energy exists.
Spectral Skewness: Spectral skewness measures the
symmetry around the spectral centroid and is also
known as spectral tilt in phonetics. It, along with
other spectral moments helps distinguish the place of
articulation.
Spectral Slope: Spectral slope quantifies the de-
crease in a spectrum.
Spectral Spread: Spectral spread calculates the stan-
dard deviation around the spectral centroid and repre-
sents the “instantaneous bandwidth” of a spectrum.
Pitch: Pitch is used to describe the height or lowness
of a tone as perceived by the ear.
Harmonic Ratio: Harmonic ratio refers to a measure
that quantifies the presence and strength of harmonics
in a sound signal.
Zero Cross Rate: Zero-crossing rate is a measure
that quantifies the rate at which a signal changes its
sign (from positive to negative or vice versa) over
time.
Short Time Energy: Short time energy specifies
the signal amplitude of a certain signal point over
a period of time ((Kumar et al., 2022),(Hawi et al.,
2022),(Boualoulou et al., 2023), (Priya et al., 2022),
(Majda-Zdancewicz et al., 2022), (Hassan et al.,
2022), (Chu et al., 2009)).
2.3 Feature Selection
Feature selection is an essential step since it deter-
mines the most distinguishing features and reduces
computational time. One of the objectives of our
study is to indicate the effect of feature selection
on classification performance. In this context, the
mRMR method was used.
Minimum Redundancy Maximum Relevance
(mRMR): MRMR algorithm is a widely recognized
technique for selecting relevant features in a feature
set. It accomplishes this by evaluating both the
redundancy between features, and the relevance
between features and the target variable. To assess
redundancy and relevance, mRMR employs the
concept of mutual information from information
theory. mRMR ranks features by their predictive
significance concerning the target variable, taking
into account both relevance and redundancy. This
ranking allows for identifying important features for
accurate predictions while minimizing redundant
information among them (Radovic et al., 2017).
Two scenarios were studied where the mRMR al-
gorithm was applied, as shown in Figure 2. Firstly,
the top 25 features (most important ones) of the train-
ing data were selected from the entire feature set by
mRMR. Secondly, each single feature group (Bark,
MFCC, GTCC, Other) was evaluated alone in terms
of feature importance. Subsets were created by select-
ing the top 9 features for bark group, top 4 features for
MFCC group, top 4 features for GTCC group, and top
8 features for other group. Then, these subsets were
combined.
2.4 Classification
After feature extraction and feature selection by
mRMR method, different classification tasks were
done. Dataset were split into train and test sets with
the ratio of 80% and 20% respectively. 10-fold cross-
validation was applied in each session. Three dif-
ferent conditions were observed during the experi-
ment. Firstly, three classifiers including decision tree,
Naive Bayes and support vector machine models were
trained by all extracted features. Then, overall se-
lected features and combination of group-based se-
lected features were used to train the same classifiers
respectively. The evaluation metrics include accu-
racy, precision, recall, F1-score and Feature Reduc-
BIOSIGNALS 2024 - 17th International Conference on Bio-inspired Systems and Signal Processing
728
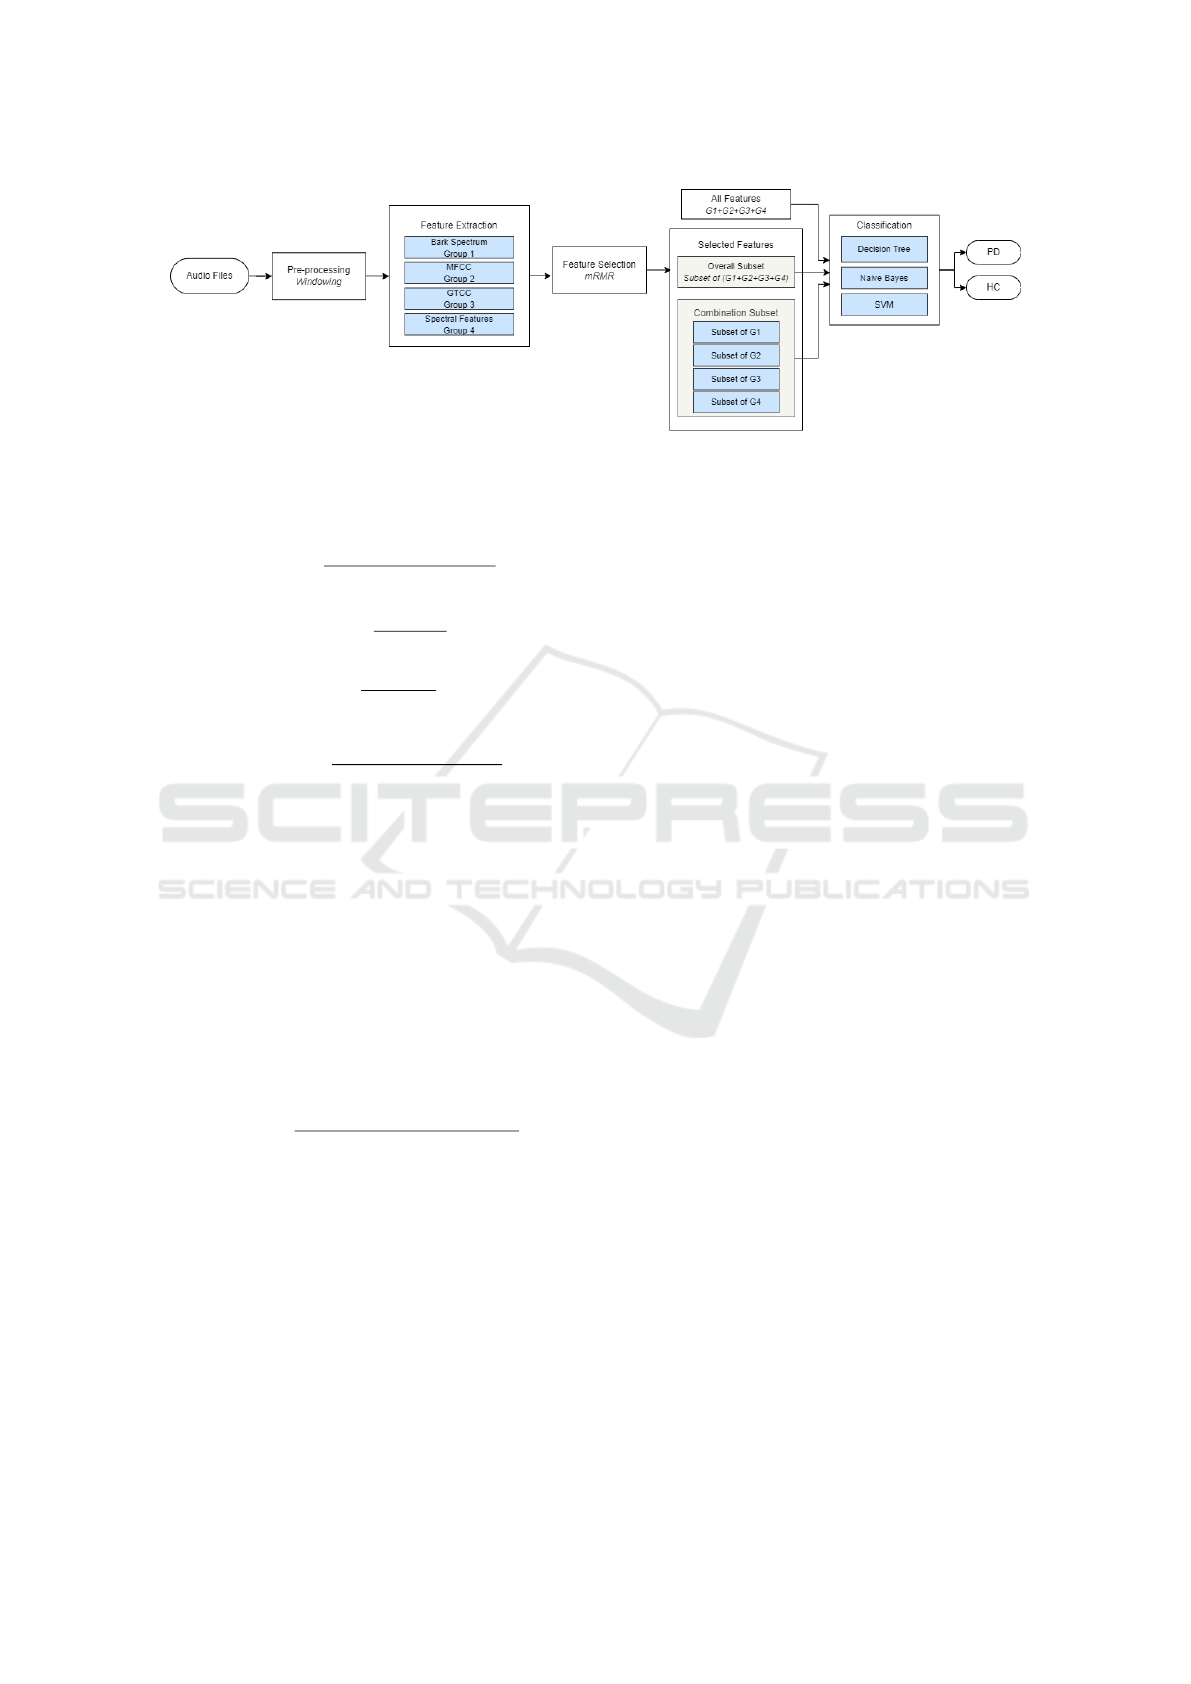
Figure 1: Experimental procedure of the proposed method.
tion Rate score. The formulations of these metrics are
given in Equations 1-4.
Accuracy =
T P + T N
T P + FP + T N + FN
(1)
Precision =
T P
T P + FP
(2)
Recall =
T P
T P + FN
(3)
F1 − Score =
2 ∗ Precision ∗ Recall
Precision + Recall
(4)
where TP, TN, FP, FN are the numbers of true pos-
itives, true negatives, false positives and false nega-
tives. Accuracy is the percentage of data points cor-
rectly predicted out of the total data availability. Pre-
cision is the accuracy of positive predictions. Recall
is the measure of the model correctly identifying true
positives. F1- Score is the harmonic mean of preci-
sion and recall. Evaluating accuracy and F1 score to-
gether gives more meaningful results.
Feature Reduction Rate (FRR) is the ratio of the
number of removed features to the original number
of features. It is computed using Equation 5 (Aydin,
2020):
FRR = 1 −
Number of selected features
Number of all features
(5)
Number of the selected features and FRR for over-
all feature selection and group-based feature selection
are given in Table 1. In Figure 1, experimental proce-
dure of the proposed approach is shown step by step.
3 RESULTS
In the step of feature extraction, 32 in bark spectral
features group (group 1), 13 in MFCC features group
(group 2), 13 in GTCC features group (group 3) and
15 in other features group (group 4); 73 features in to-
tal were extracted. Feature groups and number of fea-
tures are shown in Table 1. MRMR algorithm was ap-
plied for feature selection. Feature importance graphs
for each feature group are shown in Figure 2.
Decision tree, Naive Bayes and SVM models
were chosen as classifiers since they show high per-
formance on disease detection from speech signals.
In this study, experiments were carried out in three
stages. In the first stage, the performance of the
models in diagnosing Parkinson’s disease was exam-
ined by using all the features in the four extracted
feature groups. In the second stage, evaluation was
made using the overall subset, where features were se-
lected from the entire feature set. Finally, evaluation
was made using the combination subset where group-
based extracted features were combined. Classifier
parameters were specifically determined for each ex-
periment. 10-fold cross-validation was applied in the
validation of models. The results are given in Ta-
ble 2. Both overall subset and combination subset
contain 25 features. This ensures that the feature re-
duction rate was 65.75For all features, the decision
tree model achieved an accuracy of 93.83%, with a
high recall of 95.94%. This indicates that the model
successfully identified the majority of true positive
cases (PD). 92.73% precision and 94.31% F1 score
were also commendable, suggesting a balanced trade-
off between precision and recall. The Naive Bayes
model achieved 89.69% accuracy, slightly lower than
the Decision Tree. However, it showed a remark-
able recall of 96.88%, indicating a strong ability to
correctly classify positive cases. 90.93% F1 score
showed a reasonable balance between precision and
recall. SVM achieved 94.37% accuracy, with a high
precision of 97.12%. It indicates the SVM model
has a strong ability to correctly classify positive in-
stances while showing a good overall performance
with 92.17% recall and 94.58% F1 score.
For overall selected features, all models demon-
strated improved performance. The Decision Tree
model achieved an accuracy of 94.20%, maintaining a
Feature Selection Improves Speech Based Parkinson’s Disease Detection Performance
729
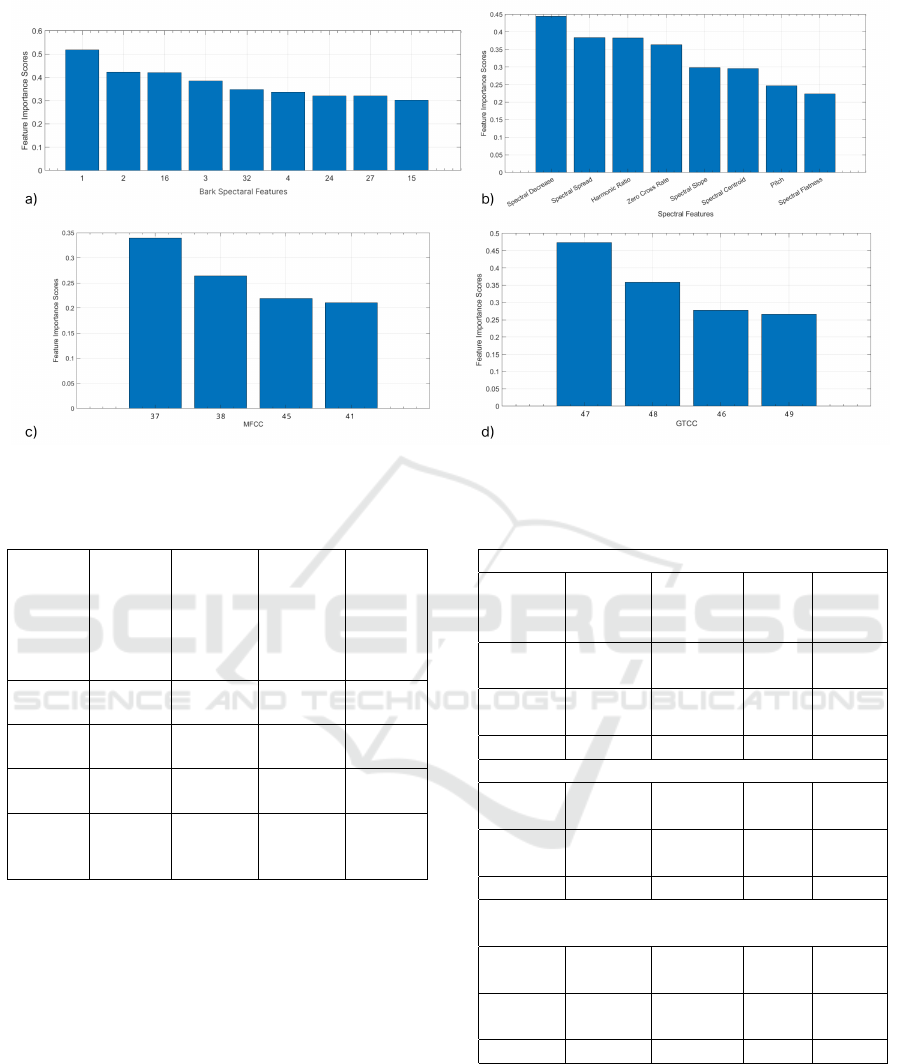
Figure 2: Importance score of a) Bark Spectral features, b) Other features, c) MFCC features, d) GTCC features.
Table 1: Number of the selected features and Feature Re-
duction Rates.
Feature
Subset
Number
of
Feature
Number
of
Selected
Feature
(Over-
all)
Number
of
Selected
Feature
(Group
based)
FRR
(Over-
all -
Group
Based)
Bark
SF
32 4 9 87.5 -
72.88
MFCC 13 5 4 61.53 -
69.23
GTCC 13 6 4 56.85 -
69.23
Other
Fea-
tures
15 10 8 33.33 -
46.67
balance between precision, recall and F1 score. Naive
Bayes showed significant improvement, with an accu-
racy of 96.01%. It showed higher performance than
other models in the experiment with 96.59% precision
and 96.24% F1 score. SVM also improved, achieving
an accuracy of 94.92%, with a precision of 93.15%
and a high recall of 97.65%. The F1 Score for SVM
was 95.35%.
Similar to overall feature selection, group-based
feature selection improved the performance of the De-
cision Tree, Naive Bayes and SVM models. The De-
cision Tree obtained 96.36% accuracy, 95.45% preci-
sion and a high Recall of 97.84%. The F1 Score was
96.63%. Feature selection provided a balanced trade-
off between recall and other metrics for Naive Bayes
Table 2: Performance of the models according to different
feature subsets.
All Features
Model Accuracy
%
Precision
%
Recall
%
F1
Score
%
Decision
Tree
93.83 92.73 95.94 94.31
Naive
Bayes
89.69 85.66 96.88 90.93
SVM 94.37 97.12 92.17 94.58
Selected Features (Overall Subset)
Decision
Tree
94.20 93.07 96.30 94.66
Naive
Bayes
96.01 96.59 95.89 96.24
SVM 94.92 93.15 97.65 95.35
Group-Based Selected Features
(Combination Subset)
Decision
Tree
96.36 95.45 97.84 96.63
Naive
Bayes
96.17 96.60 96.20 96.40
SVM 94.71 96.15 93.84 94.98
with 96.17% accuracy, 96.60% precision, 96.20% re-
call and 96.40% F1 score. SVM achieved an accuracy
of 94.71%, with a precision of 96.15% and a recall of
93.84%. The F1 score for SVM in this scenario was
94.98%. From a general perspective, an increase in
accuracy rates was observed. Besides, it is seen that
F1 scores are also improved with feature selection.
BIOSIGNALS 2024 - 17th International Conference on Bio-inspired Systems and Signal Processing
730

4 DISCUSSION
The results indicate that both overall feature selection
and group-based feature selection improved the per-
formance of the decision tree, Naive Bayes, and SVM
models. Also, group-based feature selection showed
higher performance than overall feature selection for
all models. In this study, the number of features was
reduced from 73 to 25 by feature selection, resulting
in a 65% reduction rate; at the same time, an increase
in accuracy and F1 score was observed for all classi-
fiers. It indicates strong overall performance.
The study using the same dataset (Appakaya
et al., 2020) obtained 88.5% accuracy. However,
this performance was obtained by applying leave-
one-subject-out (LOSO). LOSO is a cross-validation
method that indicates the performance reliability for
entirely new data. With this advantage, it can be
preferred in diagnostic decision support systems. In
this study, 10-fold cross-validation was applied dur-
ing the experiments, and 96.36% accuracy was ob-
tained. Feature selection not only increased accuracy
across all classifier types, but also improved results by
enhancing other metrics closer to a balanced ratio.
The results underscore the importance of feature
engineering and model selection in achieving the best
possible classification performance. Feature selection
excludes the features with lower importance for the
training process and increases the classification per-
formance. By choosing the proper subset of the fea-
tures, classification performance could be improved.
5 CONCLUSION
Parkinson’s disease (PD) is a neurodegenerative con-
dition characterized by a decrease in dopamine levels
in the brain. Currently, there is no known cure for PD,
but early diagnosis plays a crucial role in managing
the progression of the disease. In this study, an ap-
proach for early detection of PD using three feature
subsets obtained by speech analysis was proposed,
and the effect of feature selection on classification
performance was observed. MRMR based feature se-
lection was applied to define the most discriminative
features. The study revealed a potential improvement
in the classification performance by selecting impor-
tant features in speech-based PD diagnosis.
ACKNOWLEDGEMENTS
This work was supported by the Scientific and Tech-
nological Research Council of Turkey (T
¨
UB
˙
ITAK) as
2224-A project. The authors heartedly thank and ap-
preciate T
¨
UB
˙
ITAK for their support.
REFERENCES
Appakaya, S. B. and Sankar, R. (2018). Classification of
parkinson’s disease using pitch synchronous speech
analysis. In 2018 40th Annual International Confer-
ence of the IEEE Engineering in Medicine and Biol-
ogy Society (EMBC).
Appakaya, S. B., Sankar, R., and Ra, I.-H. (2020). Classifier
comparison for two distinct applications using same
data. In 9th International Conference on Smart Media
and Applications. SMA 2020: The 9th International
Conference on Smart Media and Applications.
Appakaya, S. B., Sankar, R., and Sheybani, E. (2021).
Novel unsupervised feature extraction protocol us-
ing autoencoders for connected speech: Application
in parkinson’s disease classification. In Wireless
Telecommunications Symposium (WTS), page 1–5.
IEEE.
Aydin, E. A. (2020). Subject-specific feature selection
for near infrared spectroscopy based brain-computer
interfaces. Computer Methods and Programs in
Biomedicine, 195:105535.
Boualoulou, N., Drissi, T. B., and Nsiri, B. (2023). Cnn
and lstm for the classification of parkinson’s disease
based on the gtcc and mfcc. Applied Computer Sci-
ence, 19(2):1–24.
Chu, S., Narayanan, S., and Kuo, C. C. J. (2009). Environ-
mental sound recognition with time–frequency audio
features. IEEE Transactions on Audio, Speech, and
Language Processing, 17(6):1142–1158.
Connolly, B. S. and Lang, A. E. (2014). Pharmacological
treatment of parkinson disease. JAMA, 311:1670.
Dimauro, G. and Girardi, F. (2019). Italian parkinson’s
voice and speech.
Dimauro, G., Nicola, V. D., Bevilacqua, V., Caivano, D.,
and Girardi, F. (2017). Assessment of speech intelli-
gibility in parkinson’s disease using a speech-to-text
system. IEEE Access, 5:22199–22208.
Hassan, F., Mehmood, M. H., Younis, B., Mehmood, N.,
Imran, T., and Zafar, U. (2022). Comparative analysis
of machine learning algorithms for classification of
environmental sounds and fall detection. International
Journal of Innovations in Science & Technology.
https://journal.50sea.com/index.php/IJIST/article/vie
w/188.
Hawi, S., Alhozami, J., AlQahtani, R., AlSafran, D.,
Alqarni, M., and Sahmarany, L. E. (2022). Automatic
parkinson’s disease detection based on the combina-
tion of long-term acoustic features and mel frequency
cepstral coefficients (mfcc). Biomedical Signal Pro-
cessing and Control, 78:104013.
Kumar, D., Satija, U., and Kumar, P. (2022). Automated
classification of pathological speech signals. In IEEE
19th India Council International Conference (INDI-
CON), pages 1–5.
Feature Selection Improves Speech Based Parkinson’s Disease Detection Performance
731

Lamba, R., Gulati, T., and Jain, A. e. a. (2023). A speech-
based hybrid decision support system for early detec-
tion of parkinson’s disease. Arab Journal of Science
and Engineering, 48:2247–2260.
Majda-Zdancewicz, E., Potulska-Chromik, A., No-
jszewska, M., and Kostera-Pruszczyk, A. (2022).
Parametric analysis of pilot voice signals in parkin-
son’s disease diagnostics. Journal of Automation,
Electronics and Electrical Engineering, 4(1):21–28.
Polat, K. and Nour, M. (2020). Parkinson disease classifi-
cation using one against all based data sampling with
the acoustic features from the speech signals. Medical
Hypotheses, 140:109678.
Priya, B., Rithiga, B., and R, B. (2021). Parkinson dis-
ease detection based on speech using various machine
learning models and deep learning models. In Interna-
tional Conference on System, Computation, Automa-
tion and Networking (ICSCAN), pages 1–6.
Priya, E., S, J. P., Reshma, P. S., and S, S. (2022). Tem-
poral and spectral features based gender recognition
from audio signals. In 2022 International Conference
on Communication, Computing and Internet of Things
(IC3IoT), pages 1–5.
Radovic, M., Ghalwash, M., Filipovic, N., and Obradovic,
Z. (2017). Minimum redundancy maximum relevance
feature selection approach for temporal gene expres-
sion data. BMC Bioinformatics, 18(1):9.
Sakar, B. E., Isenkul, M. E., Sakar, C. O., Sertbas, A., Gur-
gen, F., Delil, S., Apaydin, H., and Kursun, O. (2013).
Collection and analysis of a parkinson speech dataset
with multiple types of sound recordings. IEEE Jour-
nal of Biomedical and Health Informatics, 17:828–
834.
Tolosa, E., Garrido, A., Scholz, S. W., and Poewe, W.
(2021). Challenges in the diagnosis of parkinson’s dis-
ease. The Lancet Neurology, 20:385–397.
BIOSIGNALS 2024 - 17th International Conference on Bio-inspired Systems and Signal Processing
732
