Why an Automated, Scalable and Resilient Service for Semantic
Interoperability is Needed
Maximilian St
¨
abler
1 a
, Tobias M
¨
uller
2 b
Frank K
¨
oster
3
and Christoph Schlueter-Langdon
4
1
Institute for AI Safety and Security, DLR, Wilhelm-Runge-Straße 10, 89081 Ulm, Germany
2
SAP SE, Dietmar-Hopp-Allee 16, 69190 Walldorf, Germany
3
Institute for AI Safety and Security, DLR, Lilienthalplatz 7, 38108 Braunschweig, Germany
4
Drucker School of Business, Claremont Graduate University, 1021 N Dartmouth Ave, Claremont, CA 91711, U.S.A.
Keywords:
Knowledege Representation, Ontologie Alignment, Semantic Interoperability, Graph Analysis.
Abstract:
The increasing linkage of different data sources and data ecosystems underlines the need for high-quality and
well-structured data. Unambiguous descriptions of data (meta-data) promote a common understanding of the
data among different users. New ontologies and data schemas are constantly being developed for this purpose.
While there are new ways to align, merge or match these ontologies and data schemas, the context of the data,
which is important for a clear understanding, is often not taken into account. This work addresses this problem
by analyzing a graph consisting of 1, 615 data attributes from 13 domains and 828 different ontologies. The
results show how overlapping and partially synonymous ontologies, both from the same domain and from
different domains, are. The results show the complexity for users in creating unique descriptions of data and
why new approaches and methods are needed to achieve semantic interoperability.
1 INTRODUCTION
Nowadays, ontology users and ontology mapping
practitioners often face a challenging problem: there
is an enormous amount of different ontologies from
different communities, with different backgrounds,
intensions, qualities, and scopes that claim some rele-
vance for ontology usage (Boukhers et al., 2023; Jab-
bar et al., 2017). The question how to deal with this
multitude of possibilities, how to best describe data
with it, which ontologies to use, which process to fol-
low when modeling or how to decide for or against
an ontology is so far only little explored. There are
many efforts that either match ontologies and individ-
ual datasets (Ardjani et al., 2015), or attempt to iden-
tify the identical entities in large knowledge graphs
(Nejhadi et al., 2011). Approaches for a holistic,
cross-domain view of ontologies and datasets (Doan
et al., 2004), that are not limited to individual ontol-
ogy parts or datasets, are scarce (Liu et al., 2021).
In this paper we aim to adress this issue and fo-
cus on the opportunities of modeling data with on-
a
https://orcid.org/0000-0003-1311-3568
b
https://orcid.org/0000-0002-9088-5054
tologies of a practitioner. The various possibilities
and manifestations that can occur in the application
when modelling an existing data schema were exam-
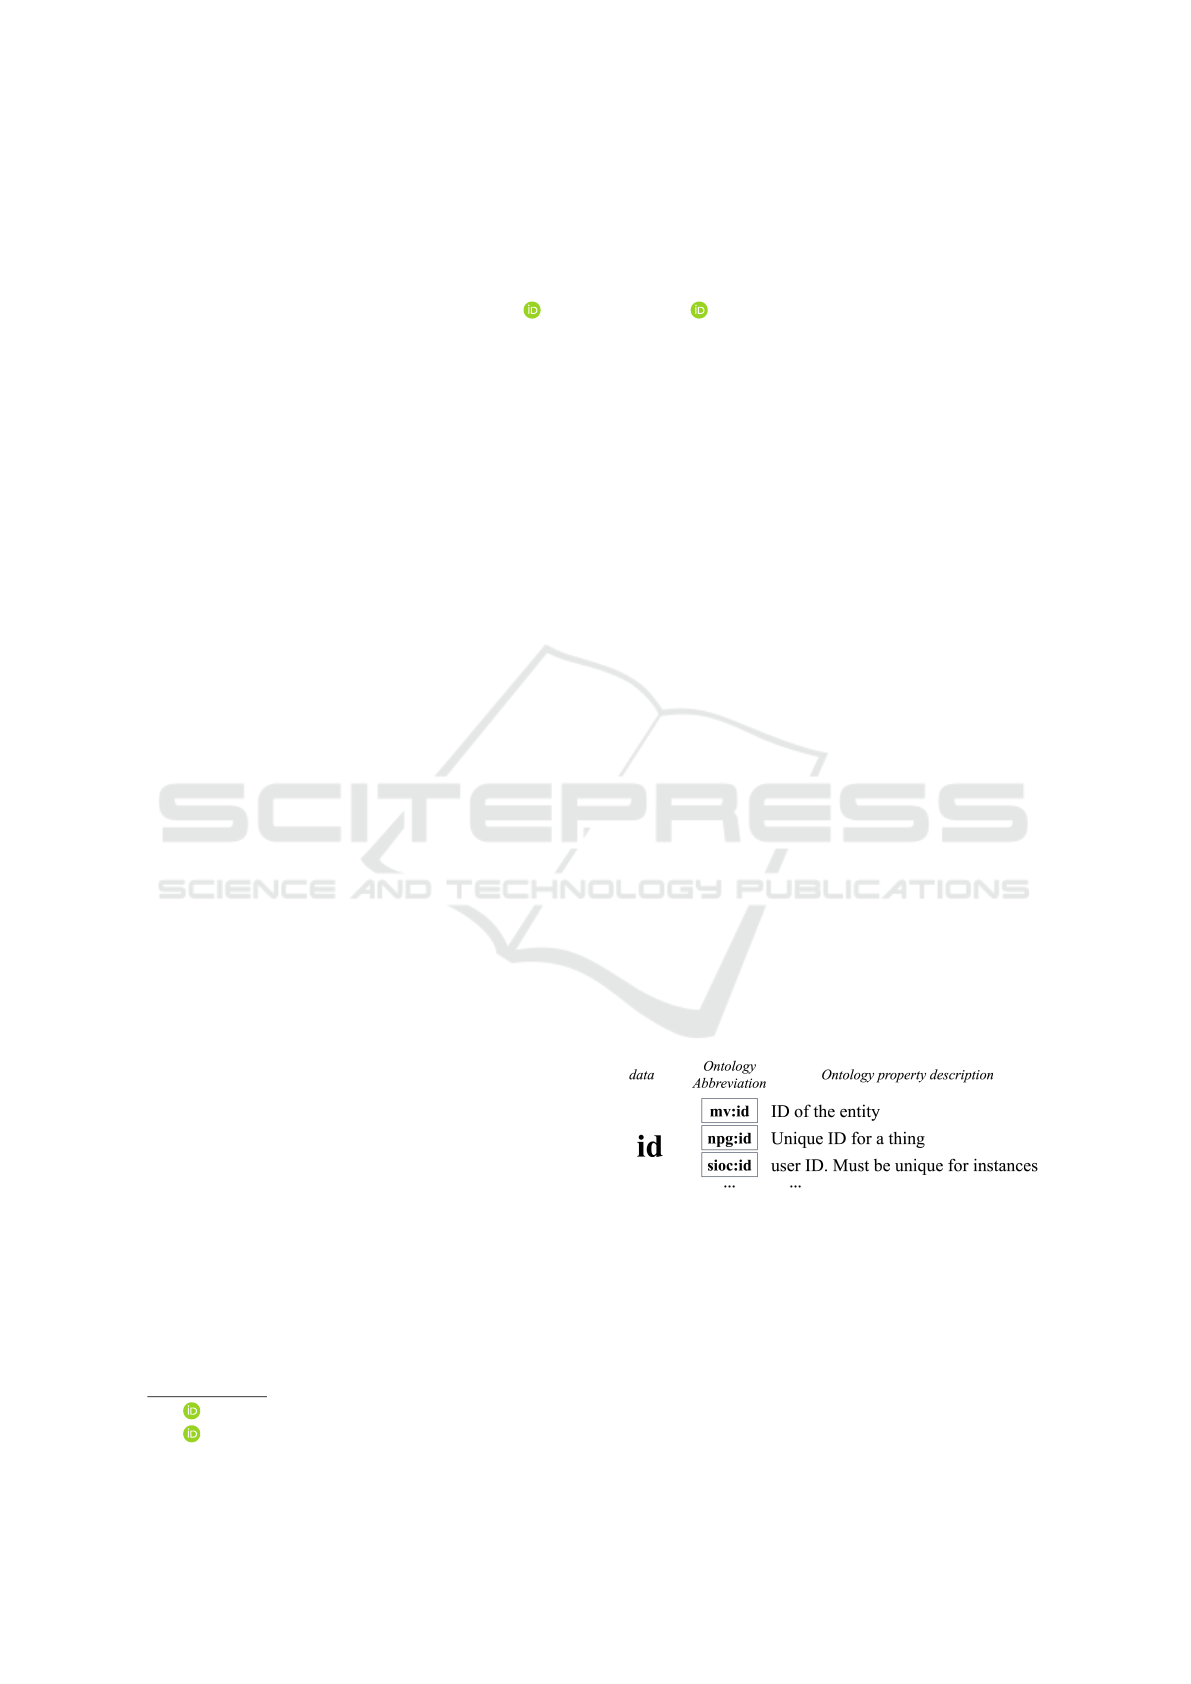
ined. An example of different ontological possibil-
ities are shown in Figure 1. Here, the practitioner
wants to assign a suitable explicit ontology entity to
his database column ”id”. Since the property ”id”
Figure 1: Possibilities to model ”id” with different ontolo-
gies.
does not exist only in one ontology, but in many
different ones from different domains, for different
application and in different version, the user asks
himself which option is the best for his specific use
case. Although the different ontologies all describe
the property ”id”, one can see that the descriptions of
the individual ontoligies for the property ”id” differ
slightly. The respective property targets once an ”en-
Stäbler, M., Müller, T., Köster, F. and Schlueter-Langdon, C.
Why an Automated, Scalable and Resilient Service for Semantic Interoperability is Needed.
DOI: 10.5220/0012345000003636
Paper published under CC license (CC BY-NC-ND 4.0)
In Proceedings of the 16th International Conference on Agents and Artificial Intelligence (ICAART 2024) - Volume 3, pages 299-307
ISBN: 978-989-758-680-4; ISSN: 2184-433X
Proceedings Copyright © 2024 by SCITEPRESS – Science and Technology Publications, Lda.
299

tity”, once a ”thing” and once a ”user”. This can be
irrelevant for some applications, but for other appli-
cations a distinction and exact differentiation between
these properties can be very important. Searching for
”id” on vocabulary search engines such as Linked-
Open-Data
1
, returns 2948 search results (properties
& classes) from 68 different ontologies. This hetero-
geneous and often opaque ontology landscape is ex-
plored in this work, based on 21081 attributes from
applications (e.g., database column names) and 763
individual ontologies from different domains. Thus,
in addition to describing the problems faced by ontol-
ogy users in modeling existing datasets, our contribu-
tions include descriptions of the connections and de-
pendencies in the domain-independent ontology land-
scape using real-world data attributes. The different
ontologies are divided into commonly used ”general”
ontologies and domainapplication specific ontologies.
Likewise, the connections between the 13 individual
domains are shown. The generated graph also allows
for analysis of which ontologies describe the same at-
tribute and which ontology fits best or least to which
domain.
The remainder of the paper is structured as fol-
lows: The following Chapter 2 presents related work
before describing the technical background in detail
in Section 3. Our approach is described in Chapter 4
before the results obtained are presented in Section 5,
and discussed with a conclusion in Section 6.
2 RELATED WORK
In a world where information is distributed over the
Internet, describing it clearly and understandably is
a serious challenge (Uschold and Gruninger, 2004).
There is a need to ensure that different people, from
different companies, communities or countries, un-
derstand and use the information in the same way
(Davies et al., 2020). Ontologies have provided a
solution to this problem by defining a specific vo-
cabulary used by a specific application (Euzenat and
Shvaiko, 2013). However, the sparse reuse of existing
ontologies in the development of domain or applica-
tion specific ontologies results in multiple similar on-
tologies in any given domain (Euzenat et al., 2004).
According to Predoiu (2006) it is unlikely to find two
ontologies that describe the same ”thing” (concept)
with perfect overlap which makes communication and
interoperability either difficult or impossible.
This has direct implications for the semantic land-
scape: in previous work (St
¨
abler et al., ) we have
1
https://lov.linkeddata.es/dataset/lov/terms
shown that the current semantic landscape is inter-
connected across different domains. Different do-
mains share few common attributes and use many do-
main/application specific attributes. For practitioners,
this means that a single ontology is not sufficient to
describe all attributes in a adequate level of detail in
most use cases. Different ontologies have to be used
together and in combination. This, combined with a
large number of ontologies describing individual at-
tributes in different ways, leads to significant man-
ual effort in merging and sharing different ontologies
(Boukhers et al., 2023).
Euzenat et al. (2004) also expect that ontologies will
not remain static and that different versions of ontolo-
gies will need to be tracked. It is expected that both
new interdisciplinary ontologies will need to be cre-
ated from existing domain-specific ontologies (Bento
et al., 2020) and various existing ontologies will need
to be merged (Liu et al., 2021). Examples include
merging domain-specific ontologies with more gen-
eral ontologies, consolidating different ontology ver-
sions, or enriching existing ontologies with new infor-
mation (Shenoy et al., 2013). In addition, new ontolo-
gies may be created by merging information from het-
erogeneous databases or other information sources.
Reducing manual effort in establishing seman-
tic interoperability is the goal of ontology matching
(Doan et al., 2004) and ontology alignment (Nejhadi
et al., 2011). Here, machine learning rules or methods
are used to automatically transfer concepts and terms
from one ontology or vocabulary to another. Tech-
niques such as semantic similarity measures (Sousa
et al., 2022), graph-based methods (Shenoy et al.,
2013) and deep learning models (Khoudja et al.,
2018; Iyer et al., 2020; Bento et al., 2020) are used to
identify correspondences between concepts in differ-
ent ontologies or vocabularies (Boukhers et al., 2023).
The goal is to create a mapping that allows the ex-
change of data between systems that use different on-
tologies or vocabularies, while preserving the mean-
ing of the data. In the literature, the problem of a
heterogeneous semantic landscape has been identified
several times and a variety of approaches to ontology
matching have been presented. Otero et al. (2015) de-
scribe that the different approaches are based on dif-
ferent techniques, but as a result they also work and
are applicable differently in different use cases. In
order to meet the increasing demand for high quality
data in the future, it is necessary to create automat-
able, scalable and resilient services that do not only
organise and connect the semantic landscape accord-
ing to a specific technique (context-based OR content-
based), but also connect different techniques (context-
based AND content-based AND element-level AND
ICAART 2024 - 16th International Conference on Agents and Artificial Intelligence
300
structure-level). We contribute to this by describing
and analyzing the semantic/ontology landscape.
3 TECHNICAL BACKGROUND
In this Chapter, we describe both the data sources for
the data attributes and ontologies used, and the tech-
nical basis the creation and analysis of the graph.
3.1 Ontologies - Linked Open
Vocabulary
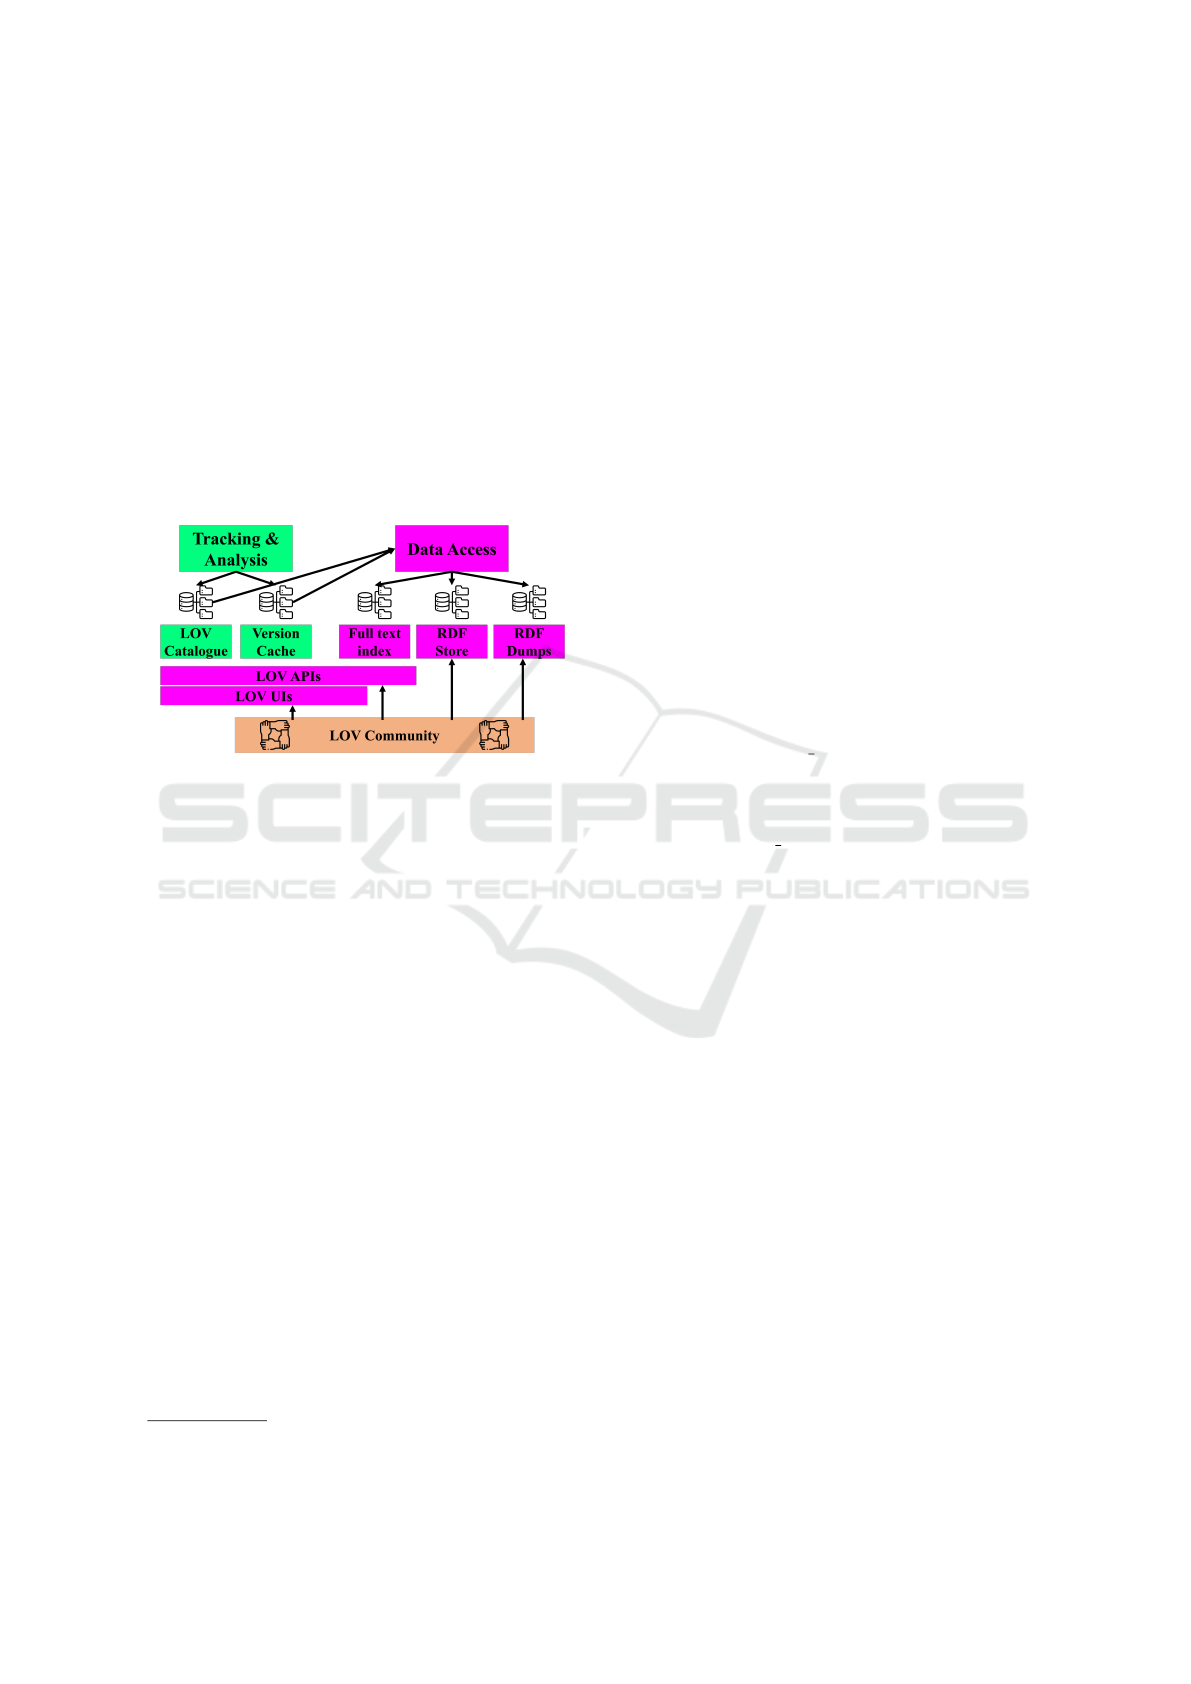
Figure 2: Overview of the Linked Open Vocabularies Ar-
chitecture. Adapted from (Vandenbussche et al., 2016)
Linked-Open-Vocabluary (LOV)
2
is an open and col-
laborative platform that provides a centralised repos-
itory for semantic vocabularies and ontologies. We
used LOV not only because it is a widely used tool
and has among the most comprehensive collection
of ontologies, but also because the interfaces ensure
ease and reliability of use. These vocabularies play a
critical role in defining and describing concepts, re-
lationships and attributes in various domains, allow-
ing knowledge to be represented in a structured and
machine-understandable format. The primary goal
of LOV is to foster the creation, dissemination, and
adoption of semantic vocabularies across domains,
thereby promoting semantic interoperability and har-
monising data integration efforts. LOV exhibits a
well-structured architecture to facilitate the organiza-
tion and management of semantic vocabularies. The
key components of LOV include:
• Vocabularies: LOV hosts a vast collection of se-
mantic vocabularies, each designed to cover a spe-
cific domain or knowledge area. These vocabu-
laries are meticulously curated and enriched with
metadata, making it easier for users to discover
and evaluate them.
• Ontologies: Beyond simple vocabularies, LOV
2
https://lov.linkeddata.es/dataset/lov
also includes ontologies—more complex and for-
malized representations of knowledge. Ontolo-
gies capture the relationships, axioms, and con-
straints within a domain, enabling the develop-
ment of sophisticated knowledge graphs.
A detailed overview of the architecture of LOV is
given in Figure 2. Vandenbussche et al. (2016)
describes the architecture as follows: The goal of
this architecture is to promote and facilitate the reuse
of well-documented vocabularies in the Linked Data
ecosystem. To achieve this goal, the LOV performs
the following three main activities: 1) collecting new
vocabularies from the LOV community; 2) tracking
and analyzing the LOV vocabulary catalog; and 3) en-
abling access to the data using various indexes and
publishing methods to facilitate data use, including a
search engine, data dumps, SPARQL endpoints, and
APIs. We used the API for our approach. All at-
tributes were sent to the endpoint:
https://lov.linkeddata.es/dataset/lov/api/ \
v2/term/search?q=<SEARCH STRING>& \
page_size=3000
The ”q” parameter contains the search string (at-
tribute) and the ”page size” parameter returns the
maximum possible number of search results. The
maximum number of search results when using the
endpoint was 2554 therefore no loss of possible re-
sults due to ”page size”. The LOV search engine
employs a ranking algorithm that assesses term pop-
ularity not only within datasets but also within the
LOV ecosystem. The algorithm assigns scores based
on which label property a searched term matches.
These scores are used in Chapter 5 as a decision vari-
able whether to assign an ontology to an attribute or
not. For calculating the score of each property class
match, four label property categories are considered
(Vandenbussche et al., 2016):
• Local Name: When a searched term matches the
local name of a URI (Uniform Resource Identi-
fier), it receives the highest score. The local name
is a compressed form of a term label used in con-
structing the URI. For instance, ”person” match-
ing the local name http://schema.org/Person re-
ceives a high score.
• Primary Labels: Matches on properties
like rdfs:label, dce:title, dcterms:title, and
skos:prefLabel also receive the highest score.
For example, matching ”person” with rdfs:label
”Person”@en gets a high score.
• Secondary Labels: Properties such
as rdfs:comment, dce:description, dc-
terms:description, and skos:altLabel are
classified as secondary labels. A medium
Why an Automated, Scalable and Resilient Service for Semantic Interoperability is Needed
301
score is assigned for matches on these prop-
erties. For example, matching ”person” with
dcterms:description ”Examples of a Creator
include a person, an organization, or a ser-
vice.”@en receives a medium score.
• Tertiary Labels: All properties not falling
into the previous categories are considered
tertiary labels and receive a low score. For
instance, matching ”person” with the URI
http://metadataregistry.org/uri/profile/RegAp/name
”Person”@en gets a low score.
The algorithm prioritizes properties like rdfs:label
over dcterms:comment based on their nature. Dif-
ferent indexing tokenizers and scoring methods are
applied to these labels accordingly. Consequently,
a term matching rdfs:label will have a higher score
compared to a match with dcterms:comment, reflect-
ing the different significance and roles of these labels
in the LOV ecosystem.
3.2 Attributes - SmartDataModels
In this Section, we introduce SmartDataModels
3
(SDM), an approach that aims to provide a compre-
hensive solution for managing and sharing data mod-
els. The SDM were used because we are not aware of
any approach that offers a comparable qualitatively
equivalent coverage of data attributes from different
domains. We outline the structure and capabilities of
SmartDataModels, emphasising their applicability to
a wide range of applications.
The SDM initiative addresses the critical need for
standardised data models in the context of data in-
teroperability. SDM are designed to serve as a com-
mon language for data, promoting interoperability
and seamless integration between disparate systems
and devices. The key objective of SmartDataMod-
els is to simplify the process of defining, sharing and
using data models in applications. These models cap-
ture the essential attributes and relationships of enti-
ties and events in a given domain, enabling develop-
ers, researchers and organisations to efficiently model
their data without reinventing the wheel. SDM have a
well-defined structure that facilitates their ease of use
and extensibility. The main components include:
• Entity Types: These represent real-world objects,
phenomena or concepts within a particular do-
main. For example, in the context of smart cities,
entity types might include ’streetlight’, ’car park’
or ’weather station’.
• Attributes: Each entity type is associated with
a set of attributes that describe its characteristics
3
https://smartdatamodels.org/
and properties. Attributes can be of different types
such as text, numeric, boolean or date/time. Ex-
amples of attributes are: features, id, address-
Country, cio, locatedAt, maxQ.
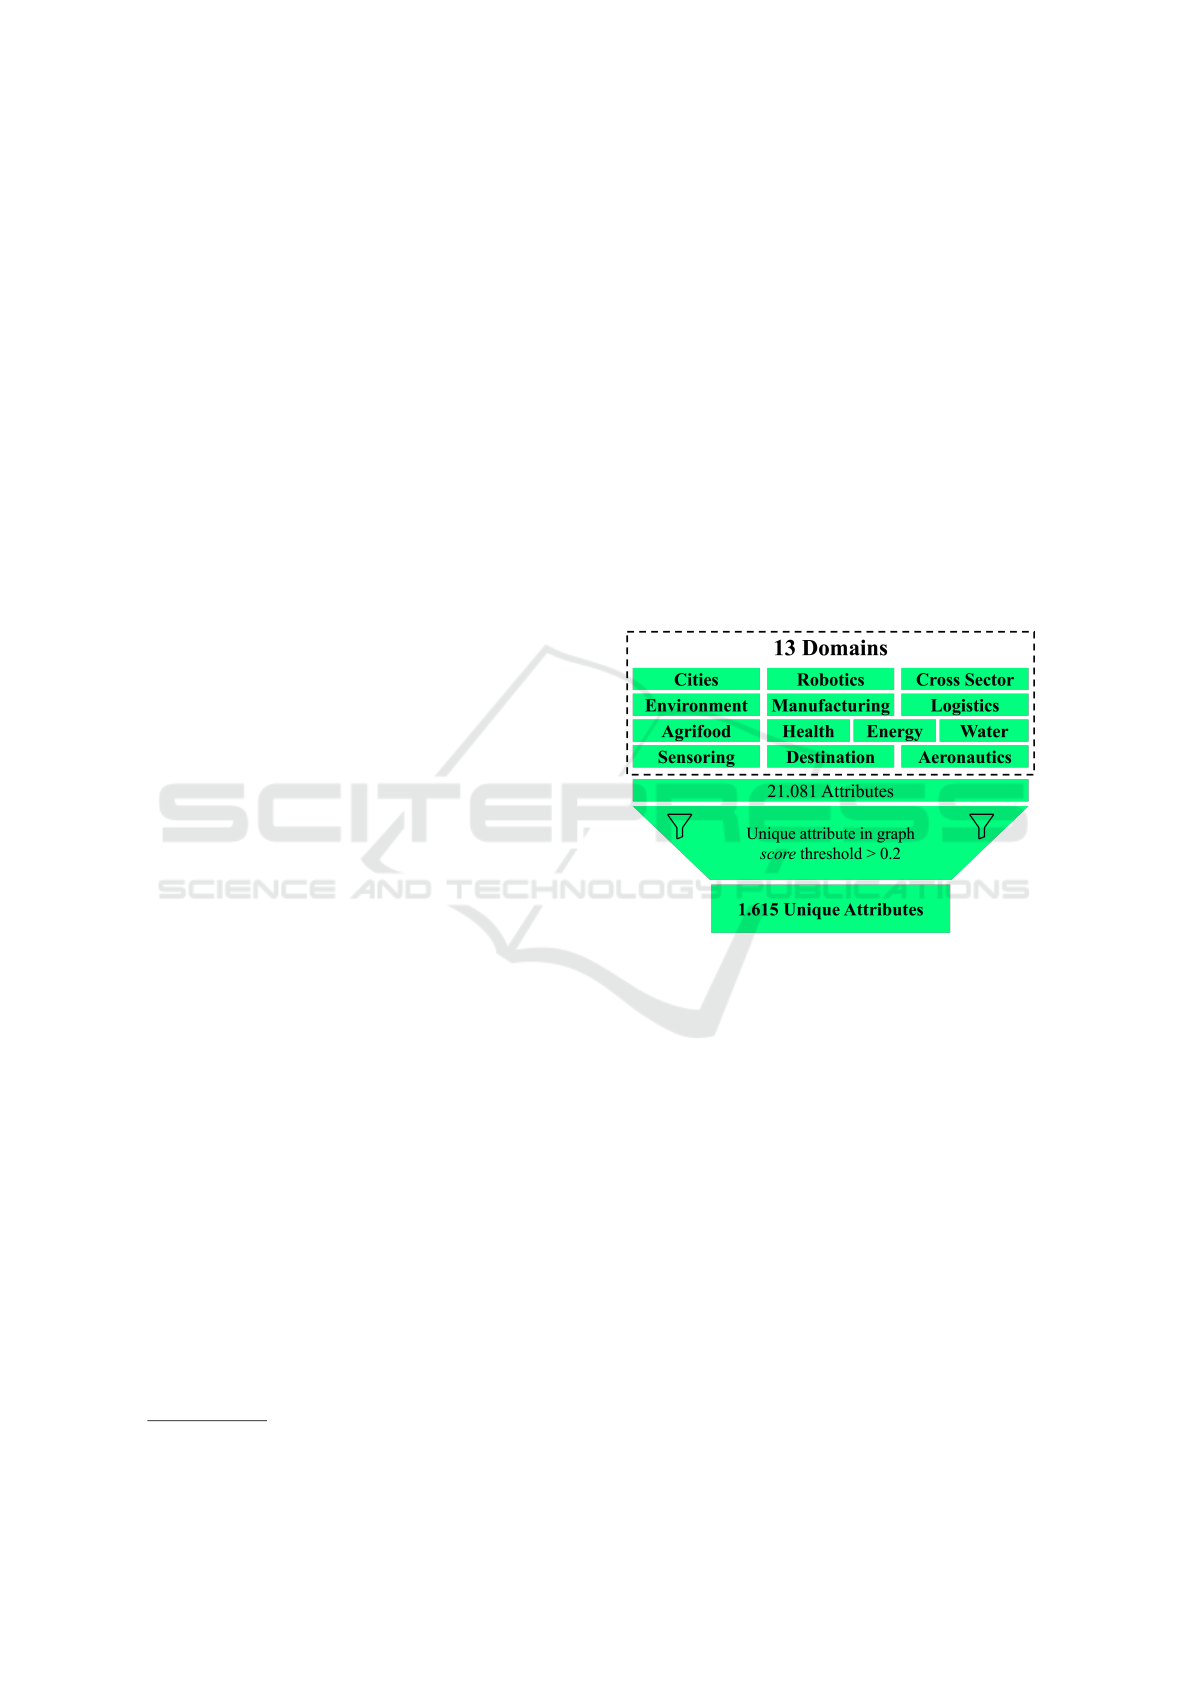
Figure 3 shows an overview of the SDM used. It can
be seen that only 1.615 of the 21.081 available at-
tributes are included in the graph generation. Various
filter criteria have been set for this purpose:
• The attribute must be unique in the graph. At-
tributes such as ’id’ or ’type’ are used in different
data models of the SDM, so these are already not
unique by the structure of the SDM. This has the
advantage that central attributes are uniquely de-
fined.
• The mapping score must be smaller than 0.2. For
further information on the score and the determi-
nation of the threshold, also see Chapter 4.2.
Figure 3: SmartDataModels overview with domains and
amount of used attributes.
3.3 Graphs
Graphs and networks are defined by a set of vertices
V and a set E of relations between the vertices. The
simplest relation is an edge defined as a pair of ver-
tices (a, b) with a ∈ V and b ∈ V . A weighted graph
G = (V, E) is attributed by a function w that assigns a
weight w(e), typically w(e) > 0, to each edge e ∈ E.
In the graphical representation of networks, the values
of the weights w of the graph G are distinguished by
line weight or value, line sign or line type (De Nooy,
2009). Examples of value differentials in a social con-
text include intensity, frequency, valence, or type of
social relationship. The set of possible relationships
per node is potentially infinite (Martino and Spoto,
2006). The degree of a node describes the number of
edges connected to the node.
ICAART 2024 - 16th International Conference on Agents and Artificial Intelligence
302

4 APPROACH
To be able to describe the semantic landscape repre-
sentatively, we searched for matching properties and
classes from 828 high-quality ontologies available
from LOV for each of the 21.081 SDM data attributes.
The attributes and ontologies were transformed into a
graph structure in order to analyse and describe the
dependencies, overlaps and connections that are in-
visible to the user. In the following Chapter, the data
sources for the ontologies and attributes as well as the
methods used are presented.
4.1 Data Basis
The tables 1, 2, 3 contain the data basis for the cre-
ation of the network graphs, as well as the calcula-
tion of all result values values. The vocabularies and
ontologies were requested through the LOV API end-
point described in Chapter 3.1. For the atttributes of
the SDM, along with extended description and infor-
mation of each attribute, the Python library PySmart-
DataModels
4
was used. This raw data was processed
using the Python programming language and trans-
formed into the following tables. For presentation
reasons, the columns of the tables are listed.
Table 1: SDM Attributes ”property” column
holds all 21.081 attributes. ”dataModel” and ”re-
poName” are used to create a mapping between the
attribute and the domains shown in Table 2.
• property: id
• dataModel: Activity
• repoName: dataModel.User
Table 2: SDM DataModels The ”repoName” col-
umn contains the matching key to Table 1. The ”do-
main” column describes the domains in which the re-
spective attribute is used.
• repoName: dataModel.User
• repoLink: https://github.com/smart-data-
models/dataModel.User.git
• dataModels: [Activity, UserContext]
• domains: [CrossSector]
Table 3: LOV-Attribute Mapping This table con-
solidates the attribute with the results from the API
endpoints request from the LOV server. Column
4
https://pypi.org/project/pysmartdatamodels/
”property” contains the respective attribute, and col-
umn ”num results” shows the total number of re-
sults from the request. The columns ”dataModels”,
”prefix name” and ”prefix prefix” describe the re-
spective ontology-property. For all results of an at-
tribute (”property”-column), ”num results” remains
the same.
• property: id
• num results: 2948
• prefix name: mv:id
• score: 0.555
• vocab prefix: mv
4.2 Graph Construction and Analysis
The data presented is used to create various graphs
and to derive descriptive statistics to describe the se-
mantic landscape. A detailed list of the libraries
used, together with the Python code, can be found on
GitHub
5
. The visualisations of the graphs were cre-
ated using the program Gephi
6
.
In the present work, several columns of the pre-
sented tables were defined as nodes. These are: SDM
attributes (Table 3: property), the ontology property /
class (Table 3: prefix name), ontology (Table 3: vo-
cab prefix) and the domains (Table 2: domains).
We also use weighted edges to better describe the re-
lationship between attributes, ontology properties /
classes and domains. As weight either the common
occurrence (number) of the two nodes (
∑
(a, b)), or
the score (Table 3: score) was used. The threshold for
creating an edge was set to 0.2. Therefore, only one
edge was drawn between two nodes if the score was
greater than 0.2. This cutoff value was determined by
independent manual examinations by three scientists.
The scientists each scored the query’s LOV (property,
description) results as ”matching” or ”mismatching”
for 200 random SDM attributes. For each SDM at-
tribute, a maximum of 50 results were scored. If the
number of LOV results was greater than 50, 50 re-
sults were sampled from the total results. Below an
overview of the classification scheme of a researcher
for LOV results for the SDM attribute ”address”. For
presentation reasons, the table is presented as a num-
bered list.
5
http://bit.ly/3FanBYI
6
https://gephi.org/
Why an Automated, Scalable and Resilient Service for Semantic Interoperability is Needed
303
1. • property: swpo:hasAddress
• description: This property relates an agent to
its address.
• suitable: True
2. • property: gleif-base:hasCity
• description: name and address. It makes use
of the OMG Languages @en
• suitable: False
In this example, the LOV result ”swpo:hasAddress”
was assessed as suitable (1) and the LOV result ”gleif-
base:hasCity” was assessed as unsuitable (2). This
process was performed for each of the 200 ran-
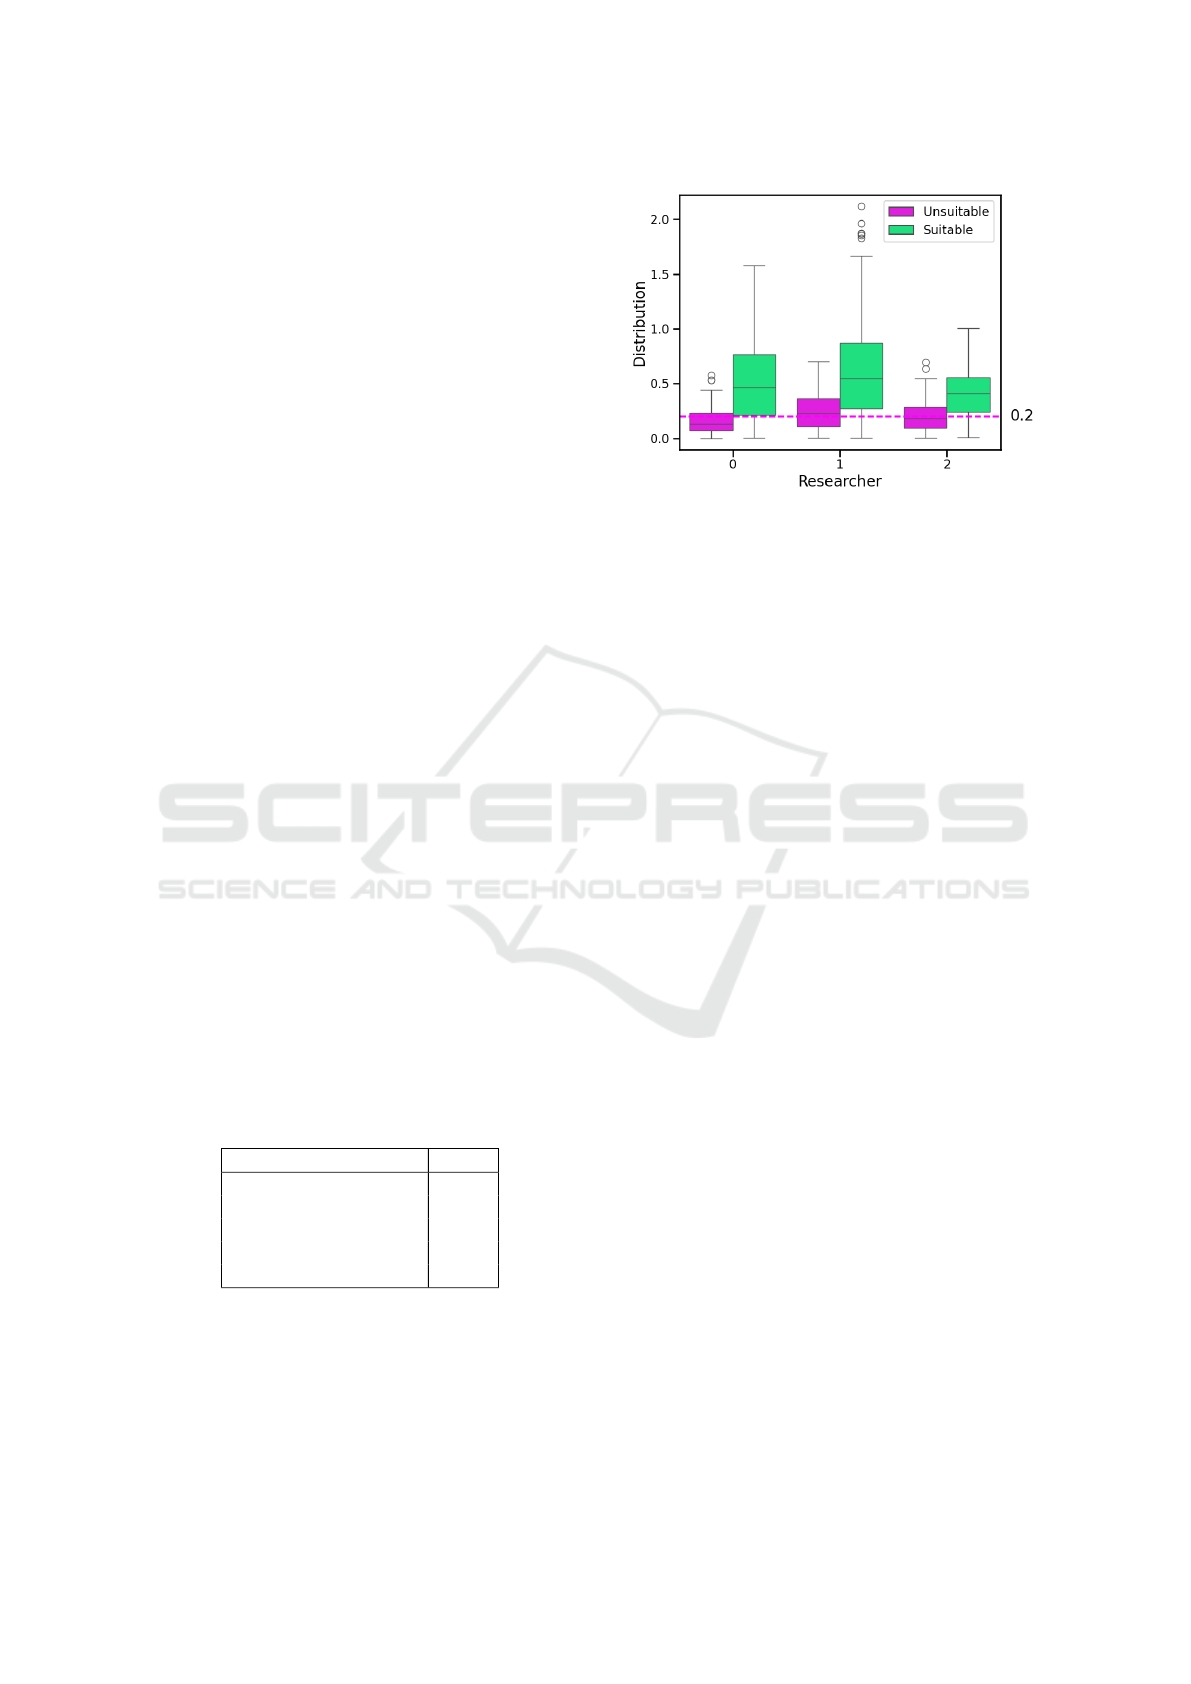
domly selected SDM attributes, by each scientist. An
overview of the distribution of score values for the
three scientists and their ratings is provided in Fig-
ure 4. It can be seen that for each of the scientists,
the average score of the matching attributes is higher
than that of the mismatching attributes. The score
threshold is therefore defined as the mean value of the
LOV results classified as unsuitable. This is shown in
Figure 4 with a horizontal dashed line. Experiments
showed that increasing the threshold to 0.3 resulted
in an average −50.38% decrease in the number of re-
sults per attribute, and decreasing the threshold to 0.1
resulted in an average 195.43% increase in the num-
ber of results per attribute. Since we want to com-
pare as diverse attributes and ontologies as possible
in our study, but also do not want to create inappro-
priate associations between attributes and ontologies,
the value 0.2 is considered a suitable average.
To better visualise the importance of individual
nodes in a graph and the weight of edges, the size
of nodes is determined by the degree and the thick-
ness of edges is determined by the weight of the edge.
For visualisation, the ForceAtlas2 algorithm (Jacomy
et al., 2014) was used in Gephi to determine the layout
for each graph with the following parameters:
Table 1: Gephi for Graph layout. The rest of the parameters
was not changed from the default value.
Parameter Value
Scaling 2
Gravity 1
LinLog mode True
Prevent Overlap True
Edge Weight Influence 3
5 RESULTS
The semantic and ontological landscape is evaluated
using two different methods. Firstly, classical meth-
Figure 4: Overview of the distribution of the value score
based on the assessments of the three scientists whether a
LOV result fits the requested SDM attribute or not. For each
scientist there are two distributions describing the scores of
the ”Suitable” and ”Unsuitable” results. The dashed line
shows the mean score (0.2) of ”Unsuitable” for all three
scientists.
ods of descriptive statistics are used to organise and
summarise the available results. On the other hand,
methods of graph analysis and visualizations are used
to gain a better understanding of the relationships
within the landscape and to detect patterns.
Figure 5 shows an overview of the number of re-
sults returned by the LOV API for each attribute (I)
and the number of times that an ontology contains a
property or class that matches the requested attribute
with a score greater than 0.2 (II). In I it can be seen
that there is a power-law-like distribution in the num-
ber of results for the SDM attributes. Thus, there
are many attributes that find only a few matching on-
tology properties or classes, and few attributes that
match very many properties and classes from differ-
ent ontologies. The attribute ”a” gets the most results
with 44.873. 417 attributes have only one result. Sub-
figure II shows the matching of the 828 ontologies to
the queried attributes. There are ontologies that are
not used at all, as well as ontologies that match many
different attributes from different domains. On aver-
age, an ontology is used 62 times - the median is 22.
Figure 6 shows that there are ontologies that are
strongly correlated with each other and therefore con-
tain properties or classes that belong to the same SDM
attribute. Similarly, there are ontologies that are com-
pletely disjoint and have no overlap at all. We as-
sume that each of the ontologies was developed for a
specific purpose or domain. Therefore, with respect
to correlation, it is expected that ontologies from the
same domain / for the same application are more cor-
related than ontologies from different domains / for
ICAART 2024 - 16th International Conference on Agents and Artificial Intelligence
304
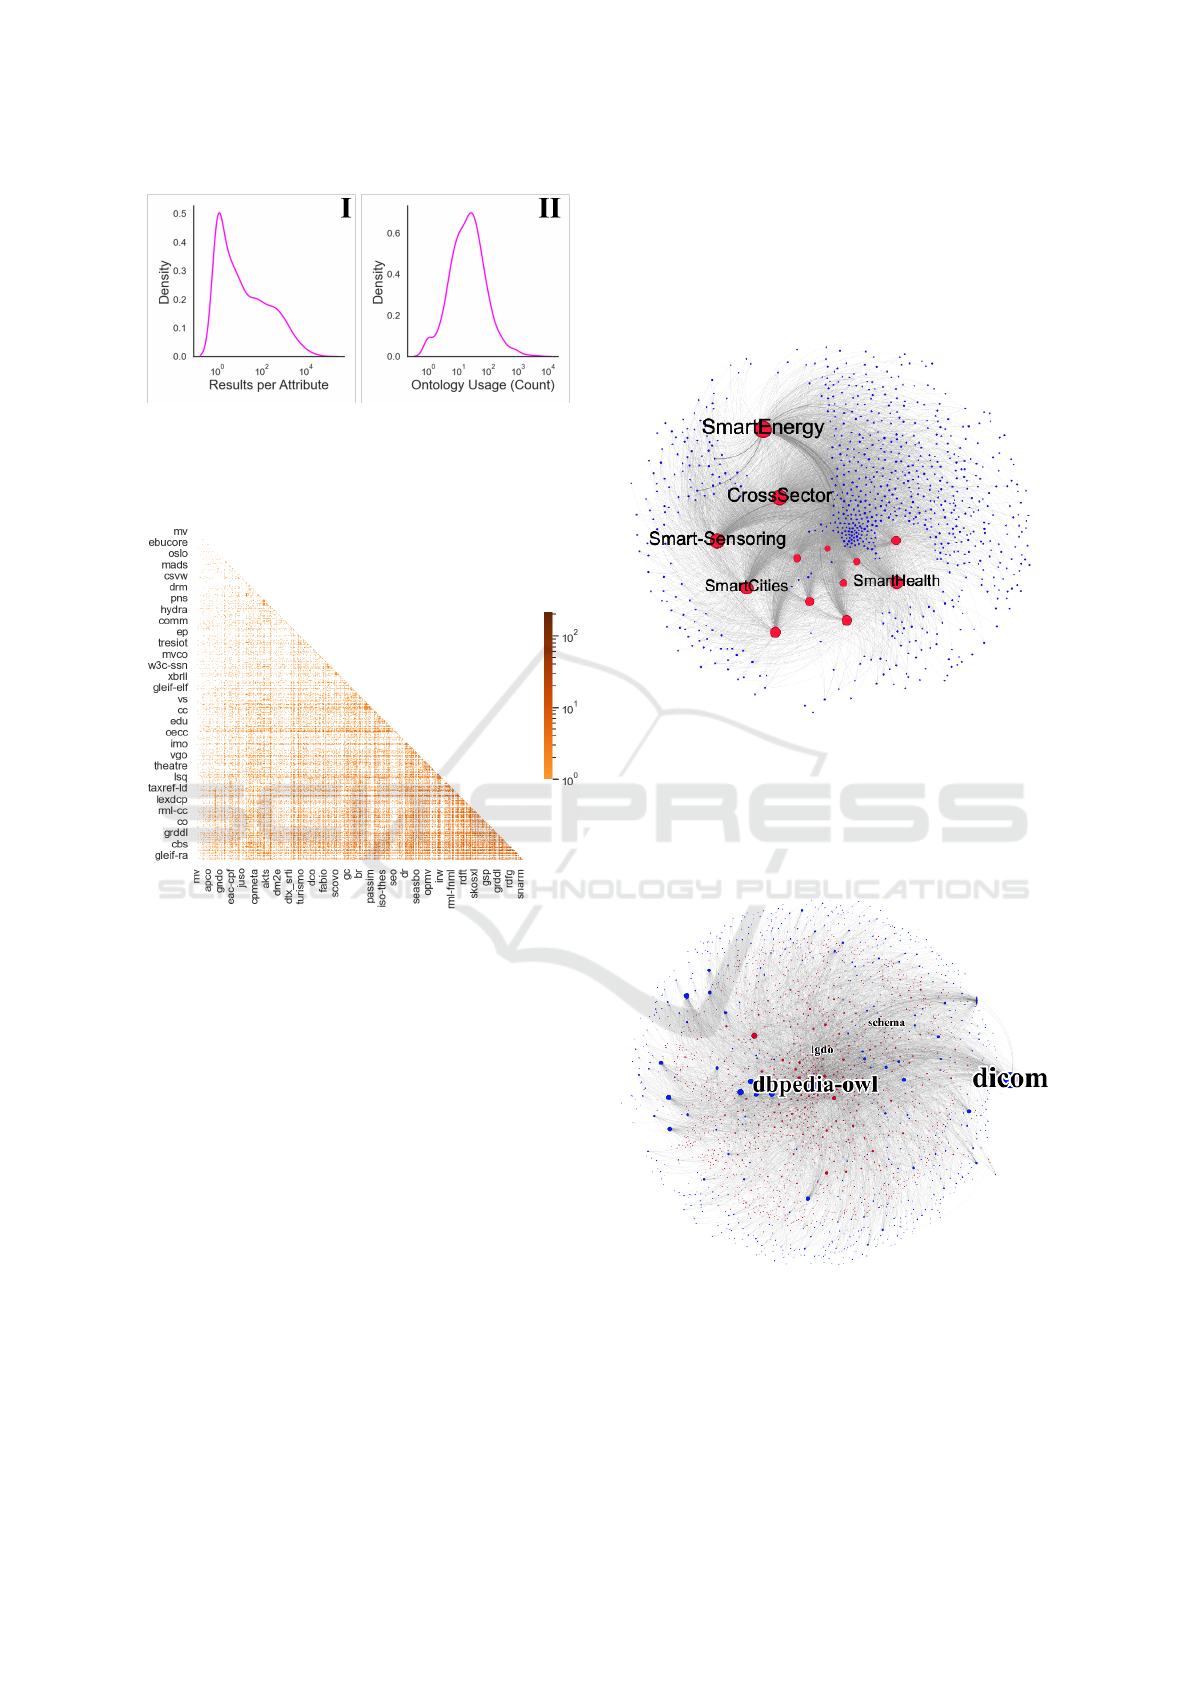
Figure 5: I: Distribution of the results per attribute (SDM)
retrieved from the LOV-API. II: Distribution of the ontology
usage. The higher the density, the more often the ontology
contains a matching property or class for the requested at-
tribute. Both figures have a logarithmic X-axis.
Figure 6: Correlation heat map of ontologies. The color
scale shows the strength of the correlation with logarythmic
scale. For representation reasons, not every one of the 828
ontologies can be mapped on the X and Y axes.
different application. The domain associated with the
SDM attribute is included in associated domain is in-
cluded in Figure 7. It can be seen that the attributes
from the 13 domains of the SDM are used with differ-
ent frequency. Domains such as SmartEnergy (644),
CrossSector (573) and SmartSensoring (553) have a
higher degree than SmartRobotics (256), SmartAero-
nautics (236) or SmartManufacturing (232). There
are 131 attributes associated with all domains and
therefore an appropriate property/class has been as-
signed in each domain. Regarding the position of
each node, it can be seen that the node of the Cross-
Sector domain is located near the center of the graph.
The SDM attributes that can be used in different do-
mains are grouped together in this domain. Ontolo-
gies with a low degree (0− 4) tend to be located at the
edge of the graph, while ontologies with a high degree
(8 − 13) are oriented towards the center of the graph.
Similarly, ontologies that have edges to multiple do-
mains settle between these domains depending on the
weights of the edges. The arrangement of the domains
with respect to each other cannot be evaluated here,
since there are no direct connections between the do-
mains, but only via the individual ontologies.
Figure 7: Visualization of the graph structure showing the
usage of attributes from the 13 domains of the SDM. The
red nodes show the domains and the blue nodes show the
ontologies. The size of the nodes is relative to their degree.
Edges between nodes with a high weight have a thicker edge
than edges with a low weight. The five nodes with the high-
est degree have a label.
Figure 8: Graph structure showing the dependencies of the
attributes (red) on the ontologies (blue). The size of the
nodes is relative to the degree. Edges between nodes with
a high weight have a thicker edge than edges with a low
weight. The four nodes with the highest degree are labelled
in green (three ontologies and one attribute).
Figure 8 shows the relationships between the SDM
Why an Automated, Scalable and Resilient Service for Semantic Interoperability is Needed
305

attributes and the LOV ontologies. It can be observed
that some ontologies have links to many attributes.
Similarly, we can observe that there are some at-
tributes that match properties and classes from many
different ontologies, although the clear majority of at-
tributes have a low degree. The ontology with the
highest degree is ”dicom” with 337. The edge with
the highest weight (825) is between the nodes ”p6”
and ”rdau”. Although the ontology ”dicom” has
the highest degree, the ontology ”dbpedia-owl” is in
the centre of the graph. This is because ”dbpedia-
owl” is a very general ontology and matches many at-
tributes from different domains. Interestingly, in sev-
eral cases, ontologies with a relatively high degree are
also positioned at the edge of the graph. One would
expect higher degree ontologies to be more centred
in the graph. The reason for this is that these ontolo-
gies have many connections to attributes that have few
connections to the high degree ontologies in the centre
of the graph (cf. ”dbpedia-owl”) and many connec-
tions to smaller ontologies at the edge of the graph.
Overall, it can be summarized that not only are
there different amounts of suitable classes and proper-
ties for different attributes in different ontologies from
different contexts, but also the ontologies themselves
often contain overlapping attributes and classes with
other ontologies. Practitioners therefore have prob-
lems in the current semantic landscape to pick the
most suitable properties and classes from the most
suitable ontology out of the multitude of possibilities.
Similarly, there is currently no broad consensus on
ontology standards in different domains.
6 DISCUSSION AND
CONCLUSION
In this work, a large dataset of high-value data
attributes (SDMs) from industry and 828 high-
value ontologies were used to describe the seman-
tic/ontological landscape. By analyzing the connec-
tions and dependencies between ontologies from dif-
ferent domains, it was shown that it is hardly possible
for a single practitioner to choose the most appropri-
ate option from all available properties and classes.
Ontologies not only overlap to a large extent within a
domain, but in many cases they also have many com-
ponents that are described and defined in the same
or very similar way by other ontologies in other do-
mains. As long as there is no worldwide consensus on
which ontologies are used when, it can be assumed
that users will model identical or very similar data
differently due to the numerous possibilities. Exist-
ing approaches for matching ontologies try to support
users in this respect, but usually focus only on single
properties of the ontologies. To address this problem,
a holistic view of the data structure to be modeled and
the inclusion of the context in which the data was col-
lected or is used in the modeling is required. The in-
terrelationships shown, the different orientations and
the heterogeneous degree of domain/application spec-
ification of the ontologies clearly show the need for
new approaches, methods and services to achieve se-
mantic interoperability.
Although the database is very large, it cannot be
excluded that important ontologies for individual do-
mains have been excluded. It should also be noted
that both the SDM domains and the ontologies vary
in size. Therefore, large ontologies with many prop-
erties and classes are more likely to match a partic-
ular attribute than small, highly domain-specific on-
tologies. The presented approach to determine the
threshold of the score (see Section 4.2 has been de-
termined by three researchers, but of course may be
inappropriate for specific applications. In addition,
no analyses were performed on more complex graph
properties such as communities. Similarly, the graph
structure provides an ideal foundation for further sup-
port of other ontologies and attributes. We encourage
researchers to pursue these questions and further de-
velop the existing code base.
REFERENCES
Ardjani, F., Bouchiha, D., and Malki, M. (2015). Ontology-
Alignment Techniques: Survey and Analysis. Inter-
national Journal of Modern Education and Computer
Science, 7(11):67–78.
Bento, A., Zouaq, A., and Gagnon, M. (2020). Ontology
Matching Using Convolutional Neural Networks.
Boukhers, Z., Lange, C., and Beyan, O. (2023). Enhanc-
ing Data Space Semantic Interoperability through Ma-
chine Learning: A Visionary Perspective. In Compan-
ion Proceedings of the ACM Web Conference 2023,
pages 1462–1467, Austin TX USA. ACM.
Davies, J., Welch, J., Milward, D., and Harris, S. (2020). A
formal, scalable approach to semantic interoperability.
Science of Computer Programming, 192:102426.
De Nooy, W. (2009). Social Network Analysis, Graph The-
oretical Approaches to. In Meyers, R. A., editor, En-
cyclopedia of Complexity and Systems Science, pages
8231–8245. Springer New York, New York, NY.
Doan, A., Madhavan, J., Domingos, P., and Halevy, A.
(2004). Ontology Matching: A Machine Learning Ap-
proach. In Staab, S. and Studer, R., editors, Handbook
on Ontologies, pages 385–403. Springer Berlin Hei-
delberg, Berlin, Heidelberg.
Euzenat, J., Bach, T. L., Barrasa, J., Bo, J. D., Brussels,
VU., Dieng, R., Ehrig, M., Hauswirth, M., Lara, R.,
ICAART 2024 - 16th International Conference on Agents and Artificial Intelligence
306

Innsbruck, U., Maynard, D., Napoli, A., Stamou, G.,
Shvaiko, P., Trento, U., Bolzano, FU., Acker, S. V.,
Brussels, VU., and Zaihrayeu, I. (2004). D2.2.3: State
of the art on ontology alignment.
Euzenat, J. and Shvaiko, P. (2013). Ontology Matching.
Springer Berlin Heidelberg, Berlin, Heidelberg.
Iyer, V., Agarwal, A., and Kumar, H. (2020). VeeAlign:
A Supervised Deep Learning Approach to Ontology
Alignment.
Jabbar, S., Ullah, F., Khalid, S., Khan, M., and Han, K.
(2017). Semantic Interoperability in Heterogeneous
IoT Infrastructure for Healthcare. Wireless Communi-
cations and Mobile Computing, 2017:1–10.
Jacomy, M., Venturini, T., Heymann, S., and Bastian, M.
(2014). ForceAtlas2, a Continuous Graph Layout Al-
gorithm for Handy Network Visualization Designed
for the Gephi Software. PLoS ONE, 9(6):e98679.
Khoudja, M. A., Fareh, M., and Bouarfa, H. (2018). On-
tology Matching using Neural Networks: Survey and
Analysis. In 2018 International Conference on Ap-
plied Smart Systems (ICASS), pages 1–6, Medea, Al-
geria. IEEE.
Liu, X., Tong, Q., Liu, X., and Qin, Z. (2021). Ontology
Matching: State of the Art, Future Challenges, and
Thinking Based on Utilized Information. IEEE Ac-
cess, 9:91235–91243.
Martino, F. and Spoto, A. (2006). Social Network Analysis:
A brief theoretical review and further perspectives in
the study of Information Technology. PsychNology
Journal, 4:53–86.
Nejhadi, A. H., Shadgar, B., and Osareh, A. (2011). Ontol-
ogy Alignment Using Machine Learning Techniques.
International Journal of Computer Science and Infor-
mation Technology, 3(2):139–150.
Otero-Cerdeira, L., Rodr
´
ıguez-Mart
´
ınez, F. J., and G
´
omez-
Rodr
´
ıguez, A. (2015). Ontology matching: A lit-
erature review. Expert Systems with Applications,
42(2):949–971.
Predoiu, L. (2006). D4.2.2 state-of-the-art survey on ontol-
ogy merging and aligning V2.
Shenoy, K. M., Shet, K. C., and Acharya, U. D. (2013). Se-
cured Ontology Matching Using Graph Matching. In
Meghanathan, N., Nagamalai, D., and Chaki, N., edi-
tors, Advances in Computing and Information Tech-
nology, volume 177, pages 11–18. Springer Berlin
Heidelberg, Berlin, Heidelberg.
Sousa, R. T., Silva, S., and Pesquita, C. (2022). The Super-
vised Semantic Similarity Toolkit. In Groth, P., Rula,
A., Schneider, J., Tiddi, I., Simperl, E., Alexopoulos,
P., Hoekstra, R., Alam, M., Dimou, A., and Tamper,
M., editors, The Semantic Web: ESWC 2022 Satellite
Events, volume 13384, pages 42–46. Springer Inter-
national Publishing, Cham.
St
¨
abler, M., K
¨
oster, F., and Schlueter-Langdon, C. Towards
solving ontological dissonance using network graphs.
AMCIS 2023 Proceedings, 1.
Uschold, M. and Gruninger, M. (2004). Ontologies and
semantics for seamless connectivity. ACM SIGMOD
Record, 33(4):58–64.
Vandenbussche, P.-Y., Atemezing, G. A., Poveda-Villal
´
on,
M., and Vatant, B. (2016). Linked Open Vocabularies
(LOV): A gateway to reusable semantic vocabularies
on the Web. Semantic Web, 8(3):437–452.
Why an Automated, Scalable and Resilient Service for Semantic Interoperability is Needed
307
