
Machine Learning-Based Disease Severity Prediction in Sickle Cell
Patients: Spectroscopic Insights
Sumit Kumar Roy, Saurabh Gupta and Pankaj Jain
Department of Biomedical Engineering, National Institute of Technology Raipur, Raipur, Chhattisgarh, India
Keywords:
Sickle Cell Disease, Sickle Cell Anemia, High Performance Liquid Chromatography, Artificial Intelligence,
Machine Learning, Spectroscopy.
Abstract:
Sickle cell disease (SCD) presents a significant health challenge with diverse clinical manifestations. Early
and accurate prediction of the onset and severity of co-morbidities in SCD is vital for improving outcomes.
In this study, we employ advanced healthcare informatics, and machine learning techniques to analyze lon-
gitudinal blood pathology data. By focusing on crucial hematological parameters, we gain valuable insights
into SCD’s pathophysiology. Additionally, incorporating spectroscopic insights into the study unveils molec-
ular details, enriching the understanding of the disease’s complexity and paving the way for more nuanced
and targeted interventions. Utilizing this data, we construct predictive models enabling personalized interven-
tions and advancing precision healthcare management. The research revealed that Random Forest outperforms
other algorithms, achieving an accuracy of 88%, recall of 82%, and specificity of 92%. This robust evaluation
underscores the model’s reliability in predicting both positive and negative instances. These findings offer a
promising pathway for enhancing disease prediction, management, and treatment planning, providing invalu-
able guidance for clinical practice in the context of sickle cell disease.
1 INTRODUCTION
Predicting the onset and severity of co-morbidities in
patients with sickle cell disease (SCD) is a paramount
challenge, underpinned by the potential to enhance
precision medicine and optimize patient outcomes.
SCD, an autosomal recessive monogenic disorder
characterized by specific mutations in the β-globin
gene, engenders the polymerization of abnormal
hemoglobin S (HbS) molecules, ultimately inducing
sickling in red blood cells (RBCs) (Kato et al., 2018),
(Dheyab et al., 2020).
The pathophysiological underpinnings of this dis-
order entail pronounced hematological perturbations,
including alterations in hemoglobin concentration
(Hb), reticulocyte count (RC), hematocrit (Hct), and
red blood cell indices (Kato et al., 2018), (Dheyab
et al., 2020). As SCD affects millions worldwide,
the spectrum of clinical manifestations exhibits sub-
stantial heterogeneity that is significantly modulated
by dynamic variations within these hematological pa-
rameters such as iron deficiency over time (Liu et al.,
2021), (da Silva et al., 2020) . In the contemporary
landscape of advanced healthcare informatics, Spec-
troscopy, and machine learning (ML), the systematic
exploration of longitudinal blood pathology data en-
ables the formulation of quantitative models for pre-
dictive analytics, thereby advancing the precision of
healthcare for SCD patients (Elsabagh et al., 2023),
(Farota et al., 2022).
Hb, is a crucial indicator of anemia severity in
SCD patients. Levels below 11.0 g/dL signify ane-
mia. RC, a fraction of circulating RBCs, reflects ery-
thropoietic activity and hemolysis. Hct, representing
the percentage of RBCs in total blood volume (38%
to 52% norm), provides insights into anemia. Utiliz-
ing advanced computational methods, the analysis of
hemoglobin dynamics assists in forecasting the onset
and intensity of anemia in SCD patients (Kato et al.,
2018). By applying these techniques to RC data, pre-
dictive models are crafted to assess the risk of acute
anemia events (Dheyab et al., 2020), (Elsabagh et al.,
2023). Additionally, ML models, which capture Hct
trends, provide insights into the trajectory of anemia
(Elsabagh et al., 2023).
RBCs indices like mean corpuscular volume
(MCV), mean corpuscular hemoglobin (MCH),
and mean corpuscular hemoglobin concentration
(MCHC) indicate RBC size and hemoglobin con-
tent. ML techniques can decode various blood in-
Roy, S., Gupta, S. and Jain, P.
Machine Learning-Based Disease Severity Prediction in Sickle Cell Patients: Spectroscopic Insights.
DOI: 10.5220/0012343800003651
Paper published under CC license (CC BY-NC-ND 4.0)
In Proceedings of the 12th Inter national Conference on Photonics, Optics and Laser Technology (PHOTOPTICS 2024), pages 51-56
ISBN: 978-989-758-686-6; ISSN: 2184-4364
Proceedings Copyright © 2024 by SCITEPRESS – Science and Technology Publications, Lda.
51
dices, offering valuable predictions about the evolv-
ing pathology, disease manifestations, and complica-
tions in SCD (Elsabagh et al., 2023), (Farota et al.,
2022).
Advanced computational tools, including deep
neural networks and ensemble methods, offer
quantitatively-driven insights into the progression and
risks of SCD-related complications based on longitu-
dinal blood pathology data. These models operate by
recognizing complex patterns in the temporal evolu-
tion of hematological parameters, ultimately enabling
the timely and targeted implementation of individu-
alized interventions (Elsabagh et al., 2023), (Farota
et al., 2022), (Gollapalli et al., 2022).
In the realm of related research, Farota et al. intro-
duced a predictive model that combines five classifi-
cation algorithms, including AdaBoost, Logistic Re-
gression, Support Vector Machine (SVM), k-nearest
neighbors (KNN), and Random Forest (RF). Their
evaluation showcased high accuracy, particularly 1
for SVM, RF, and 0.95 for Logistic Regression. No-
tably, all classifiers, except K-NN, exhibited an AUC
close to 1, emphasizing the robustness of their predic-
tive capabilities (Elsabagh et al., 2023), (Farota et al.,
2022). In a similar vein, Gollapalli et al. developed a
data-driven machine learning model based on hospi-
tal data from clinical SCD patients. They revealed
that acute chest syndrome encompasses symptoms
such as chest pain, coughing, high fever, hypoxia, and
lung infiltrates, often resulting from sickling in the
lungs tiny blood vessels, causing pulmonary infarc-
tion. Their research indicated that SCD patients with
acute chest pain typically require hospitalization for 3
to 14 days (Farota et al., 2022).
Meanwhile, Liu et al. presents a microfluidic-
based approach with on-chip gas control for the
impedance spectroscopy of suspended cells within the
frequency range of 40 Hz to 110 MHz. A compre-
hensive bioimpedance of sickle cells under both nor-
moxia and hypoxia is achieved rapidly (within 7 min)
and is appropriated by small sample volumes (2.5 µL)
(Liu et al., 2021). Roy et al. proposed a method using
blood smear images to predict the percentage of sick-
ling and establish a form factor of 1.81. Their study
utilized data from blood smears of diseased patients
obtained from a medical center (Sumit Kumar Roy
and Tyagi, 2020).
This work embarks on a quantitative journey into
the predictive power of different ML techniques,
driven by longitudinal blood pathology data, in an-
ticipating the emergence and severity of diverse dis-
eases or co-morbidities in SCD patients. A multi-
disciplinary assembly of experts in hematology, data
science, and clinical research collaborates to unravel
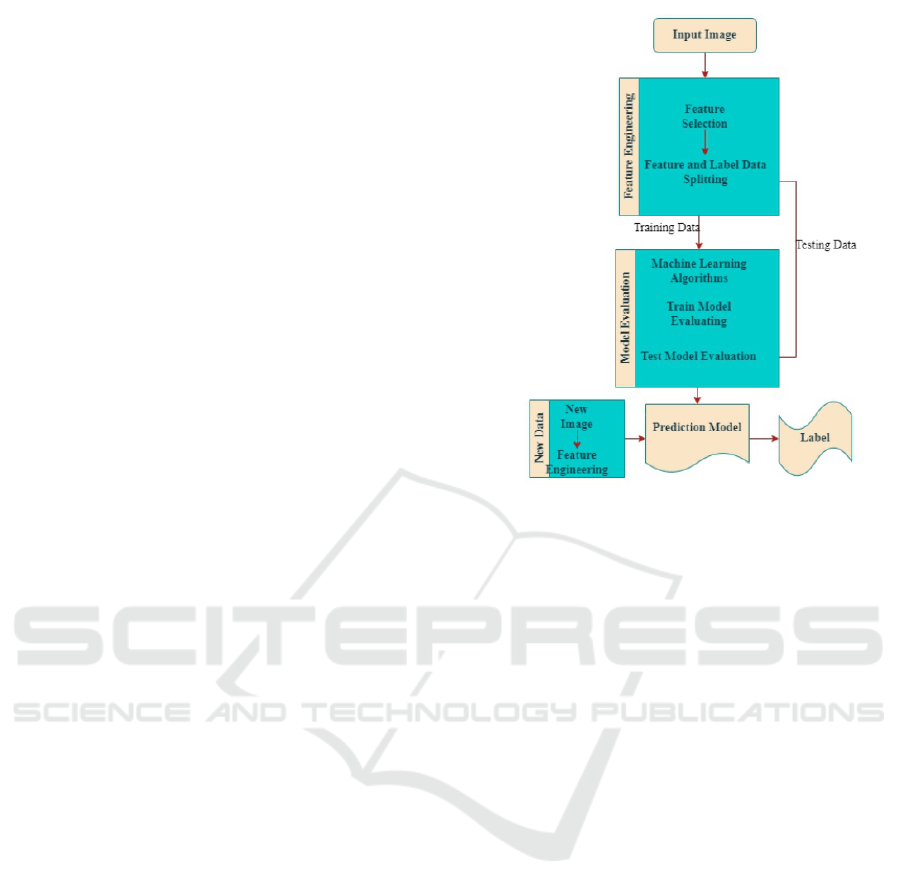
Figure 1: Process flow of the work.
the intricate relationships between these parameters
and disease outcomes, aiming to articulate quantita-
tive challenges and propose innovative methodolo-
gies. The quantitative insights generated from this
research hold the potential to revolutionize the man-
agement of SCD, facilitating precise, data-informed
healthcare strategies that improve patient outcomes.
2 MATERIALS AND METHODS
2.1 Methodology
Our approach follows a systematic procedure for clas-
sification of severity of diseases in Sickle cell dis-
ease (SCD) patients, commencing with data collec-
tion and meticulous pre-processing to guarantee data
quality. Subsequently, we engage in feature engineer-
ing to select the most informative and pertinent fea-
tures, thereby enabling the machine learning model
to learn effectively and yield precise predictions. Fol-
lowing this, we partition the data into training and
testing sets to facilitate the training and evaluation of
the selected machine learning algorithms. If the al-
gorithms’ performance falls short of acceptable crite-
ria, they undergo fine-tuning and retraining until they
meet the desired performance benchmarks. Finally,
the trained algorithms are deployed and used to pre-
dict outcomes on new data (Elsabagh et al., 2023),
(Farota et al., 2022). The process flow is illustrated in
Figure 1 (Jain and Gupta, 2023).
PHOTOPTICS 2024 - 12th International Conference on Photonics, Optics and Laser Technology
52

2.2 Dataset Preparation
The research employed a SCD dataset sourced from
the Sickle Cell Institute Chhattisgarh, Raipur, com-
prising information from 63 Sickle Cell patients. In
order to evaluate the ML models’ performance in pre-
dicting the severity of SCD in patients, the dataset in-
cludes a range of parameters such as patient names,
ages, appointment dates, and a range of hemato-
logical indicators: Hemoglobin (HGB), Red Blood
Cells (RBC), Hematocrit (HCT), Mean Corpuscu-
lar Volume (MCV), Mean Corpuscular Hemoglobin
(MCH), Mean Corpuscular Hemoglobin Concen-
tration (MCHC), Red Cell Distribution Width-CV
(RDW-CV), Red Cell Distribution Width-SD (RDW-
SD), White Blood Cells (WBC), Neutrophil Count
(Neut#), Lymphocyte Count (Ly#), Mid-cell Count
(Mid#), Neutrophil Percentage (Neut%), Lympho-
cyte Percentage (Ly%), Mid-cell Percentage (Mid%),
Platelet Count (PLT), Mean Platelet Volume (MPV),
Platelet Distribution Width (PDW), Platelet Crit
(PCT), and Platelet Large Cell Ratio (PLCR) (Dheyab
et al., 2020), (Liu et al., 2021). The research
also gathered absorbance spectra data from absorp-
tion spectroscopy encompassing positive samples as
well as negative samples within the wavelength range
spanning from 395 nm to 750 nm. Subsequent re-
finement of the data involved concentrating on ab-
sorbance spectra specifically between 400 nm and 600
nm, ultimately forming the dataset (Srivastava et al.,
2021).
2.3 Feature Engineering
In the study, various parameters from the SCD dataset
were employed as features to extract meaningful in-
formation, and enhance the effectiveness of ML al-
gorithms by accurately representing the data. Uti-
lizing a variety of features bolstered the outcomes
and efficiency of our ML system. This method not
only streamlines computational processes but also en-
riches the interpretability of ML algorithms by en-
compassing diverse facets of sickle cell data. More-
over, it guards against overfitting, enhancing the ac-
curacy and reliability of our models and resulting in
more dependable and broadly applicable predictions
(Das et al., 2019).
To ascertain the most crucial features, the study
incorporated six essential parameters including HGB,
RBC, HCT, MCV, WBC, and PLT. For the remain-
ing features, the ANOVA method was applied, allow-
ing for both dimensionality reduction and the selec-
tion of the most informative features. These chosen
features were then divided into two datasets using K-
fold cross-validation with a value of K=5. This cross-
validation technique guaranteed rigorous evaluation
by iteratively partitioning the data into training and
testing sets (Elsabagh et al., 2023), (Das et al., 2019).
The training dataset was employed to instruct the
ML model, allowing it to grasp the underlying data
patterns, while the independent testing dataset was
used to assess the model’s performance and gauge its
predictive accuracy. This meticulous approach guar-
anteed a dependable evaluation of the ML model’s ef-
ficacy in predicting outcomes (Das et al., 2019), (Wa-
hed et al., 2022).
2.4 Machine Learning Algorithms
Machine learning has transformed numerous fields
by harnessing its ability to autonomously learn from
historical data and make predictions, eliminating the
need for explicit programming. Its integration into
medical applications has led to significant advance-
ments in disease diagnosis, treatment planning, and
drug development. Machine learning algorithms are
broadly categorized into supervised learning and un-
supervised learning (Khalaf et al., 2017), (Das et al.,
2019), (Wahed et al., 2022).
In this work, study focused on 5 different SL al-
gorithms, namely: Random Forest (RF), Linear Sup-
port Vector Machine (LSVM), Radial Support Vector
Machine (RSVM), Polynomial Support Vector Ma-
chine (PSVM), and Sigmoid Support Vector Machine
(SSVM) (Wahed et al., 2022), (Saturi, 2023). The
use of these algorithms provides a structured frame-
work for predicting disease severity or co-morbidities
in SCP, utilizing labeled data to train and evaluate the
models.
Support vector machines serve as robust super-
vised learning tools, excelling in classification, re-
gression, and outlier detection. They thrive in high-
dimensional spaces, offer adaptability with diverse
kernels, and optimize memory usage through sup-
port vectors (Liu et al., 2021), (Wahed et al., 2022).
A Decision Tree resembles a tree-shaped flowchart,
dividing training data into smaller subgroups, with
each subgroup marked by a class label on the termi-
nal node. Random Forest constructs decision trees
based on input data, evaluates multiple trees, and se-
lects the best solution through voting. This method
enables us to fully leverage the potential of ML, of-
fering accurate and reliable predictions for disease
severity. These outcomes contribute significantly to
the progress in medical research and clinical practice.
Machine Learning-Based Disease Severity Prediction in Sickle Cell Patients: Spectroscopic Insights
53
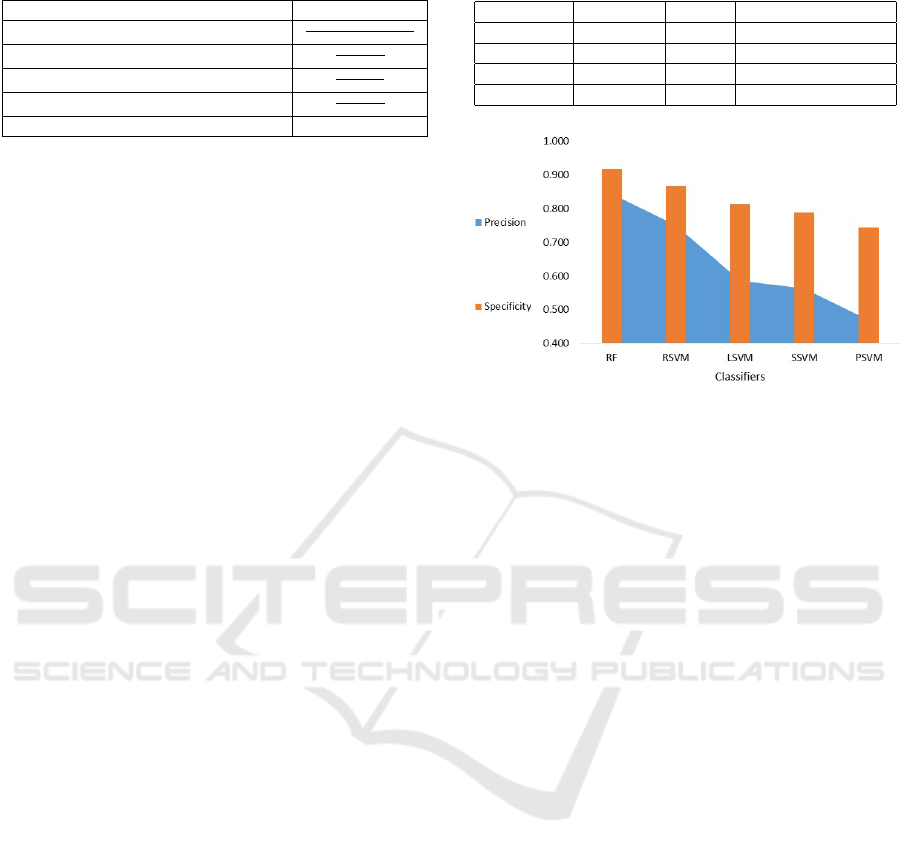
Table 1: Evaluation metrics of our mode.
Metrices Methods
Accuracy
tsP+tsN
tsP+tsN+ fsP+ f sN
Recall
tsP
tsP+ f sN
Precision
tsP
tsP+ f sP
Specificity
tsN
tsN+ f sP
Classification Error or Error sample rate 1- Accuracy
2.5 Performance Metrics
Table 1 presents the evaluation metrics (accuracy, re-
call, precision, specificity, and classification error)
employed to assess our predictive models. These
metrics are exclusively evaluated on the entire test
dataset. The parameters tsP, tsN, fsP, and fsN rep-
resent true positive, true negative, false positive, and
false negative, derived from the confusion matrix
(Jain and Gupta, 2023).
3 RESULTS AND DISCUSSION
In this study, data from 63 Sickle cell disease (SCD)
patients was categorized into three classes of disease
severity (0 = not severe, 1 = severe and 2 = high se-
vere). The effectiveness of each machine learning
model was assessed through a series of experiments
aimed at predicting disease severity in these patients.
The classification process encompasses four key
phases as shown in figure1. In the initial data prepa-
ration phase, a comprehensive dataset was created,
including all features previously discussed. Subse-
quently, feature selection was applied to this dataset,
incorporating six essential parameters, while the re-
maining features were evaluated using ANOVA. This
process resulted in the selection of the 12 most rele-
vant features, forming a new feature dataset.
Machine learning algorithms were then trained us-
ing this new feature dataset to build a disease detec-
tion classifier. The study utilized Random Forest, Lin-
ear Support Vector Machine, Radial Support Vector
Machine, Polynomial Support Vector Machine, and
Sigmoid Support Vector Machine. The effectiveness
of each predictive machine learning model for disease
severity was evaluated within relevant contexts.
Using 5-Fold Cross-Validation, which system-
atically divides the feature dataset into five non-
overlapping subsets, the classifiers were assessed. A
classifier’s efficiency heavily relies on data quality,
with its own set of advantages and limitations. Perfor-
mance measurements for machine learning efficiency
in this study encompassed the confusion matrix, ac-
curacy, recall, precision, and specificity. Additionally,
Table 2: Comparison of performance parameter.
Classifiers Accuracy Recall Classification error
RSVM 0.817 0.727 0.183
LSVM 0.742 0.586 0.258
SSVM 0.729 0.600 0.271
PSVM 0.667 0.500 0.333
Figure 2: Comparison performance of the classification
model using specificity and precision.
classification error was calculated for predictive per-
formance.
Table 2 presents a comparison of accuracy, re-
call, and classification error as performance measures
for different classifiers. Furthermore, a performance
evaluation of the classification models was conducted
based on specificity and precision, as illustrated in
Figure 2.
According to this study on multi-labeled SCD
dataset, RF results outperformed those from other
SVM classifiers, due to its aptitude for managing in-
tricate, high-dimensional datasets featuring noisy or
irregular patterns. In Figure 2 and Table 1, five clas-
sification algorithms’ performance is assessed using
various metrics. Elevated accuracy signifies strong
model performance, while high precision and re-
call values indicate the model’s appropriateness for
a particular task. High specificity values indicate
the model’s proficiency in recognizing negative in-
stances. Both RF and RSVM achieved good accuracy
(88.2 and 81.7%), precision (84 and 75%), and recall
(82 and 73%), showing their reliability in predicting
both positive and negative instances. RSVM speci-
ficity (87%) is relatively low compared to RF (92%)
because RSVM is less effective at predicting nega-
tive instances. Furthermore, RF classification error
(12%) is relatively lower than RSVM (18%), suggest-
ing that the model makes fewer mistakes in predicting
outcomes than RSVM.
RF and RSVM are high-performing classifiers,
with RF outperforming RSVM in accuracy, speci-
ficity, and classification error. All this because, RF
employs ensemble learning, uniting numerous deci-
PHOTOPTICS 2024 - 12th International Conference on Photonics, Optics and Laser Technology
54

sion trees to effectively capture intricate SCD data
relationships while minimizing over-fitting. It stands
out in handling noisy data and outliers, making it ro-
bust in real-world situations where data quality is a
concern. RF also provides valuable insights into fea-
ture importance, aiding in the identification of pivotal
variables. Additionally, its capacity for parallelization
ensures the efficient processing of sizable datasets. In
contrast, although R-SVM can handle non-linear rela-
tionships using the radial basis function, it may neces-
sitate meticulous parameter tuning and feature scal-
ing, rendering it somewhat more intricate in specific
contexts.
Also RSVM tends to outperform LSVM, PSVM,
and SSVM models due to its adeptness at manag-
ing intricate, non-linear data relationships. While
LSVM is confined to straight lines or hyper planes
for class separation, RSVM employs the radial ba-
sis function kernel, enabling it to transform data into
a higher-dimensional space. In this space, complex
non-linear relationships are more accurately captured.
Although PSVM and SSVM also employ non-linear
kernels, they often struggle with intricate data pat-
terns. RSVM, with its radial basis function kernel,
excels in scenarios where class boundaries are intri-
cate and not easily defined geometrically. Its ability
to adapt to data intricacies results in a more flexible
and accurate decision boundary.
While previous studies have made significant
strides in SCD and ML, our research introduces nov-
elty by utilizing real-time blood pathology SCD data
and diverse ML techniques. This approach is crucial
for disease severity/co-morbidities prediction, aid-
ing in diagnosis, disease monitoring, drug develop-
ment, regenerative medicine, and fundamental re-
search. The findings presented in the study also open
avenues for future research in the field of inherited
blood disorders. One potential direction involves the
exploration of advanced spectroscopic methods, with
a focus on refining techniques for real-time monitor-
ing and diagnosis which might also consider the inte-
gration of multi-omics approaches, combining spec-
troscopic insights with genomics, transcriptomics,
and metabolomics data to provide a more comprehen-
sive understanding of the molecular intricacies under-
lying these disorders.
4 CONCLUSION
This study conducted a comparative analysis of five
distinct machine learning techniques: Random Forest,
Linear Support Vector Machine, Radial Support Vec-
tor Machine, Polynomial Support Vector Machine,
and Sigmoid Support Vector Machine for classifying
disease severity in sickle cell patients. The system
predicts disease severity, guiding treatment and med-
ication dosage. Performance metrics were assessed
across all classifiers, revealing Random Forest as the
most accurate method with 88% accuracy, 82% re-
call, and 92% specificity. The study’s stability and
reliability were affirmed through performance evalua-
tion. Future work may explore more features from ad-
vanced spectroscopic methods and also deep learning
techniques for classification, contingent on obtaining
sufficient training data to harness deep learning’s full
potential.
ACKNOWLEDGEMENTS
We wish to thank the Sickle cell Institute (SCIC)
Raipur, Chhattisgarh, for providing pathology hema-
tological data to conduct this research work.
REFERENCES
da Silva, W. R., Silveira Jr, L., and Fernandes, A. B. (2020).
Diagnosing sickle cell disease and iron deficiency ane-
mia in human blood by raman spectroscopy. Lasers in
Medical Science, 35(5):1065–1074.
Das, P. K., Meher, S., Panda, R., and Abraham, A. (2019).
A review of automated methods for the detection of
sickle cell disease. IEEE reviews in biomedical engi-
neering, 13:309–324.
Dheyab, H. F., Ucan, O. N., Khalaf, M., and Mohammed,
A. H. (2020). Implementation a various types of
machine learning approaches for biomedical datasets
based on sickle cell disorder. In 2020 4th International
Symposium on Multidisciplinary Studies and Innova-
tive Technologies (ISMSIT), pages 1–6. IEEE.
Elsabagh, A., Elhadary, M., Elsayed, B., Elshoeibi, A. M.,
Ferih, K., Kaddoura, R., Alkindi, S., Alshurafa, A.,
Alrasheed, M., Alzayed, A., et al. (2023). Artificial
intelligence in sickle disease. Blood Reviews, page
101102.
Farota, S. B., Diallo, A. H., Ba, M. L., Camara, G., and
Diagne, I. (2022). An ai-based model for the predic-
tion of a newborn’s sickle cell disease status. In In-
ternational Conference on Innovations and Interdisci-
plinary Solutions for Underserved Areas, pages 96–
104. Springer.
Gollapalli, M., Alabdullatif, L., Alsuwayeh, F., Aljouali,
M., Alhunief, A., and Batook, Z. (2022). Text mining
on hospital stay durations and management of sickle
cell disease patients. In 2022 14th International Con-
ference on Computational Intelligence and Communi-
cation Networks (CICN), pages 1–6. IEEE.
Jain, P. and Gupta, S. (2023). Multi-exposure laser speckle
contrast imaging (meci)-based prediction of blood
Machine Learning-Based Disease Severity Prediction in Sickle Cell Patients: Spectroscopic Insights
55

flow using random forest (rf) with k-means (km).
Cureus, 15(6).
Kato, G. J., Piel, F. B., Reid, C. D., Gaston, M. H.,
Ohene-Frempong, K., Krishnamurti, L., Smith, W. R.,
Panepinto, J. A., Weatherall, D. J., Costa, F. F., et al.
(2018). Sickle cell disease. Nature reviews Disease
primers, 4(1):1–22.
Khalaf, M., Hussain, A. J., Keight, R., Al-Jumeily, D., Fer-
gus, P., Keenan, R., and Tso, P. (2017). Machine learn-
ing approaches to the application of disease modify-
ing therapy for sickle cell using classification models.
Neurocomputing, 228:154–164.
Liu, J., Qiang, Y., and Du, E. (2021). Dielectric spec-
troscopy of red blood cells in sickle cell disease. Elec-
trophoresis, 42(5):667–675.
Saturi, S. (2023). Review on machine learning tech-
niques for medical data classification and disease di-
agnosis. Regenerative Engineering and Translational
Medicine, 9(2):141–164.
Srivastava, S., Srinivasan, R., Nambison, N. K., Gorthi,
S. S., et al. (2021). Diagnosis of sickle cell anemia
using automl on uv-vis absorbance spectroscopy data.
arXiv preprint arXiv:2111.12711.
Sumit Kumar Roy, Hemlata Sinha, P. M. and Tyagi, D.
(2020). Poikilocyte cell detection in microscopic im-
ages of blood smears using image processing tech-
niques. International Journal on Emerging Technolo-
gies, 11(3):234–239.
Wahed, F. F., Juliette A, A., Sinthia, P., and Mary, G. (2022).
Detection of sickle cell anemia using svm classifier. In
AIP Conference Proceedings, volume 2405. AIP Pub-
lishing.
PHOTOPTICS 2024 - 12th International Conference on Photonics, Optics and Laser Technology
56
