
Decentralized Intelligence for Smart Agriculture
Pascal Francois Faye
1 a
, Jeanne Ana Awa Faye
2
and Mariane Senghor
1
1
Universit
´
e du Sine Saloum El Hadj Ibrahima NIASS (USSEIN), Sing Sing, Kaolack, Senegal
2
Universite Aix-Marseille, Institut de Management Public et Gouvernance Territoriale, Aix-Marseille, France
Keywords:
Conceptualization, Internet of Things Network, Data analysis, Artificial Intelligence, Multi-Agent System,
Crop Yield.
Abstract:
This work proposes a model called AIMS (Agricultural Information and Management System) based on some
Machine Learning Algorithm (ML) as CART (Classification And Regression Trees), KNN(K-nearest neigh-
bors) and SVM(Support Vector Machine). It describes both a multi-agent system and Internet Of Things
device that ensures data collection and control as well as a data monitoring system via our web platform for
decision-making support in a real-world agricultural environments. This for a prompt, effective and sustain-
able agricultural development. We refer to cases in which agent collaboration is needed for efficient task
execution (e. g. data processing and decision making). In our context, dynamics and uncertainty prohibit
computation strategies ahead of task execution. Combining methods from Machine Learning (ML), Markov
decision processes (MDP) and probability, we introduce an auto-stabilizing coordination mechanism.
1 INTRODUCTION
Nowadays, technical developments are very active in
the collection and data processing even in the agri-
cultural sector. This raises the question: What the
future of our countries’ agricultural sector will look
like in terms of sustainable production if informa-
tion on agricultural parameters and management, as
well as fluctuations in climatic factors, are observed
and instantly controlled. In an agricultural environ-
ment, an example may be to have tools to predict
and improve the crop yield by taking into account,
global population growth, climate change, available
resources and land degradation. There, agents are de-
ployed on various platforms such as smart farming
IOT, autonomous robots, personal devices and smart
sensors. The agents of these platforms, aim to re-
duce the arduousness of the work. Many of these
tasks require coordination as a suitable solution ap-
proach. However, the platforms and the agents, have
resource constraints (e.g., energy), unstable commu-
nication, dynamically changing, various availability
and stochastic tasks. An example of a stochastic task
in a farm may be the scheduling of the irrigation and
the temperature in order to avoid fluctuations. Some
challenges discussed above are addressed, in the lit-
erature (Shehory and Kraus, 1998) and (Faye et al.,
a
https://orcid.org/0000-0002-2078-5891
2015) and (Faye et al., 2014). However, a coordina-
tion solution that addresses well both the dynamism
and the uncertainty in environments as in the example
above is lacking. Our main contribution is a coordi-
nation mechanism that enables autostabilizing collab-
oration in dynamic, uncertain contexts. We propose
an adaptive, decentralized and asynchronous mech-
anism denoted AIMS (Agricultural Information and
Management System). The AIMS mechanism intro-
duces a novel combination of disparate techniques. In
particular, it combines:
1. laws of probability to model the dynamics of
tasks’ events and agents’ availability;
2. Machine learning algorithm (ML) to find the bet-
ter coordination, taking advantage of agent depen-
dencies and network structure;
3. MDP (Markov decision processes) formalism to
dynamically examine and adapt the agent’s be-
haviour.
This combination delivers a new solution that ad-
dresses well the dynamism and uncertainty challenges
targeted in this work. In the rest of the paper, Section
II we discuss related works. Section III presents some
preliminaries. Section IV highlight the AIMS mecha-
nism, followed by performance evaluation in Section
V. Section VI concludes.
240
Faye, P., Faye, J. and Senghor, M.
Decentralized Intelligence for Smart Agriculture.
DOI: 10.5220/0012342100003636
Paper published under CC license (CC BY-NC-ND 4.0)
In Proceedings of the 16th International Conference on Agents and Artificial Intelligence (ICAART 2024) - Volume 1, pages 240-247
ISBN: 978-989-758-680-4; ISSN: 2184-433X
Proceedings Copyright © 2024 by SCITEPRESS – Science and Technology Publications, Lda.

2 RELATED WORK
In (Sellam and Poovammal, 2010), the authors persist
to research the environmental parameters that affect
the crop yield and related parameters. Here a multi-
variate Regression Analysis is applied for the same.
A sample of environmental factors considers a period
of 10 years. The System is applied to find the rela-
tionship between explanatory variables like AR,AUC,
FPI and hence the crop yield as a response variable
and R2 value clearly shows that, the yield is espe-
ciallyhooked into AR,AUC and FPI are the opposite
two factors that are influencing the crop yield. This
research is often enhanced by considering other fac-
tors like MSP, CPI, WPI so on. And their relationship
with crop yield. In (Sellam and Poovammal, 2010),
the authors focus on the users and expert reviews
across three product categories that are sellers, prod-
ucts and experimental products were conducted. Here
the bulk of research cited attempted to finalize the
consequences of a user reviews on a product cost and
the probability of a purchage.The results of this work
help illuminate the contradictory findings across the
discrete research study. In paper (Paswan and Begum,
2013), the authors have compared feed forward neural
networks with traditional statistical methods through
linear regression. This work presents the capability
of neural networks and their statistical counterparts
used in the world of crop yield prediction. In (Zhang
et al., 2010), the authors have done the comparison
between OLS regression model and special autore-
gressive model for crop yield prediction in Iowa. The
special autoregressive model has shown enormous en-
hancement in the model performance over the OLS
model. The model can provide better prediction than
the OLS model and has capability of adjust with the
special autocorrelation, which is not considered by
the OLS model. This work has shown that NDVI
and precipitation are the most important predictors for
corn yield in Iowa. In (Zingade et al., 2018), the au-
thors have presented an android based application and
an internet site that uses Machine learning methods
to predict the foremost profitable crop in the current
weather and soil conditions and with current environ-
mental conditions. This system helps the former with
a sort of option for the crops that will be cultivated,
which will be helping them over the long run.
3 PRELIMINARIES
Many active populations around the world have taken
agriculture as a main occupation. Day by day for
a particular crop; the farmers are not getting good
yield due to environmental conditions like soil qual-
ity, weather, rainfall, drought, seed damages, fertil-
izers, pesticides, ... However, it rests traditional in
several Africans countries (lack of information, poor
time management, no forecast,...). This notwithstand-
ing, taking the historical agricultural (Faye et al.,
2022) data records we can predict the crop yield using
machine learning techniques in order to achieve the
high accuracy and model performance. To create - a
network’s agents, a set of controllers agents, a moni-
toring platform, a dynamic digital model for efficient
and sustainable agriculture, and set up distributed de-
cision making. In our context, an agent is an equip-
ment more or less autonomous, connected and able to
perform tasks. An equipment can be any IOT com-
ponent like an Arduino UNO WIFI, an ESP8266 or
ESP32-CAM, a Humidity and temperature sensors
(DHT-11, capacitive soil, soil sensor, moisture sen-
sor, ...), a Raspberry Pi 4 model B or an Agricultural
irrigation electric Pump DC 12V,3.5L.
As mentioned in figure 1 the digital plat-
forms access - Anacim : https://www.anacim.
sn/spip.php?article67 - ANSD : https://www.ansd.
sn/enquete - FAO : https://www.fao.org/aquacrop/
software/fr/ - PowerLarc : https://power.larc.nasa.
gov/data-access-viewer/ - Kaggle : https://www.
kaggle.com/datasets.
Thus, we define a set of concepts to highlight our co-
ordination model. Let A={a
1
, ...,a
n
} be a set of agents
and C a coordination schema, C={A
C
, G
C
, T
C
,V
C
}.
A
C
⊂ A and G
C
⊆ {G
a
i
: a
i
∈ A
C
} a set of agents’
goals (e.g., reliability, power supply, ...). T
C
is the set
of unpredictable evolving tasks and V
C
is the expected
payoff after execution. An unpredictable evolving
task is a set of actions, possibly changing over time
(e.g. prevent drought or rainfall damage). Coordina-
tion schema C receives a payoff V
C
such as an agent a
i
gets v
a
i
and V
C
=
∑
a
i
∈A
C
v
a
i
. Each agent aims to maxi-
mize its payoff during coordination.
Each agent a
i
is constrained by the parameters:
{R
a
i
, E
t
a
i
, Hs
a
i
, ϑ
t
a
i
,U
a
i
, L
Net
a
i
}. R
a
i
is its resource(s)
and E
t
a
i
is its energy at time t. We dissociate R
a
i
from
E
t
a
i
because we assume energy is not shareable, unlike
other resources (bandwidth, computation, ...). Hs
a
i
is its history set which consists of a set of alliances,
probable stability and reliability of a set of ally agents.
A view ϑ
t
a
i
of a
i
is the set of agents in its neighbor-
hood with whom it can directly communicate at time
t. U
a
i
is its private utility function. L
Net
a
i
defines its
dependence level in a given network (Net).
Definition 1. Al
a
i
,a
j
=({R
a
i
, R
a
j
}, {T
a
i
hel p
, T
a
j
hel p
}) is an
alliance (Al
a
i
,a
j
∈ Hs
a
i
), i.e., a persistent agreement
between agents a
i
, a
j
in which they establish mutual
commitment to provide one another with resources
Decentralized Intelligence for Smart Agriculture
241
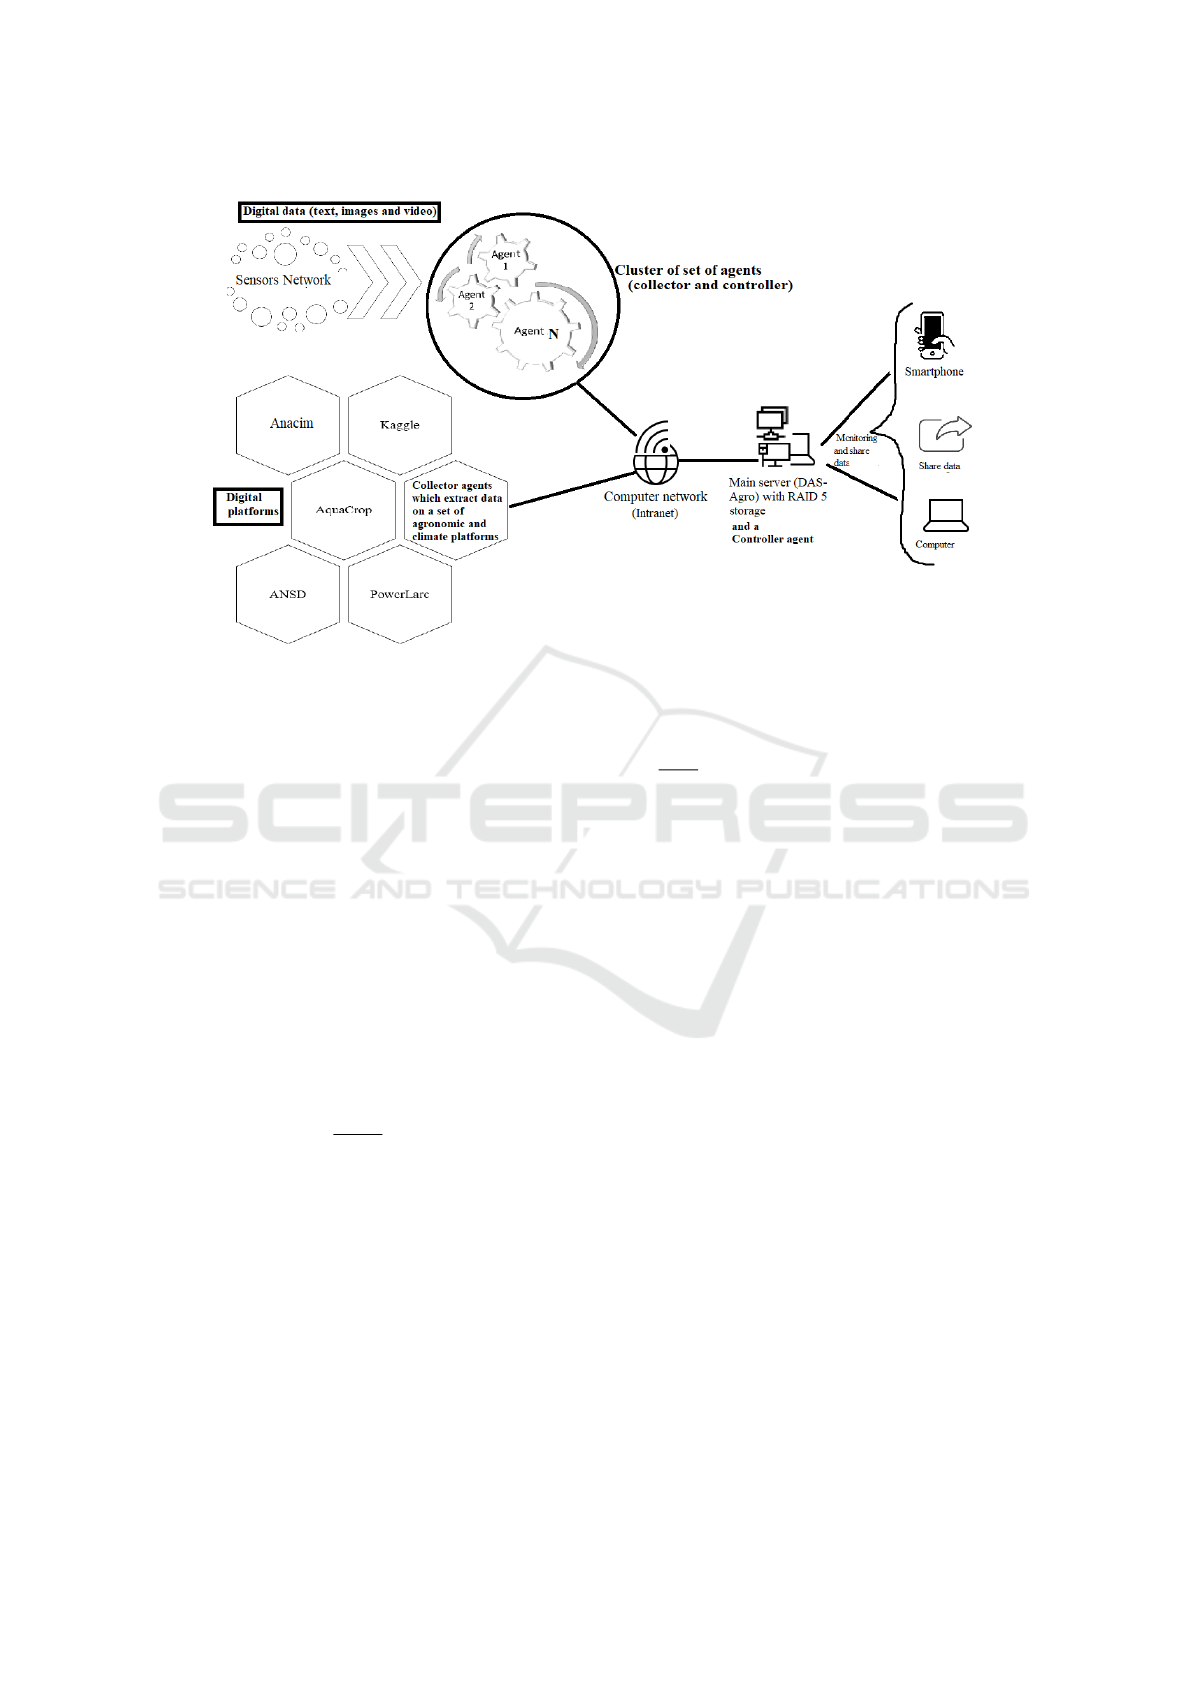
Figure 1: The main component for data collection, decisions and outputs results.
and information during a specific time period. The
alliance above specifies that a
i
(respectively a
j
) com-
mits to provide its resource R
a
i
(respectively R
a
j
) dur-
ing a time period T
a
i
hel p
(respectively T
a
j
hel p
) within a
coordination schema of a
j
(respectively a
i
).□
Alliances aim to simplify agent coordination. We
give the explanations and the enlightenment on this
matter further. An alliance is canceled by an agent if
the reliability of its ally is below some threshold. The
reliability of a
j
is computed by a
i
using the Poisson
law (Yates and Goodman, 2005). The Poisson law
expresses the prior probability of random events over
a time interval t. The random events are the number k
of times that an agent does not respect an established
alliance.
Definition 2. The reliability of an agent a
j
equals
ρ
a
j
= (
(λ
a
j
)
k
k!
)e
(−λ
a
j
)
(1)
where λ
a
j
is the withdrawal rate of a
j
from Al
a
i
,a
j
over
a time interval t.□
To enhance or conserve its reliability, a
j
∈ A, it is
in its interest to join and respect its commitments.
Definition 3. The probable stability P
a
j
s
of an agent
a
j
equals
P
a
j
s
= 1 − Q
a
j
s
(2)
where Q
a
j
s
is the probable disconnection of its host-
ing device. Q
a
j
s
is computed by using the modified
geometric distribution (Yates and Goodman, 2005)
which is the prior probability distribution when we
are interested in the probability of the first withdrawal
due to some failure. Q
a
j
s
= (q
a
j
s
)
k
(1 − q
a
j
s
) where
q
a
j
s
=
(λ
a
j
)
k
k!
e
−λ
a
j
. λ
a
j
is the arrival rate of disconnec-
tions of the device j, k the number of its disconnec-
tions since its first starting.□
A larger P
a
j
s
entails that, the device is more pre-
ferred.
Definition 4. The utility function U
a
i
of an agent a
i
is
U
a
i
=
∞
∑
C=1
u
a
i
C
(3)
where u
a
i
C
is its utility in the coordination schema C.
Knowing that, U
a
i
is the value of this utility function
at time t.□
Agents use the message sharing process in their
view ϑ
t
a
i
⊆ Net for the coordination that maximize
their utility in each of their coordination schema de-
spite the uncertainties and the dynamics of the deploy-
ment environment.
Definition 5. The utility in the coordination schema
C is for an agent a
i
as follows:
u
a
i
C
= v
a
i
−Cost
a
i
C
(4)
The cost function Cost
a
i
C
is a private knowledge and
depends on the messages cost (i.e., messages sent un-
til the establishment of C), energy and resources used,
...□
When involved in coordination, each agent a
i
∈
Net has also to consider its level of dependence L
Net
a
i
on other agents in its view ϑ
t
a
i
⊆ Net.
ICAART 2024 - 16th International Conference on Agents and Artificial Intelligence
242

Definition 6. ∀a
i
∈ Net, ∃ L
Net
a
i
such that
L
Net
a
i
= {γ
Net
a
i
, H
Net
a
i
, S
Net
a
i
} where γ
Net
a
i
is the set of con-
trollers to a
i
, S
Net
a
i
is the set of agents lead by a
i
and
H
Net
a
i
= (ϑ
t
a
i
\ γ
Net
a
i
) \ S
Net
a
i
(homologous agents).□
For example, in a farm environment a set of col-
lector agents may be under the command of a con-
troller agent, independent or allies in order to reach
a goal (data analysis, intrusion detection, irrigation
start, ...). The agents must also consider these depen-
dencies to determine their preferences and priorities
or prohibited interactions when seeking to maximize
their utility. In the following, we present our coordi-
nation schema for such contexts.
4 COORDINATION SCHEMA
Our Agricultural Information and Management Sys-
tem (AIMS) describes an automated farm manage-
ment model that starts from data collection and uses
these data obtained through our monitoring platform
(MP-Agro) and different platforms as shown in Fig-
ure 1. Our monitoring platform receives data through
a set of smart farming IOT, autonomous robots, per-
sonal devices and smart sensors. AIMS acts with two
systems.
1. A multi-agent system that has a reactive agent set.
Among them are:
• The collector agents that collect agroclimatic
data and send them to the agents that implement
the machine learning algorithms (ML) and also
to our monitoring platform (MP-Agro).
• Controllers agents that are programmed to con-
trol a set of agricultural equipment such as irri-
gation and a set of spraying based on informa-
tion obtained through the collector agents.
2. A management system that has the ability to in-
teract with the multi-agent system (data collec-
tor and equipment controller) of our AIMS. It is
an IoT web platform that allows us to aggregate,
visualize, and analyse real-time data stream from
collector agents.
In the next section we highlight our architecture.
4.1 Architecture Details
The physical topology of our deployment environ-
ment is shown in Figure 1.
• Agronomic and climatic data collector agents :
1. Send information to agent 2 after collecting and
processing the data.
2. Sends the data to our platform called MP-agro
• Equipment controller agents:
1. Switch on or not the irrigation systems or the
motion detection systems located where the
collector agents are. This depends on the mes-
sage received and ML decision result.
2. Sends a response message to the collector agent
whether or not the task is completed. For exam-
ple, if the phytosanitary treatments are carried
out.
• MP-agro
1. Distributes data in table or graph format.
2. Displays statistics of different information sent
to the platform by the collector sensors.
3. Manages crops by allowing to save information
about the date of sowing, the likely date of har-
vest, etc.
4. Manages human resources by offering the op-
portunity to add employees to dashboard and
have an overview of employees.
5. Locates all collector agents, controllers agents
and displays their positions on a map.
6. Offers the possibility to download the data
stored in the platform as a CSV file for future
data analysis.
7. Offers the possibility to download crop calen-
dars of some speculations as a PDF file.
The interactions between the set of component can
be summarised by the flowchart above (cf. Figure 2
and Figure 3).
To find the better machine learning model in order
to face with data collected can be summarised by the
flowchart above (cf. Figure 4).
We add a set of definition in order to highlight an-
alytically our coordination mechanism (AIMS).
We define O
a
i
C
as a message sharing of an agent a
i
which aims to form a coordination schema C.
Definition 7. A message sharing
O
a
i
C
={{B
i
, B
j
, B
k
, ...}, {pl
a
i
}} is such as
B
i
=(Ri, ∆i,U i). B
i
is a goal to reach with the
offer which specifies a resource Ri needed by T
C
,
the constraints ∆i of B
i
and the expected pay-off
Ui. pl
a
i
={a
i
, a
j
, a
k
, ...} is a probe list which gives
at each time the set of agents which have agreed to
participate to message sharing.□
During message sharing a set of agent may have
conflicting goals. This, because an agent have to save
energy, forward its own payload, etc.
Some Notations
≡ equivalence between two parameters.
̸≡ non equivalence between two parameters.
Decentralized Intelligence for Smart Agriculture
243
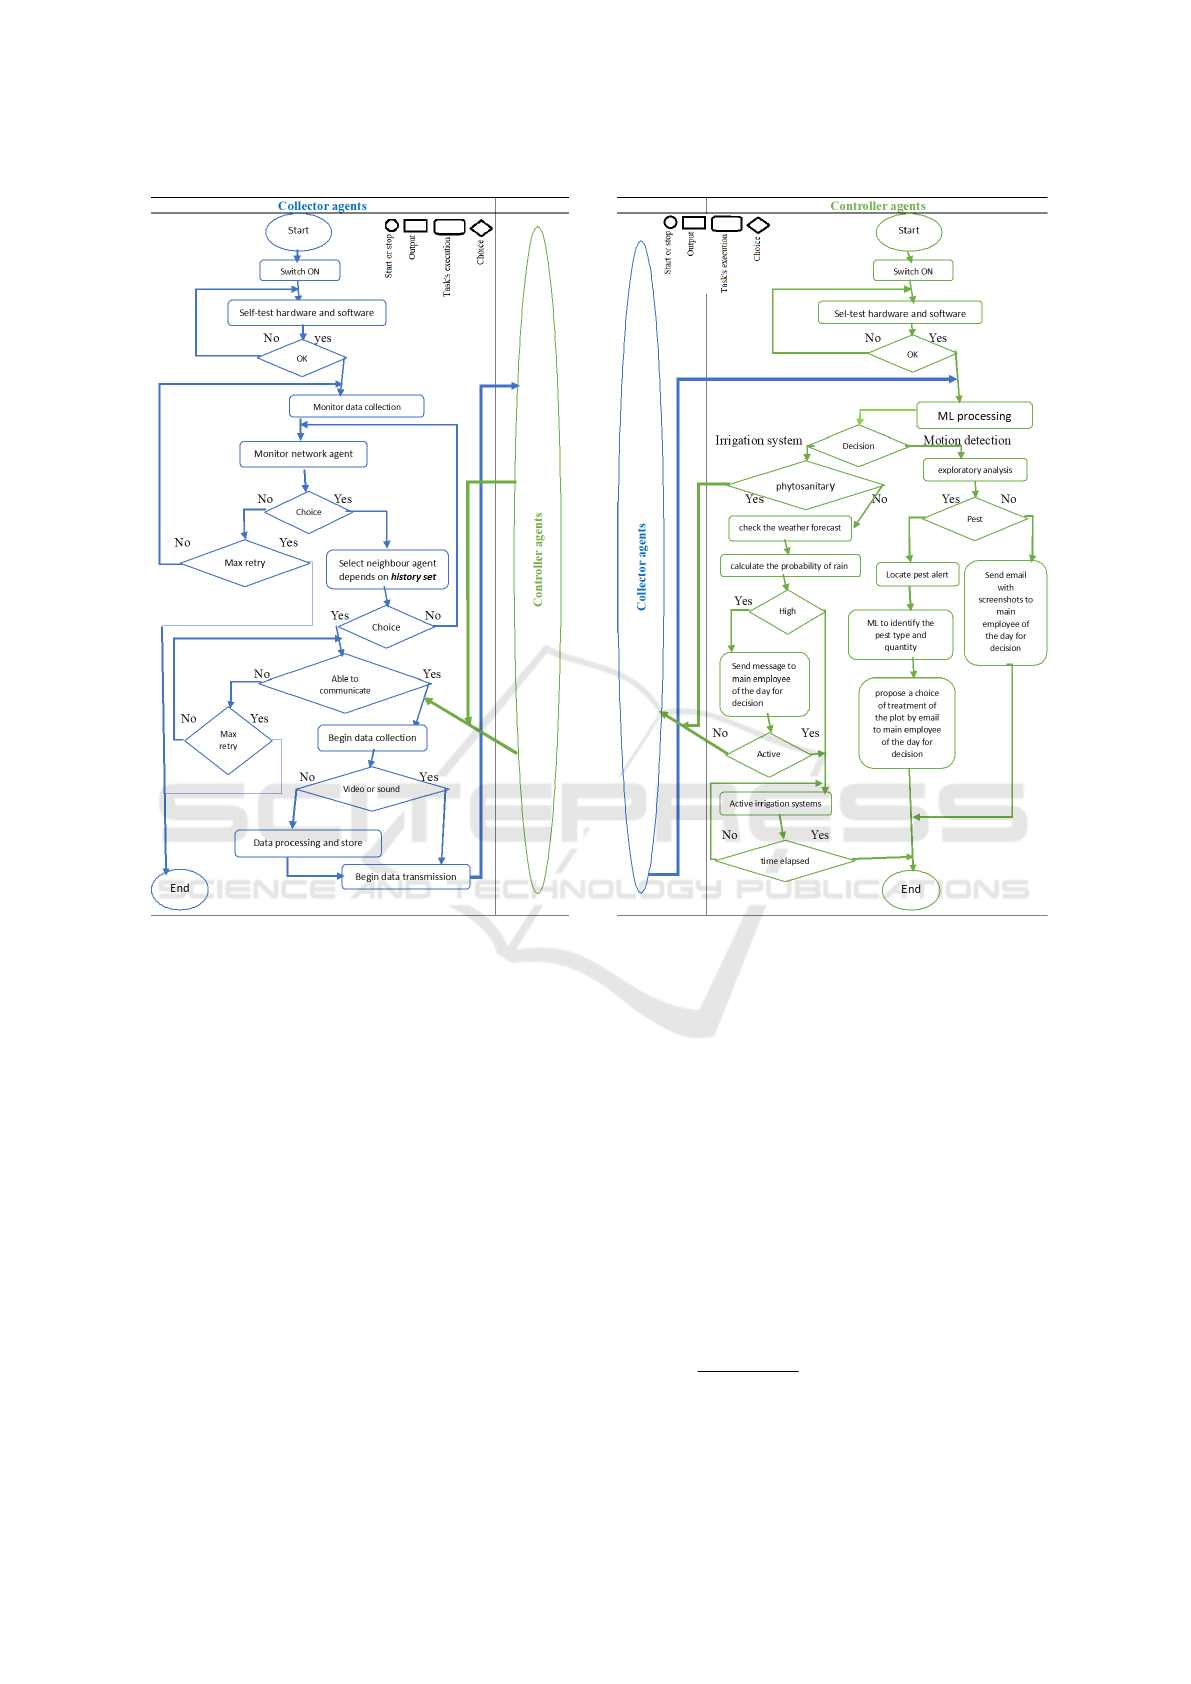
Figure 2: collectors agent’s interactions.
Card(A
C
) measure the cardinality of a set A
C
.
≻
a
i
depicts the strict preference of a
i
between two
outcomes.
4.2 The AIMS Mechanism
The main steps of AIMS are detailed below:
Step 1: Concurrent message sharing propagation and
decision making. A message sharing is propagated
across agents in a noreply mode (cf. rule 3), along
with a T T L (Time To Live) and a hop counter Hop.
Initially Hop = 1 and each agent increments it by 1
before forwarding the message sharing. T T L defines
the maximum hops allowed. The range of an agent is
0 or 1, expressed by:
range = Hop modulo 2 (5)
This is used for distributing the control of AIMS.
Step 2: Sampling next hop. When range=1, an
agent samples the agents in its next hop by using a
message probe(O
a
i
C
).
Figure 3: controllers agent’s interactions.
Step 3: Managing conflicts before a reject or a
weak-accept. Conflicts arise when a set of agents has
incompatible preferences, goals and/or dependencies.
Such conflicts are handled via agent weights, as:
- A reject means that no agent has agreed to the
message sharing.
- A weak-accept means that a set of agents denoted
W-Set has agreed to the message sharing and to
participate in C if their utility is enhanced and their
goals are not in conflict. Formally, a weak-accept of
W-Set={a
j
, a
k
, ...} of a message sharing implies that:
∃ {(G
a
j
, a
j
), (G
a
k
, a
k
), ...} : ∀ a
x
∈ W-Set, G
a
x
∈ O
a
i
C
.
We distinguish two types of weights based on :
- view, alliances and dependency;
- preferences of the agents in the message sharing.
Formally, the weight of agent a
i
is:
W
a
i
=
Card(Hs
a
i
∩ϑ
t
a
i
)
Card(ϑ
t
a
i
)
if γ
Net
a
i
=
/
0 : γ
Net
a
i
⊂ L
Net
a
i
W
Net
γ
a
i
if γ
Net
a
i
̸=
/
0 : γ
Net
a
i
⊂ L
Net
a
i
(6)
when agents are in conflict, the agent with the high-
ICAART 2024 - 16th International Conference on Agents and Artificial Intelligence
244
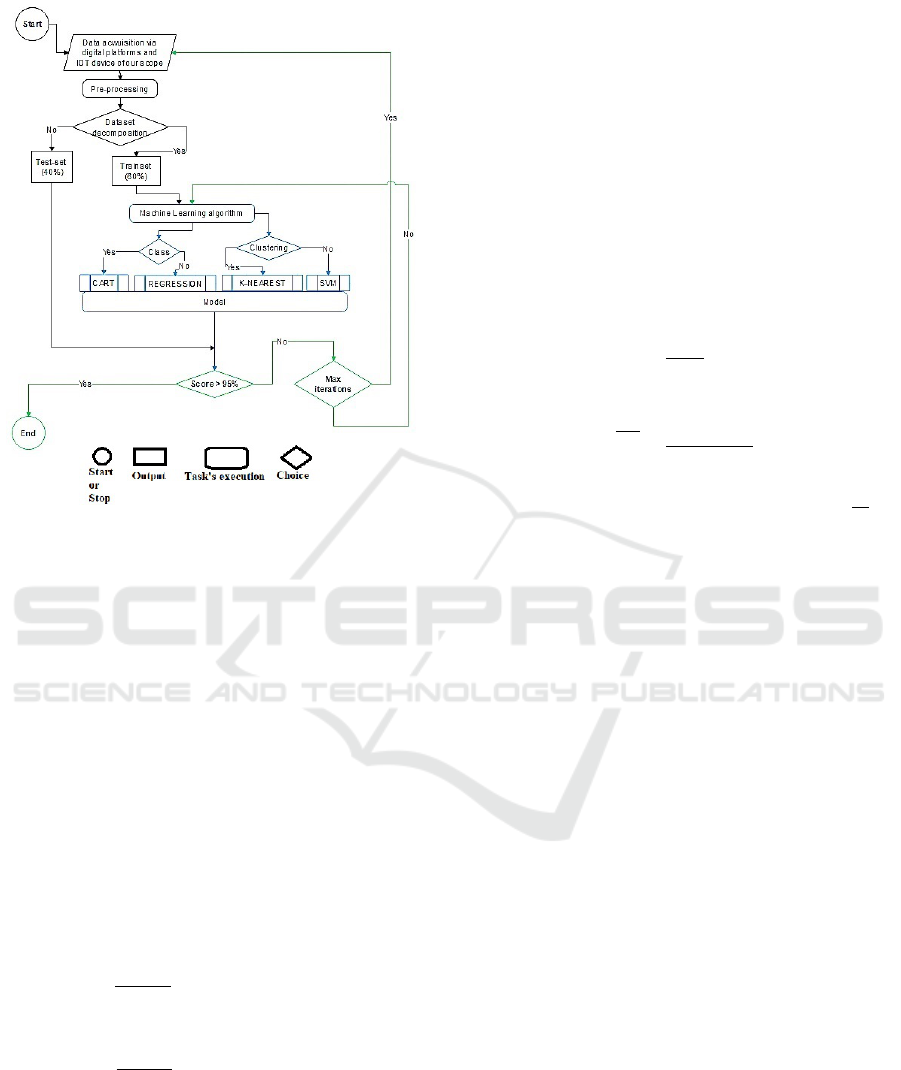
Figure 4: Machine learning to find the better data process-
ing way for useful decision making.
est weight and reliability is selected. If this does not
solve the conflict, the agent with the highest probable
stability is selected.
Note that, agents weights and reliabilities can be com-
puted by others.
The assessment of this weight is as follows:
- Each agent assesses its preference model regarding
its utility and the following 3 criteria: 1- reliability, 2-
stability and 3 weight. In our context, the agents are
self-interested and have an unpredictable availability,
the preference of a
i
for a
j
depends on the reliability
ρ
a
j
and on the probable stability P
a
j
s
of a
j
and the
difference between the weight W
a
j
of a
j
and W
a
i
of
a
i
. Due to uncertainties, agents have to dynamically
compute their preferences. Y
x
a
i
,a
j
is the preference of
agent a
i
for the agent a
j
regarding criterion x. Thus,
Y
1
a
i
,a
j
= ρ
a
j
−
∑
a
k
∈A
′
ρ
a
k
Card(A
′
)
if Y
1
a
i
,a
j
> 0;
Y
1
a
i
,a
j
= 0 if Y
1
a
i
,a
j
≤ 0.
Y
2
a
i
,a
j
= P
a
j
s
−
∑
a
k
∈A
′
P
a
k
s
Card(A
′
)
if Y
2
a
i
,a
j
> 0;
Y
2
a
i
,a
j
= 0 if Y
2
a
i
,a
j
≤ 0.
Y
3
a
i
,a
j
= W
a
j
−W
a
i
if Y
3
a
i
,a
j
> 0;
Y
3
a
i
,a
j
= 0 if Y
3
a
i
,a
j
≤ 0.
- Each a
i
computes its preference vector
∏
a
i
over
agents in W-Set.
∏
a
i
= (X
a
i
,a
j
, X
a
i
,a
k
, ...) (7)
Prior to computing its preference for each a
j
in W-Set,
a
i
uses the Choquet integral to aggregate its prefer-
ences for the agents on the three criteria.
X
a
i
,a
j
=
∑
k∈[1,3]
(Y
k
a
i
,a
j
−Y
k+1
a
i
,a
j
)µ(p) (8)
µ(p) is the weight of a subset of criteria. p =
1, 2, or 3, refers respectively to reliability, proba-
ble stability or weight. Thence, µ(1)=ρ
a
i
, µ(2)=P
a
i
s
,
µ(3)=W
a
i
. Due to the uncertain context, we con-
sider reliability as the most important criterion.
Thus, µ(1, 2)=µ(1, 3)=
1−ρ
a
i
2
, µ(2, 3)=1 − ρ
a
i
and
µ(1, 2, 3)=1. -The weight equals:
∏
=
∑
a
i
∈A
′
⊂A
∏
a
i
Card(A
′
)
(9)
where A
′
=W-Set is the set of agents which respond
with a weak-accept. The agents that maximize
∏
are
always preferred (see lines 5, 6 in algorithm 1).
Step 4: Message sharing and decision making
(see algorithm 1). In this step, message sharing
is done between the agents which have the highest
weight. When conflicts arise, the agents solve them
by preferring agents with the highest weight. MDP
(Faye et al., 2015) and (Faye et al., 2022) is used
to compute the stability of the coordination (see next
step).
Step 5: Commitment or rejection of a coordina-
tion. This stage requires no synchronization between
the agents. The decisions will be known by each agent
after the computation of the invariant vector of the
MDP.
5 PERFORMANCE EVALUATION
OF AIMS MECHANISM
5.1 Analytical Evaluation
Lemma 1. Message sharing terminates without
deadlock, regardless of the existence of a coordina-
tion.
Proof. ∀Probe(O
a
i
C
) an agent forwards this message
sharing if ϑ
t
a
i
̸=
/
0 by respecting the noreply mes-
sage principle to avoid message loop back. Each con-
flict between a
i
and a
j
is managed by the rest of the
agents of their message sharing by selecting the agent
Decentralized Intelligence for Smart Agriculture
245

Data: W-Set=X1 and W-Set=X2: X 1, X2 ⊂ A
Result: commit(X1 ∪ X 2) : X1 ∩ X 2=
/
0
initialization;
while a
j
∈ X 1 : range==0 and (X1 \ a
j
)={a
k
, a
l
, ...}:
W
a
j
=Max(W
a
k
,W
a
l
, ...) do
if ̸ ∃ a
j
∈ X 1 and a
x
∈ X 2: G
a
j
≡ G
a
x
∈ O
a
i
C
then
commit(X1 ∪ X2) : X1 ∩ X 2=
/
0;
end
if ∃ a
j
∈ X 1 and a
x
∈ X 2: G
a
j
≡ G
a
x
∈ O
a
i
C
then
if W
a
j
> W
a
x
and
∏
of a
j
is maximal then
Select a
j
and
commit(X1 ∪ X2) : X1 ∩ X 2=
/
0;
else
Compute the MDP for each configuration
in order to predict the stability if a
coordination is committed;
end
end
end
Algorithm 1: MergeD() (Merging decision).
which provides a larger weight to its message shar-
ing. This avoids the case where a
i
and a
j
are in an
impasse without awareness by the agents which are
awaiting a commitment. Note that, the conflict reso-
lution is decentralized and depends on the message
sharing(s) concerned by the conflict. Thus, dead-
locks are avoided in the coordination. This proves our
lemma.
Definition 8. A set of agents A form a Nash equilibria
partition P, if none of the agents in A is motivated to
leave other agents in order to join another partition
P
′
of another set of agents, i.e, ¬(∃ a
i
∈ A : a
i
∈ P,
∃P
′
: P
′
∪ {a
i
} ≻
a
i
P).□
Theorem 1. A weak-accept entails that there exists a
set of agents W-Set of a message sharing which guar-
antees a Nash equilibria partition in C.
Proof. Consider W-Set as the set of agents which re-
sponded with a weak-accept in a message sharing.
Consider that, U
t
a
x
is the outcome of the utility func-
tion U
a
x
of a
x
at time t.
(1) ∀a
j
, W-Set=W-Set ∪ a
j
if and only if G
a
j
∈ O
a
i
C
and U
t−1
a
j
⩽ U
t
a
j
and E
t
a
j
̸= 0. This means ∀a
j
∈ W-Set
it has agreed to join coordination C in offer O
a
i
C
.
(2) ∀a
i
, a
j
∈ W-Set, G
a
i
̸≡ G
a
j
and U
t−1
a
i
⩽ U
t
a
i
, U
t−1
a
j
⩽
U
t
a
j
. This means that, there is no conflict between the
agents in W-Set and each utility is maximized.
(3) ∀ W
a
i
of a
i
∈ W-Set, W
a
i
depends on its alliances
of its view ϑ
t
a
i
. In addition, a
i
aims to maximize its
weight and reliability because if it withdraws from W-
Set its weight and reliability will decrease. (1), (2) and
(3) above mean that, ∀a
i
∈ W-Set is not motivated to
deviate from W-Set and has agreed to join C with each
agent in W-Set. Thus, W-Set ⊆ C is Nash equilibria.
This proves our lemma.
Lemma 2. The merging of two W-Set gives also a set
of agents which is a Nash equilibria partition in C.
Proof. Consider X1 and X 2 two sets of agents in-
volved in two different message sharing which re-
sponded with a weak-accept. By theorem 1, X1 and
X2 are both Nash equilibria. X1 ∪ X2 is such that
X1 ∩ X2=
/
0. By algorithm 1, X1 ∪ X2 is such that
∀a
i
∈ X1 ∪ X2, W
a
i
and
∏
are maximized. Thus,
if the merging is a success, each agent maintains its
agreement to join coordination C with each agent in
X1 ∪ X 2. This proves our theorem.
Theorem 2. message sharing convergences toward a
coordination.
Proof. Lemma 1 proves that, if a weak-accept exist
for a message sharing, it will be without deadlock. In
addition, AIMS works even if some agents are un-
available, the termination is always guaranteed and
each agent has control over the outcome regardless
the state of other agents. Theorem 1 implies that,
the outcome of AIMS is always a stable coordination.
By lemma 2, if a weak-accept comes from a message
sharing or from the merging of a set of message shar-
ing then, no agent is motivated to deviate from the
outcome. In addition, the utility, the reliability, the
probable stability and the utilitarian social welfare of
the set of agents are maximized because the message
sharing which provides a larger weight is always pre-
ferred. Thus, for each agent’s, the outcome of mes-
sage sharing leads to a coordination where no agent is
motivated to deviate and where the utilitarian social
welfare is maximized.
5.2 Data Analysis
We show after 2 years experiments, different correla-
tion between maximum wind speed (Vent2M Max),
maximum ground temperature (Temp2M Max), max-
imum soil moisture (Hum2M), the day (JOUR) and
the year (YEAR).
The figure 6 highlight the dependences of a set
of variables of our context. This heat map is a two-
dimensional representation of data in which values
are represented by colors. Each square shows the cor-
relation (a measure of dependence) between variables
on each axis represented by colors. Correlation ranges
from -1 to +1. Values closer to zero means there is
no linear trend between the two variables. The close
to 1 the correlation is the more positively correlated
they are; that is as one increases so does the other
and the closer to 1 the stronger this relationship is. A
ICAART 2024 - 16th International Conference on Agents and Artificial Intelligence
246
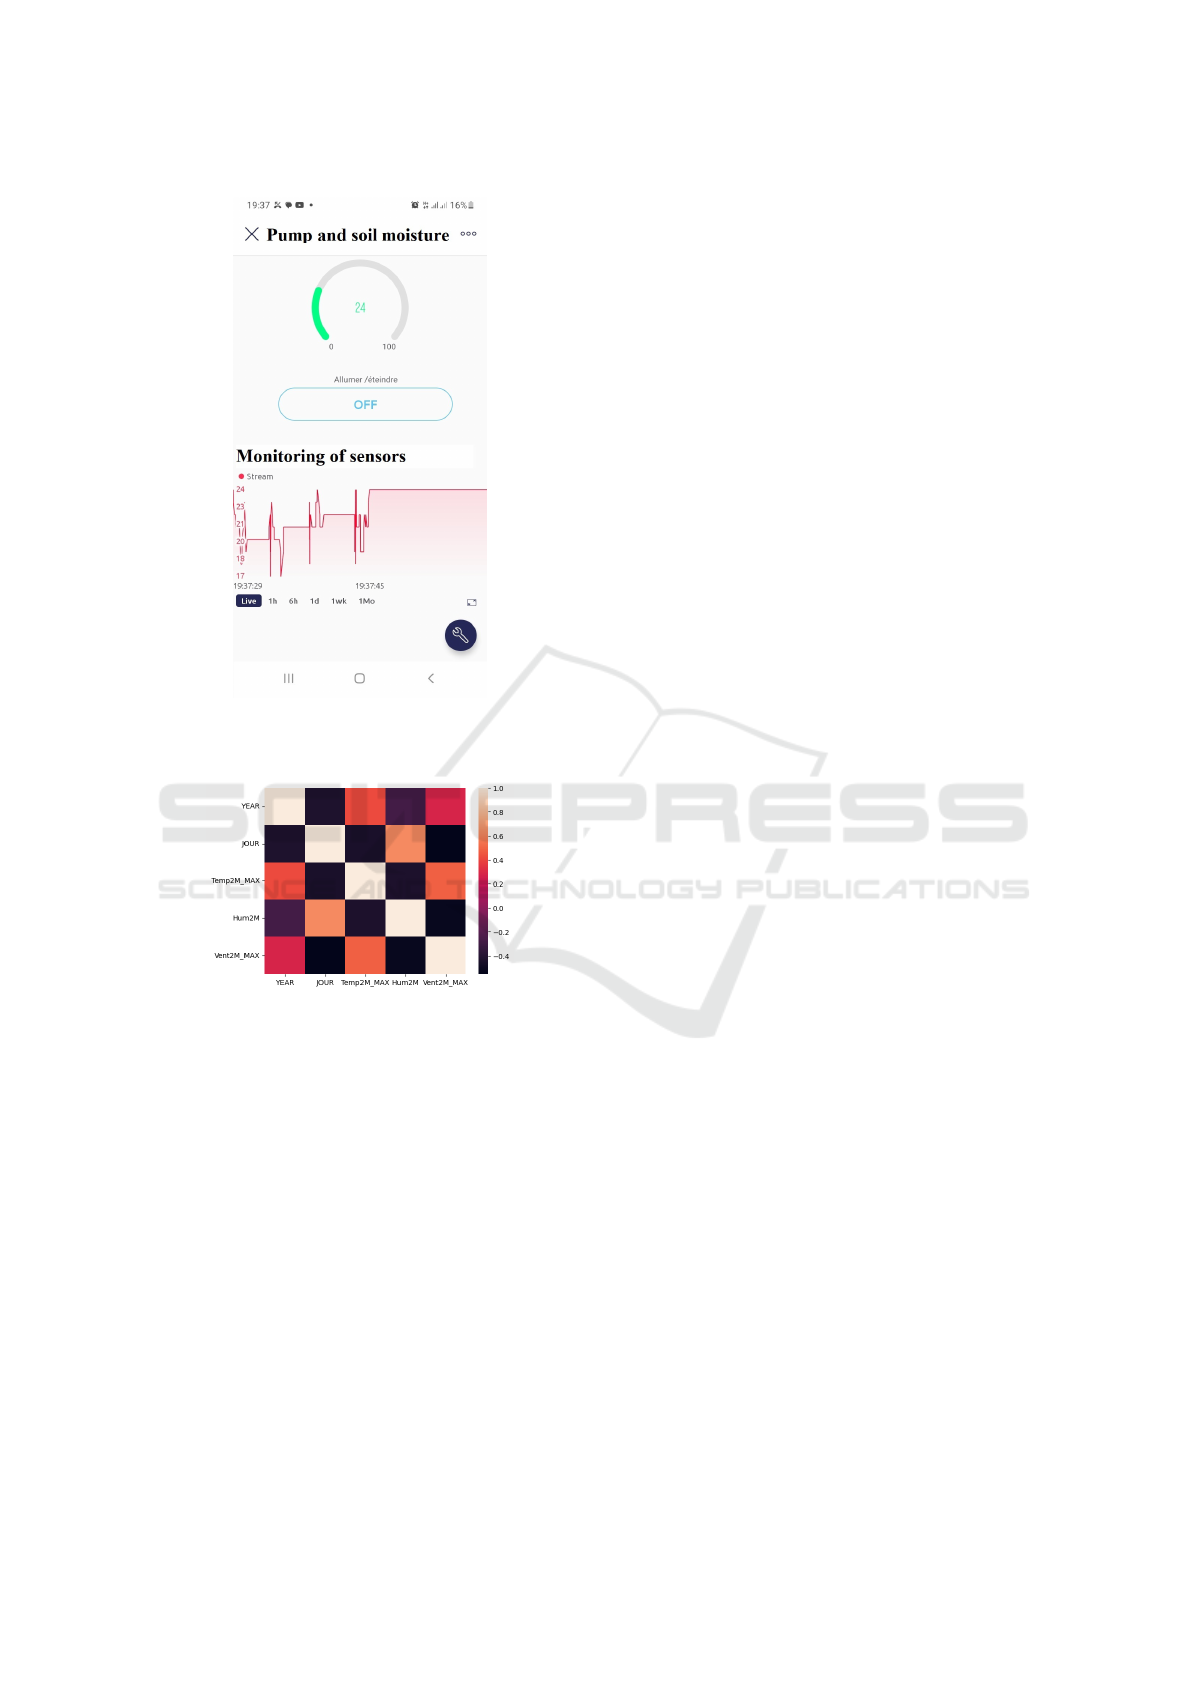
Figure 5: An example of a real time monitoring (live,
hourly, daily Weekly, Monthly) of the irrigation system
through a smart-phone.
Figure 6: Data correlation of the agents data.
correlation closer to -1 is similar, but instead of both
increasing one variable will decrease as the other in-
creases. The diagonals are all 1 because those squares
are correlating each variable to itself (so it’s a perfect
correlation). The larger the number and the lighter the
color the higher the correlation between the two vari-
ables. The figure 5 show an example of data display
of the sensors on our web application for a real time
decision making.
6 CONCLUSION AND
PERSPECTIVES
Based on climate input and agroecological input
parameters, this experiment provided a demonstra-
tion of the use of Machine Learning algorithms (K-
MN, SVM and CART) and Markov Decision Process
(MDP) to provide a good decision making. In addi-
tion, in the agricultural sector our AIMS model wants
to open up to other areas of IoT that it has already
explored in theory and evaluated its feasibility. In-
deed, the model does not seek to minimize agricul-
tural practices but rather seeks to perfect them by re-
lying on the analysis of agroclimatic data and their
management over time. Future work will include ex-
amining large datasets from different area to predict
crop yields in advance, detecting plant diseases and
predicting yields quality.
REFERENCES
Faye, P. F., Aknine, S., Sene, M., and Shehory, O. (2015).
Dynamic coalitions formation in dynamic uncertain
environments. International Conference on Web In-
telligence and Intelligent Agent Technology (WI-IAT),
page 273-276.
Faye, P. F., Aknine, S., Sene, M., and Sheory, O. (2014).
Stabilizing agent’s interactions in dynamic contexts.
28th International Conference on Advanced Informa-
tion Networking and Applications, page 925-932.
Faye, P. F., Senghor, M., and Ndione, G. A. (2022). Stable
trade coordinations in smart agriculture. International
Joint Conference on Web Intelligence and Intelligent
Agent Technology (WI-IAT), pages 215–222.
Paswan, R. P. and Begum, S. A. (2013). Regression and
neural networks models for prediction of crop produc-
tion. International Journal of Scientific and Engineer-
ing Research, pages Volume 4, Issue 9,ISSN 2229–
5518.
Sellam, V. and Poovammal, E. (2010). Prediction of crop
yield using regression analysis. IEEE Trans. Knowl.
Data Eng., pages vol.23, no. 10, pp. 1498–1512.
Shehory, O. and Kraus, S. (1998). Methods for task alloca-
tion via agent coalitions formation. AIJ, pages 165–
200.
Yates, R. D. and Goodman, D. J. (2005). Probability
and Stochastic Processes: A Friendly Introduction for
Electrical and Computer Engineers. John Wiley and
Sons, INC, Rutgers, The State University of New Jer-
sey.
Zhang, L., Lei, L., and Yan, D. (2010). Comparison of
two regression models for predicting crop yield. IEEE
International Symposium on Geoscience and Remote
Sensing (IGARSS).
Zingade, P. D., Buchade, O., Mehta, N., Ghodekar, S., and
Mehta, C. (2018). Machine learning-based crop pre-
diction system using multi-linear regression. Interna-
tional Journal of Emerging Technology and Computer
Science(IJETCS), pages Vol 3, Issue 2.
Decentralized Intelligence for Smart Agriculture
247
