
A Bounded Multi-Vacation Queue Model for Multi-Stage Sleep Control
∗
Jie Chen
a
Imperial College London, Exhibition Road, Exhibition Road, SW7 2AZ, London, U.K.
Keywords:
Queuing Analysis, Performance Evaluation, Optimisation, Communication System Performance Control.
Abstract:
To evaluate the performance of multi-stage sleep telecommunication systems, this paper presents a bounded
multi-vacation queue model. The energy consumption predicted by this model, shows an average error rate
of 0.0177 and the delay (predicted by the same model) shows an average error rate of 0.0655. Both error
rates were calculated over 99 instances.A general algorithmic method integrating the analytical model further
demonstrates the model’s accuracy.
1 INTRODUCTION
Bounded multi-stage sleep mode control has emerged
as an implementation feature for energy efficient
telecommunication networks.
In this scheme, mobile devices go into hibernation
gradually from light to deep sleep through a limited
number of discrete stages. They will then resume to
work when either a new workload arrives or the hiber-
nation is finished.To analyse this scheme, this paper
draws upon queuing theory and proposes the BMV
(Bounded Multi-Vacation) policy that is generalised
from the scheme. The vacation queue system has been
in discussion in the literature for a long time. These
systems work upon the policy of determining whether
or not the number of packets in a queue has reached
a threshold (N > 0) or the vacation time has exceeded
a certain amount (T policy) (B.T.Doshi, 1986). In
the following subsections, the feasibility of this new
policy and its performance against other options are
being discussed.
1.1 The Merits of BMV-Policy over
Other Policies
Investigations have demonstrated the convincing re-
sults that BMV policy can beat N-policy and T-policy
in terms of system performance and reliability. As N-
policy has only adjustable parameters of K (the sys-
tem buffer maximum quota), it has a bounded energy
a
https://orcid.org/0000-0002-7147-6570
∗
An abstract presentation has been conducted in
EURO 2022 Aalto (J.Chen, ).
consumption rate and delay. Whereas BMV-policy
can tune its N
v
(vacation amount limit) and L
v
(vaca-
tion length mean) across much wider ranges to guar-
antee an improved solution. Similarly T-policy can
be treated as a single vacation(SV) policy. Given a
fixed T , results have shown that if being broken into
multiple equally weighted vacations to make a BMV-
policy, the system would achieve a much smaller de-
lay. Figure 1 is in agreement with paper (J.Chen
et al., 2018) that power consumption level fluctuates
and delay increases with the increasing N. In this
particular simulation, λ = 550, µ = 1000, K = 50,
power
on
= 130, power
o f f
= 75. Results show that
though ρ = 0.55 and ratio
power
= 0.5769, the nor-
malised energy consumption per bit for N-policy re-
gardless of which N is selected, goes much higher
than 0.6. The system has not been saturated in terms
of energy conservation efficiency. As delay is a tradi-
tional QoS metric of a network system, we might also
want the new scheme would outperform N-policy in
terms of processing speed. Given a bounded delay for
N-policy as [ D
min
,D
max
],solutions with BMV-policy
can be easily founded that match the design criteria
that consumes less energy while falls within the de-
lay bounds. Two of them are depicted on the figure as
examples.
Suppose in T-policy, the vacation length is L
v
and
in BMV-policy, with the increase of n (maximum
number of vacations), L
BMV
v
=
L
v
n
, where n is the max-
imum number of vacations. The cases where n ∈ [1 7]
are executed and evaluated.Figure 2, shows that with
the increasing n, the delay decreases whilst the en-
ergy level fluctuates.Based on the limited tested cases,
NE
BMV
> NE
T
where NE stands for normalised en-
Chen, J.
A Bounded Multi-Vacation Queue Model for Multi-Stage Sleep Control.
DOI: 10.5220/0012325200003639
Paper published under CC license (CC BY-NC-ND 4.0)
In Proceedings of the 13th International Conference on Operations Research and Enterprise Systems (ICORES 2024), pages 245-252
ISBN: 978-989-758-681-1; ISSN: 2184-4372
Proceedings Copyright © 2024 by SCITEPRESS – Science and Technology Publications, Lda.
245
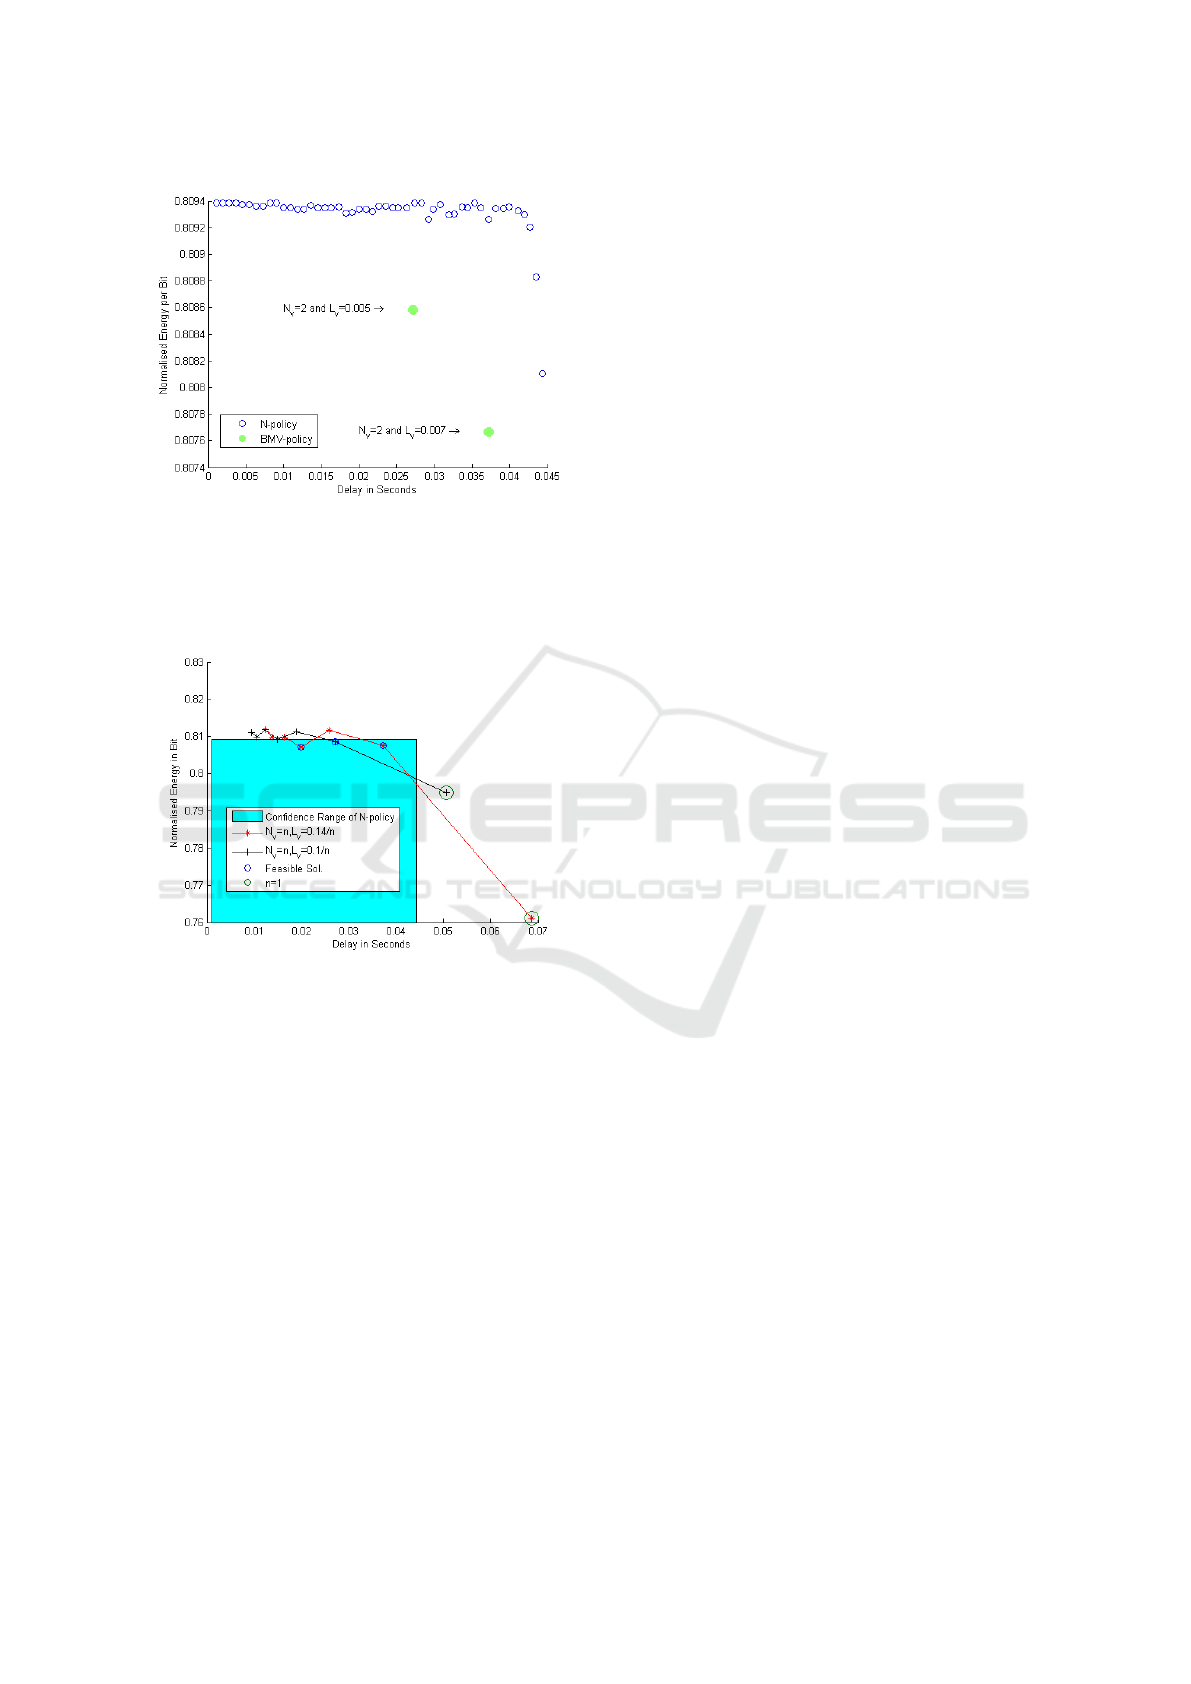
Figure 1: BMV-policy vs N-policy (Simulation).
ergy whilst D
BMV
< NE
T
. Given a fixed delay bound
[ D
min
D
max
] imposed by N-policy, results show
that BMV-policy can produce feasible solutions with
higher energy savings.
Figure 2: BMV-policy vs T-policy (Simulation).
1.2 Contribution
• The following work is the first to theoretically dis-
cuss multi-stage sleep control in the current state
of art telecommunication system.
• This work bridges the mathematically theoreti-
cal analysis (rigorous mathematical derivation and
proof) and the practical engineering problem by
the validation using software simulation. Previous
works in theoretical queuing analysis rarely en-
deavor to go through thorough experimental tests.
Works in mobile engineering have also not yet
developed analysis from generalised problem set-
tings. Analysis from a more generalised abstract
level can contribute to theoretical queuing analy-
sis development.
• This work treats the system design problem as an
optimal control problem considering the trade-off
between delay and energy consumption and pro-
vides sound analysis against both of these sys-
tem metrics. Most of the new queuing analy-
sis are solely devised to evaluate the delay met-
rics. These analyses have additionally evaluated
the cost metrics such as power consumption in
a typical telecommunication system.This work is
the first to propose a validated model for accurate
future prediction of those cost metrics.
2 RELATED WORKS
Works on energy efficient network optimisation fall
into two categories: the first is using analytical deriva-
tion (computational intelligence) to attain a precise
solution and the second is using artificial intelligence
to converge into an approximately accurate solution.
In general, though AI algorithm has the advantage to
handle larger data set,it seeks a solution that is con-
sidered empirically close to the ground truth with-
out knowing what the ground truth is. And re-
search works in AI application in energy efficient
network design emerges in recent years.For exam-
ple,paper(Q.Wu et al., ) proposed an AI methodol-
ogy based framework to predict the dynamic of the
traffic and henceforth to control the base station ac-
tivities. Somehow, the base station has only on and
off two states and the operation time span is half an
hour. It means, the base station once set to be off will
stay asleep for half an hour regardless of any emer-
gency traffic abnormal to the training data set.It is
not realistic in practical hardware design. As men-
tioned in paper(M.Feng et al., 2017), especially for
small scale base station, on site cooling is not pos-
sible and it is critical to take into account the detec-
tion power.The sleep mode is classified into 4 stages:
ON,OFF,Standby,Sleep.Furthermore,the author in pa-
per (Q.Wu et al., ) has not demonstrated the effective-
ness of the scheme in delay cutoff.According to the
optimisation problem formulation, the delay penalty
is expected to be as minute as possible and there ex-
ists a trade-off between the power consumption and
the delay.In traffic prediction, the author utilises 20
days’ traffic data set to train and evaluate the scheme
using the last 10 days’ traffic data. The first cate-
gory of analytical approach, though relatively con-
ventional, has been still robust and reliable in net-
work design in general. In the speciality area of en-
ergy efficient network design, vacation queue is ap-
plied. N-policy is of most interest as it relates much
to the buffer size in terms of data packet which has
been conceptualised concretely in network software
design. Paper(P.Badian-Pessot et al., 2016) provides
ICORES 2024 - 13th International Conference on Operations Research and Enterprise Systems
246

a theoretical proof of the existence of an optimal
work conserving policy by utilising continuous-time
markov chain theory and analysing the average cost
optimality equations (ACOE) for the problem. It also
provides the experimental verification of the proof
such that scenario where the server always works at
the highest service rate and where the server turns
off when the queue is empty are being used as the
benchmark policies. It shows that the on policy where
the server turns on when the system has N packets
in queue and turn off otherwise outperforms these
two benchmark policies.Paper(J.Wu et al., 2020)ap-
plies the N-policy in that it proposes three schemes
to achieve the system performance goal in terms of
energy consumption,delay and blocking probability :
the first scheme is literally N-policy queue, the second
scheme is cooperative where the residual traffic from
sleepy BS can be diverted to active BS and the third
scheme is hybrid. An analytical model is proposed
for the N-policy queue. Furthermore, the authors also
discusses the feasibility to accommodate different ser-
vice rate distributions and Markov Modulated Pois-
son Process as input rate distribution. Regarding the
cooperative scheme, the author utilises IESA (Infor-
mation Exchange Surrogate Approximation) to best
estimate the performance parameters.
Apart from just applying queuing policies, queue-
ing analysis techinques have been borrowed to eval-
uate more complex scenario such as cognitive ra-
dio where users are priotorized to access the spec-
trum.The authors in paper(J.Liu et al., 2019) treat
the system state as a tuple size of three, each repre-
senting the overall number of secondary users in the
system, the number of secondary user packets to be
served by the channel and the number of primary user
packets to be served by the channel respectively.Then
they derive the probability transition matrix and from
the matrix, attain the stable queue length distribu-
tion. The authors also propose how to measure the
latency,throughput,energy saving rate, etc and form
the cost function as the weighted sum of these system
parameters.The analytical results are consistent with
the simulation results. The below works also employ
other theorem and techniques to facilitate the queuing
analysis.Paper(T.Phung-Duc, 2020) provides a pre-
cise analysis of the waiting time and queue length
probability distribution. In doing that, the author ap-
plies Rouche’s Theorem to gain a closed form solu-
tion to the generating function of the probability dis-
tribution and proposed a recursive algorithm to attain
the queue length probability distribution. The author
considers the set up time and treated the system as one
with no abandonment.The short paper (Yazici.M.A
and T.Phung-Duc, 2020) is tightly written. It ap-
plies fluid analysis to attain the workload distribution
of the system, evaluates the cost function borrowed
and provides results for power consumption and sys-
tem waiting time tradeoff based on the analysis. Pa-
per(J.Pender and T.Phung-Duc, 2016) contributed by
the same author continues to use fluid limit theorem
to predict the queue length.
3 PROBLEM FORMULATION
In paper (J.Chen et al., 2018), the system is perceived
to rotate between sleep mode and working mode. Fol-
lowing this approach, the system performance is eval-
uated such that instead of focusing on an equilibrium
long term, with the system running a countably in-
finite time frame by simulation, the system running
thread is composed of multiple running cycles. In
this paper, by averaging over these running cycles,
a particular uniform cycle is inspected, that consists
of a sleeping sub-frame and an active sub-frame, the
statistically distributed measurements such as power
consumption and delay are calculated and equated to
those sub-frames in the longer term.
3.1 System Description
The queuing system consists of an intelligent server
that can vacate whenever the queue is empty. The va-
cation duration is adjusted based on two parameter
configurations. These parameters are, the maximum
vacation number N
v
and the average vacation period
L
v
. To be more specific, the queue, once in vacation
mode will return to the workstation whenever a vaca-
tion period expires. If the queue is still empty, it will
continue to next vacation period until the maximum
vacation number is reached. Otherwise it will resume
to work upon its return to the workstation.Please refer
to Figure 3 for further illustration.
Figure 3: System Work Flow.
According to 3, the server transits from the work-
ing mode to the sleep mode whenever the queue is
A Bounded Multi-Vacation Queue Model for Multi-Stage Sleep Control
247

Table 1: The list of symbols used in this paper.
Symbol Definition
N
v
maximum vacation number
L
v
average vacation period
λ input poisson traffic rate
µ exponential distributed service rate
p
s
the vacation power
p
a
the working power
L
s
average sleeping sub-frame length
L
b
average working sub-frame length
P
L
s
(i) the probability that packets start to arrive during i
th
sleeping period
P
init
the probability distribution of queue length upon the working period
p
k
the probability that the arrival packet number is equal to k
P
other
(n) the queue length distribution at n
th
departure epoch with the zero queue length probability value set as 0
P
zero
(n) the probability that the server encounters an empty queue at n
th
departure epoch
P
0
initial queue length probability distribution
¯
P
0
the conditional queue length distribution that the server doesn’t see an empty queue at the initial departure
epoch
P
sum
k
the probability that the server stops before k
th
departure epoch
E[L
i
] average idle period length
L
a
inter-arrival time for the first packet in the idle mode
N
L
s
number of arrivals within period L
s
E
i
normalised energy per bit
E[NE] average normalised energy per bit
W average waiting time
γ(t) packet time summation up to time instance t
α(t) in-queue packet number summed up to time instance t
△γ(t) the overall packet-in queue time for an averaged running cycle
△α(t) the overall in queue packet number for an averaged running cycle
ρ load
K the queue buffer limit
L
Q
init
the conditional queue length when the system resumed to work
N
a
number of arrivals
P
ql
k
the conditional queue length when the system is active at departure epoch k
empty.It transits from the sleep mode to the working
mode whenever the queue is not empty. If the server
has waited for the maximum sleep cycle length and
there is still no packet coming, the server will enters
the idle mode. From idle mode, the server will de-
cide whether it enters the working mode depending on
whether the queue is empty or not. The input traffic
model follows a Poisson distribution with an average
rate of λ and the service pattern follows an exponen-
tial distribution with an average rate of µ. Currently,
the power that the sever uses at vacation is p
s
, the va-
cation length is uniform over all stages and the power
that the server uses at work is p
a
.
3.2 Power Consumption Analysis
In this paper, it is assumed that the sleeping sub-frame
has a length of L
s
and the working sub-frame has a
length of L
b
. By design it is also assumed that the
system starts with sleeping mode.
As there are at most N
v
sleeping periods, for the
system to enter working mode after the first period,
there must be at least 1 arrival during the first period.
For the system to enter working mode after the n-th
period with n ≤ N
v
, there needs to be at least 1 arrival
during the previous (n −1)th period but none happens
during the previous (n − 2) periods.
Let A be the scenario where there is at least 1
arrival within time frame iL
v
; let B be the scenario
where there is at least 1 arrival within time frame
(i − 1)L
v
; let C be the scenario where there is at least
1 arrival within time frame iL
v
−(i−1)L
v
only, which
is equivalent to the phenomena where the packets
start to arrive during i
th
sleeping period. Henceforth
C = A − B. Further, P(C) = P(A) − P(B). The for-
mula is constructed as:
P
L
s
(i) = e
(−λ(i−1)L
v
)
− e
(−λ(i)L
v
)
Upon entering the working period, the starting prob-
ability distribution of the queue length of the system
which is P
init
= [p
k
]×K with K is the maximum queue
size. p
k
= e
(−λL
v
)
(λL
v
)
k
k!
Theorem 1. As the system probabilistically evolves
from the initial distribution towards an approximately
zero position dominated distribution,such that the
P
other
(n) is approximately 0, the summation of the
P
zero
(n) across all the stopping point is approximately
to 1 as much as possible, ∀ε, ∃N, when n > N,
1 −
∑
n
k
P
zero
(k) ≤ ε.
ICORES 2024 - 13th International Conference on Operations Research and Enterprise Systems
248

Proof. Assume the initial probability distribution
has P
0
= [P
0
(0) P
other
(0)] and P
0
= [0 P
other
(0)],
[P
0
(1) P
other
(1)] = P
0
∗ P
tran
.
Psum
1
=
1
∑
i=0
P
0
(i) = P
0
(0) + P
0
(1)
=
K
∑
i=1
P
i
other
(0) −
K
∑
i=1
P
i
other
(1) + P
0
(0)
= 1 −
K
∑
i=1
P
i
other
(1) ≤ 1
Psum
2
=
2
∑
i=0
P
0
(i) = P
0
(0) + P
0
(1) + P
0
(2)
= 1 −
K
∑
i=1
P1
i
+
K
∑
i=1
P1
i
−
K
∑
i=1
P2
i
= 1 −
K
∑
i=1
P2
i
It can be intuitively derived that
Psum
n
= 1 −
K
∑
i=1
P(n)
= 1 − Psum
other
(n)
K
∑
i=0
P
i
(n) =
K
∑
i=0
K
∑
j=1
P
j
(n − 1) ∗ P
tran
( j,i)
= 1 −
K
∑
i=0
P
0
(n − 1) ∗ P
tran
(0,i)
=
K
∑
i=1
P
i
(n − 1)
=
K
∑
i=0
P
i
(n − 1) − ε
n
(1)
where ε
n
= P
0
(n − 1). Hence, the following equation
can be justified, Psum
other
(n) < Psum
other
(n − 1) ≤
1. Psum
other
(i) is thus a monotonically decreasing
sequence while Psum
n
is a monotonically increas-
ing sequence within the frame [0,1]. Hence,given
an ε as small as possible, there always exist an N
that N =
i
Psum
other
(i) > ε, for n > N, 1 − Psum
n
=
Psum
other
(n) < ε.
Assuming the transition matrix is P
tran
,the forma-
tion of P
tran
for the current M/M/1/K queue system
can be extended from paper (J.Chen et al., 2018).
P
tran
= [p
i, j
] ∗ [K × K]
p
i, j
=
0
if j < i − 1
R
∞
0
µe
(−(λ+µ)t)
(tλ)
( j−i+1)
( j−i+1)!
if (i − 1) <= j < K
∑
∞
j=K
R
∞
0
µe
(−(λ+µ)t)
(tλ)
( j−i+1)
( j−i+1)!
if j = K
(2)
[P
zero
(k) P
other
(k)] = [0 P
other
(k − 1)] ∗ P
tran
E[L
b
] = E[E[L
b
|l
k
=
k
∑
i
x
i
]
=
n>N
∑
k
P
zero
(k)E[l
k
]]
=
n>N
∑
k
P
zero
(k)kE[x
i
]
=
n>N
∑
k
P
zero
(k)k
1
µ
(3)
The special scenario in which there is no arrival
within the maximum number of vacation periods is
analysed as below: The period between the end of
the overall sleeping sub-frame and the beginning of
server running period is labeled as ilen - the idle
length. As the Poisson Distribution follows an indi-
vidually independent Markovian pattern, ilen is per-
ceived as the inter-arrival time between the zeroth ar-
rival and the first arrival minus the maximum overall
sleeping sub-frame.
E[L
i
] = E[L
a
|N
L
s
= 0]
− L
v
N
v
=
Z
∞
L
v
N
v
tλe
(−tλ)
e
(−(L
v
N
v
)λ)
dt
− L
v
N
v
=
e
L
v
N
v
λ
λ
Γ(2,L
v
N
v
λ) − L
v
N
v
(4)
L
a
is the inter-arrival time for the first packet in
the idle mode and N
L
s
is the number of arrivals within
period L
s
.
At the end of this inter-arrival time, the queue
length probability distribution can be written as P
init
is [0] × K and P
init
[1] = 1
Let the ratio r =
L
s
L
b
+L
s
. Normalised energy per bit
can be derived from E
i
= 1 − r + r ∗
p
s
p
a
. i <= N
v
are
the events where the server resumes to work within
the maximum amount of sleep frames. In these cases
L
s
= i ∗L
v
and L
b
+L
s
= L
b
+i∗L
v
. Then i = N
v
+1 is
the event where the server has an idle stage between
A Bounded Multi-Vacation Queue Model for Multi-Stage Sleep Control
249

the sleeping sub-frame and the working sub-frame. In
this case L
s
= N
v
∗L
v
and L
s
+L
b
= L
′
b
+ilen+N
v
∗L
v
.
Lastly the event for i > N
v
+ 1 doesn’t exist. Let NE
be the acronym for normalised energy per bit,
E[NE] =
N
v
∑
i
E
i
∗ P
L
s
(i)
+
E
N
(v+1)
e
(−λN
v
L
v
)
(5)
where the probability of first arrival within i
th
vaca-
tion period P
L
s
(i)
= e
−λ(i−1)L
v
− e
−λiL
v
.
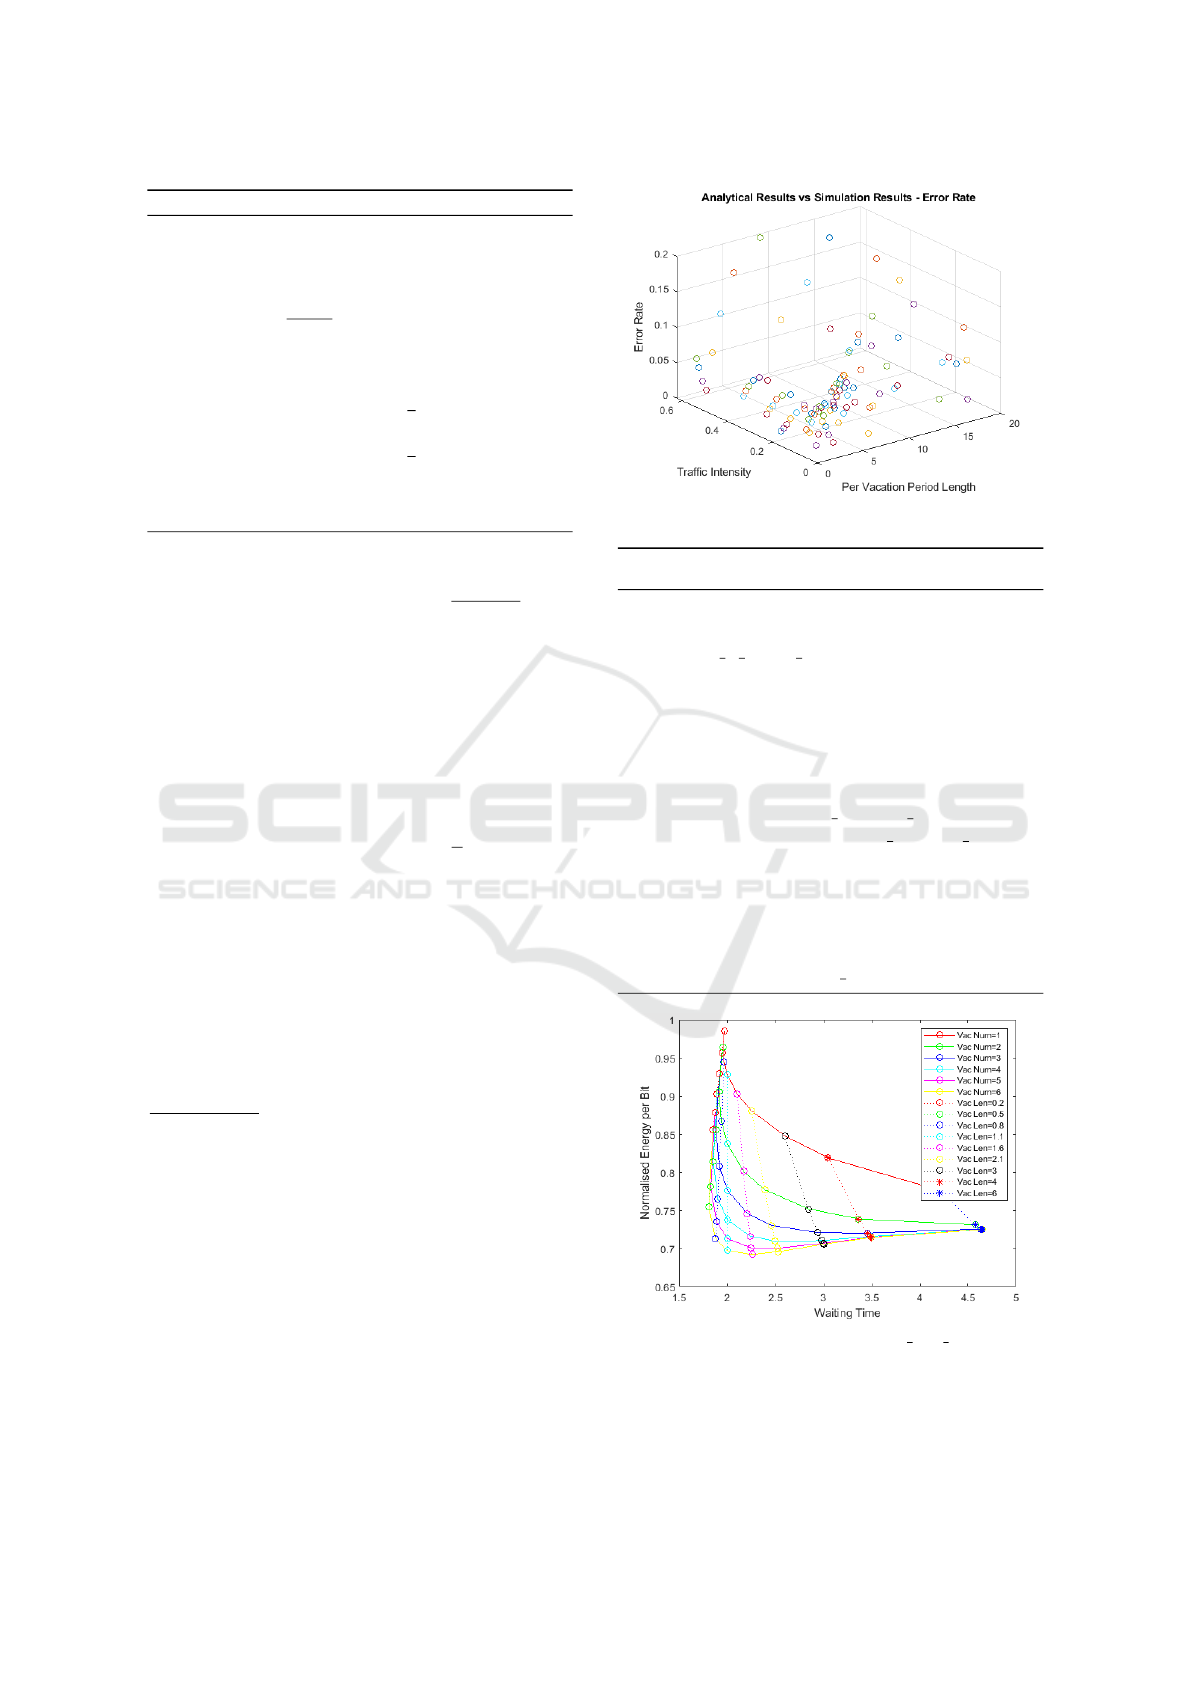
3.2.1 Case Study
µ = 0.8,N
v
= 4,L
v
= {a|a =
1
L
v
= 0.1 + 0.05 ∗ i i ∈
[ 1,9 ]and i ∈ Z} From Figure 4, it can be noticed
that the analytical plots based from the above proce-
dure have a similar curve as the simulation plots and
the numerical values are pretty close to each other.The
average error rate is 0.0177 and deviation is 0.0102
over 99 data instances.
(a) L
v
= 0.15. (b) L
v
= 0.2. (c) L
v
= 0.25.
(d) L
v
= 0.3. (e) L
v
= 0.35. (f) L
v
= 0.4.
(g) L
v
= 0.45. (h) L
v
= 0.5. (i) L
v
= 0.55.
Figure 4: Normalised Power Analysis Validation.
3.3 Waiting Time Analysis
Waiting time analysis borrows the basic idea from Lit-
tle’s Theorem.The analysis is performed as decom-
posing the long term waiting time average for the
system into two event cases: A no arrival within the
limited vacation time; B no less than 1 arrival within
the limited vacation time. It is easy to conclude that
P(A) = e
(−λ(N
v
L
v
))
and P(B) = 1 − P(A).
Theorem 2. For the event that no arrival within the
limited vacation time, the system is working as a
M/M/1/K system without any policy.
1
1
the theory has been similarly mentioned in literature
Lemma 3. The waiting time for the vacation queuing
system in general is equivalent to the waiting time for
packets in an averaged running cycle.
Proof. By Little’s theorem, in the long term, the over-
all packet-in-queue time summation divided by the
number of overall in queue packets is the waiting
time. This can be written as, W = lim
t→∞
γ(t)
α(t)
, where
γ(t) is the packet time summation up to time instance
t and α(t) is the in-queue packet number summation
up to time instance t. The overall system time con-
sists of an infinite number of running cycles. Suppose
for an averaged running cycle, the overall packet-in
queue time summation is △γ
k
and the overall in queue
packet number is △α
k
.
W = lim
n→∞
∑
n
i=1
△γ
i
∑
n
i=1
△α
i
= lim
n→∞
n△γ
i
n△α
i
=
△γ
k
△α
k
Lemma 4. In a no policy M/M/1/K system, the
timer of arrival process and departure process are
synchronised. The Markov transition diagram can
be drawn time-invariably and subsequently the clas-
sical equilibrium probability formula can be derived.
The scenario where no arrival within vacation time
falls into the category because the arrival process and
departure process are synchronised.In this case, the
Markov transition diagram starts when the server fin-
ishes vacation and embarks on idle period. Hence,
the waiting time is W = (ρ ∗(1 +K ∗ ρ
K+1
−(K +1)∗
ρ
K
)/((1 − ρ) ∗ (1 − ρ
K+1
))) ∗ λ
−1
with ρ =
λ
µ
and K
is the queue limit.
For event B, following Theorem 2, W =
△γ
B
△α
B
.
Here α
B
is the overall packet in queue number and is
equivalent to the number of packets that have been de-
parted during an averaged running cycle (as the run-
ning cycle only stops when all the packets in queue
are out of the system). This can be written as, △γ
B
=
A
s
+ A
b
where A
s
is the packet in-queue time summa-
tion during an averaged vacation cycle and A
b
is the
packet in-queue time summation during an averaged
busy cycle.
The conditional queue length when the system re-
sumes to work is L
init
Q
= E(L
Q
|N
a
> 0) =
∑
K
i=1
iPinit(i)
∑
K
i=1
Pinit(i)
,
where N
a
is the number of arrival.
already (B.T.Doshi, 1985). Here a more intuitive and alter-
native approach is presented.
ICORES 2024 - 13th International Conference on Operations Research and Enterprise Systems
250
Algorithm 1: Calculation of A
s
.
1: procedure CALCAS(λ,L
init
Q
)
2: A
s
= 0 , i = 0 and res = L
init
Q
3: if L
init
Q
< 1 then
4: A
s
=
1
lambda
∗ res
5: else
6: while i ≤ L
init
Q
do
7: if res < 1 then
8: A
s
= A
s
+ i ∗
1
λ
∗ res
9: else
10: A
s
= A
s
+ i ∗
1
λ
11: i = i + 1
12: res = L
init
Q
− i
The conditional queue length when the system is
active at departure epoch k is P
ql
k
=
∑
i
P
k
other
(i)i
∑
i
P
k
other
(i)
when
k = 0, Pqlen = L
init
Q
,
A
b
=
K→∞
∑
i=0
P
0
(i)A
i
b
(6)
A
i
b
is the packet in-queue time summation when the
queue becomes empty at the ith departure epoch for
an averaged busy cycle.
A
i
b
=
i
∑
k=0
0.5 ∗ ((P
ql
k
+ P
ql
k
+
λ
µ
)/µ)
(7)
3.3.1 Case Study
The parameters are set in accordance with Section B
- Case Study. The analytical plots in figure 5 have
some discernible discrepancies from the simulation
results, esp. for L
v
= 16.66667 when high chance of
multiple arrivals within the first single sleep vacation
exists. It is not an ideally targeted situation for this
bounded multi-vacation policy. The average error rate
|VAL
ana
−VAL
sim
|
VAL
sim
over all the 99 instances is 0.0655 and
standard deviation is 0.0483.
3.4 Optimisation Scheme
The goal of the optimisation is to select an ideal
(L
v
,N
v
) pair from a feasible pool for a given input
traffic rate λ, given a fixed service rate µ.
3.4.1 Case Study
With a specific pool of (L
v
,N
v
), L
v
=
[ 0.2 0.5 0.8 1.1 1.6 2.1 3 4 6 ] and N
v
= [ 1 2 3 4 5 6 ],
the analytical results are plotted as below in Figure
6. µ = 0.8 and λ = 0.3.
Figure 5: Waiting Time Analysis Validation.
Algorithm 2: Search for Optimal Vacation Period and Va-
cation Maximum Number.
1: procedure OPTSEARCH(λ,µ,Dconst) ▷ Dconst
is the waiting time bound
2: Pool L v,Pool vnum Initialisation
3:
4: minP = 1,optL
v
= 0 and optV num = 0
5: while Pool
vnum
not exhausted do
6: vnumIndex = vnumIndex + 1
7: while Pool
L
v
not exhausted do
8: L
v
Index = L
v
Index + 1
9: E = Power Analysis Function
10: W = Waiting
T
ime Analysis Function
11: if W < Dconst then
12: if E < minP then
13: minP = E
14: optVnum=
Pool
vnum
[vnumIndex]
15: optL v= Pool
L
v
[L
v
Index]
Figure 6: Energy-Delay vs (L v, N v).
The plot is similar to Figure 3 in (X.Guo et al.,
2013) when the vacation number is 1 and the vaca-
tion length is a constant. As in paper (X.Guo et al.,
A Bounded Multi-Vacation Queue Model for Multi-Stage Sleep Control
251

2013), the traffic rate and service rate have not been
mentioned for generating Figure 3, the comparison
stops where the plots have similar curves but not exact
values. With the increase of the vacation length, the
normalised energy per bit decreases while the wait-
ing time increases. And the same rule applies to the
change of the vacation number. Suppose the expected
maximum delay is set to 2, the derived optimal solu-
tion is (0.8 ,6).
To validate the results, the simulation results are
collected and a brute force method used to locate the
ground truth and it can be seen in the figure 7 be-
low that the derived minimum is 2 steps away from
the ground truth (0.8 ,3).The derived solution has a
relative error rate of [ 0.0299,0.022 ] from the ground
truth value in this particular case study.
Figure 7: Effectiveness of the Derived Solution.
4 CONCLUSIONS
This work first discusses the advantage of the newly
devised multi-stage sleep mode control for telecom-
munication networks and then presents a validated an-
alytical model for it regarding energy efficiency and
system delay. Lastly, the method as being integrated
into a general algorithm design, is guaranteed to pro-
duce a solution that is deviated from the ground truth
by minute discernible error.
5 FUTURE WORKS
Future works will investigate further into the delay
modelling determining whether the discrepancy mat-
ters in practical engineering settings. The author will
look into end-to-end delay bounds as specified in next
generation telecommunication networks.
REFERENCES
B.T.Doshi (1985). A note in stochastic decomposition in a
GI/G/1 queue with vacations or set-up times. Journal
of Applied Probability, pages 419–428.
B.T.Doshi (1986). Queueing systems with vacations — a
survey. Queueing Systems, pages 29–66.
J.Chen. A bounded multi-vacation queue model for multi-
stage sleep control. https://shorturl.at/EGOTU.
J.Chen, B.Sikdar, and M.Hamdi (2018). An adaptive n-
policy queueing system design for energy efficient
and delay sensitive sensor networks. Proceedings of
the 2018 IEEE Global Communications Conference
(GB2018).
J.Liu, S.Jin, and W.Yue (2019). Performance evaluation and
system optimization of green cognitive radio networks
with a multiple-sleep mode. Annals of Operations Re-
search, pages 371–391.
J.Pender and T.Phung-Duc (2016). A law of large numbers
for M/M/C/delayoff-setup queues with nonstationary
arrivals. International Conference on Analytical and
Stochastic Modelling Techniques and Applications.
J.Wu, E.W.M.Wong, Y.Chan, and M.Zukerman (2020).
Power consumption and gos tradeoff in cellular mo-
bile networks with base station sleeping and related
performance studies. Transactions on Green Commu-
nications and Networking.
M.Feng, S.Mao, and T.Jiang (2017). Base station on-off
switching in 5G wireless networks: Approaches and
challenges. IEEE Wireless Communications.
P.Badian-Pessot, D.G.Down, and M.E.Lewis (2016). Op-
timal control policies for an M/M/1 queue with a re-
movable server and dynamic service rates. Interna-
tional Conference on Analytical and Stochastic Mod-
elling Techniques and Applications.
Q.Wu, X.Chen, Z.Zhou, L.Chen, and J.Zhang. Deep rein-
forcement learning with spatio-temporal traffic fore-
casting for data-driven base station sleep control.
IEEE/ACM Transactions on Networking.
T.Phung-Duc (2020). Batch arrival multiserver queue with
state-dependent setup for energy-saving data center.
Applied Probability and Stochastic Processes, pages
421–440.
X.Guo, S.Zhou, Z.Niu, and P.R.Kumar (2013). Optimal
wake-up mechanism for single base station with sleep
mode. Proceedings of the 2013 25th International
Teletraffic Congress (ITC).
Yazici.M.A and T.Phung-Duc (2020). M/M/1 vacation
queue with multiple thresholds : A fluid analysis. In-
ternational Conference on Quantitative Evaluation of
Systems.
ICORES 2024 - 13th International Conference on Operations Research and Enterprise Systems
252
