Comparision Through Architectures of Semantic Segmentation in Breast
Ultrasound Images Across Differents Input Data Dimensions
Cl
´
ecio Elias Silva E. Silva
a
, Salom
˜
ao Machado Mafalda
b
, Emili Silva Bezerra
c
,
Gustavo Moreira Oliveira de Castro
d
, Paulo Chavez dos Santos J
´
unior
e
and Ana Beatriz Alvarez
f
PAVIC Laboratory, University of Acre (UFAC), Rio Branco, Acre, Brazil
Keywords:
Breast Cancer, Semantic Segmentation, Neural Networks, Deep Learning.
Abstract:
Breast cancer is a problem that affects thousands of people every year, early diagnosis is important for the
treatment of this disease. Deep learning methods shows impressive results in identification and segmentation
of breast cancer task. This paper evaluates the impact of input size images on three semantic segmentation
architectures applied to breast tumour ultrasound, in U-net, SegNet and DeepLabV3+. In order to (compre-
hensively) evaluate each architecture, 5-fold cross validation was carried out, thus reducing the impact of
variations in validation and training sets. In addition, the performance of the analyzed architectures was mea-
sured using the IoU and Dice metrics. The results showed that the DeepLabV3+ architecture performed better
than the others architectures in segmenting breast tumours, achieving an IoU of 0.70 and Dice of 0.73, with
the input dimension of the images being 128 × 128.
1 INTRODUCTION
Breast cancer is caused by the disorderly proliferation
of abnormal cells in the breast that form a tumor that
can invade other organs (Doi, 2007). Ultrasound has
been one of the most commonly used medical imag-
ing modalities for the assessment of breast masses.
It is also more accessible and cheaper than magnetic
resonance imaging (Athira et al., 2023).
The evaluation of ultrasound (US) breast images
requires extensive knowledge in this field, since this
task involves identifying features of malignant and
benign breast masses on the images (Gharekhanloo
et al., 2018). To assist professionals in interpret-
ing these images, various computer-aided diagnosis
(CAD) systems have been developed (Doi, 2007).
The segmentation of nodules is of enormous impor-
tance in CAD systems, as its correct segmentation al-
lows a more accurate analysis of the morphological
features of breast tumors (Jahwar and Abdulazeez,
2022). However, automatic segmentation of US im-
a
https://orcid.org/0009-0000-1599-1167
b
https://orcid.org/0000-0002-2172-9402
c
https://orcid.org/0000-0003-4519-8332
d
https://orcid.org/0009-0002-4014-8803
e
https://orcid.org/0009-0004-5886-6541
f
https://orcid.org/0000-0003-3403-8261
ages poses a significant challenge due to the low con-
trast of US images, the presence of speckle noise, and
the considerable variety in sizes and shapes of breast
nodules (Gharekhanloo et al., 2018).
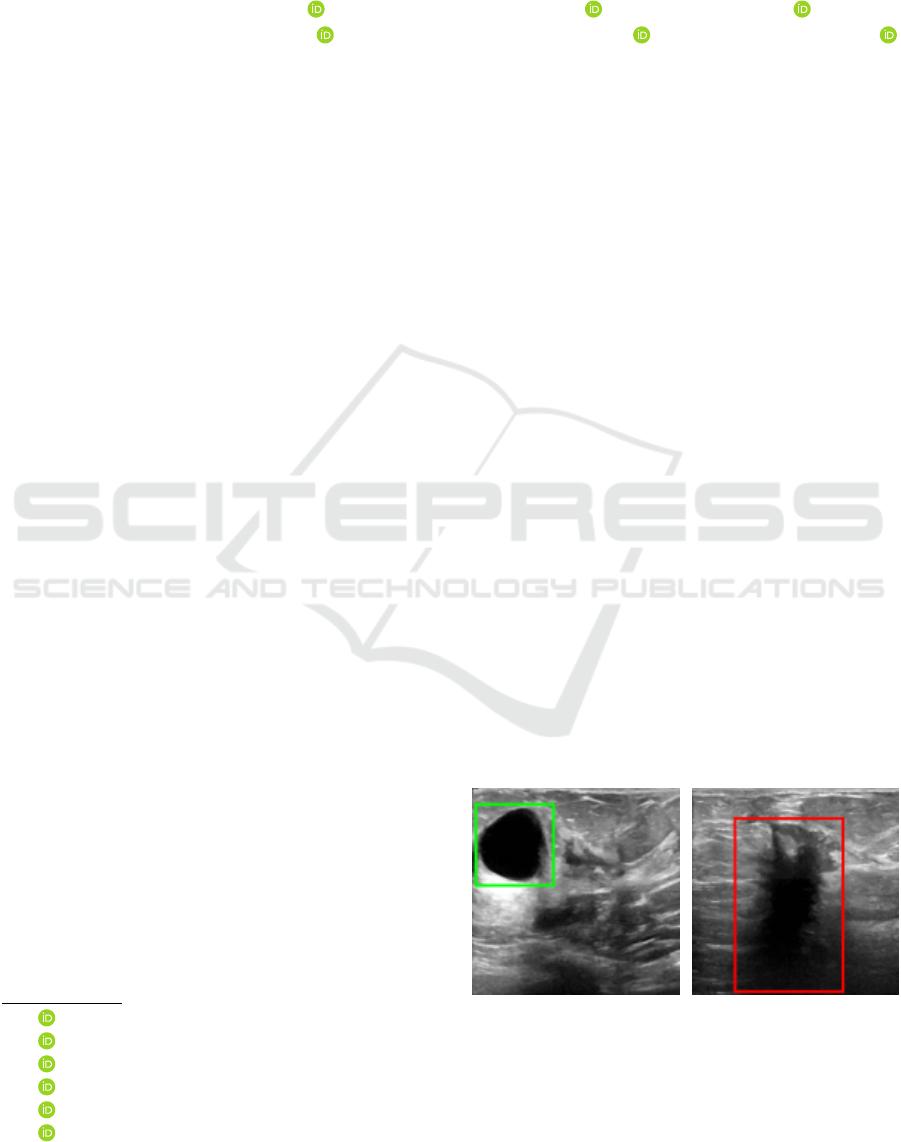
Figure 1 illustrates the use of ultrasound images
to examine breast nodules. Figure 1.a shows an ultra-
sound image of a breast with a benign tumor, showing
a darker area (highlighted by the green square), with
well-defined edges and shape; Figure 1.b shows an
image of a breast with a malignant tumor, with a dark
spot is highlighted (by the red rectangle), with unclear
shape and edges.
(a) Breast US with benign
tumor.
(b) Breast US with malig-
nant tumor.
Figure 1: Breast ultrasound images examples.
Accurate segmentation of breast masses in US im-
ages involves identification and precise delineation of
354
Silva, C., Mafalda, S., Bezerra, E., Oliveira de Castro, G., Santos Júnior, P. and Alvarez, A.
Comparision Through Architectures of Semantic Segmentation in Breast Ultrasound Images Across Differents Input Data Dimensions.
DOI: 10.5220/0012322500003657
Paper published under CC license (CC BY-NC-ND 4.0)
In Proceedings of the 17th International Joint Conference on Biomedical Engineering Systems and Technologies (BIOSTEC 2024) - Volume 2, pages 354-361
ISBN: 978-989-758-688-0; ISSN: 2184-4305
Proceedings Copyright © 2024 by SCITEPRESS – Science and Technology Publications, Lda.
the areas representing the masses, which allows more
detailed analysis of their characteristics (Yu et al.,
2021). One factor that can directly affect segmen-
tation quality and performance is the resolution of
US images, which varies depending on the equipment
used. The smaller the pixel size, the better fine de-
tails can be captured, which can help in the accurate
segmentation of masses (Ploquin et al., 2015). On the
other hand, a smaller pixel size can result in a loss of
detail and affect the quality of the segmentation.
In addition, the low contrast in US images also
represents a challenge for automatic segmentation.
The presence of speckle noise in US images can
make it difficult to correctly identify breast nodules
boundaries. The wide variation in size and shape
of breast masses also contributes to the complexity
of automatic segmentation in US images (Gokhale,
2009). This diversity requires robust and adaptable al-
gorithms that can handle different scenarios and guar-
antee reliable results (Ayana et al., 2022).
This paper investigates the influence of input im-
age size on the performance of semantic segmentation
neural networks applied to the most commonly used
state-of-the-art breast ultrasound images.
By investigating the influence of different input
image sizes on the performance of these architec-
tures, the research aims to provide valuable informa-
tion to optimize the segmentation process of breast
ultrasound images, which will ultimately contribute
to more accurate and reliable diagnoses of benign and
malignant breast cancer nodules.
2 DEEP NEURAL NETWORK
ARCHITECTURES
In recent years, several studies have been developed
for disease classification, identification, and segmen-
tation in medical images based on deep learning neu-
ral networks (Byra et al., 2020; Ayana et al., 2022).
Neural networks automatically extract features from
images related to some kind of anomaly, unlike clas-
sical digital image processing techniques (Sun et al.,
2022). The following architectures are most com-
monly used in the literature: U-net (Ronneberger
et al., 2015), DeepLabV3+ (Ayana et al., 2022) and
SegNet (Yurtkulu et al., 2019). This paper presents
an comparation through these three architectures.
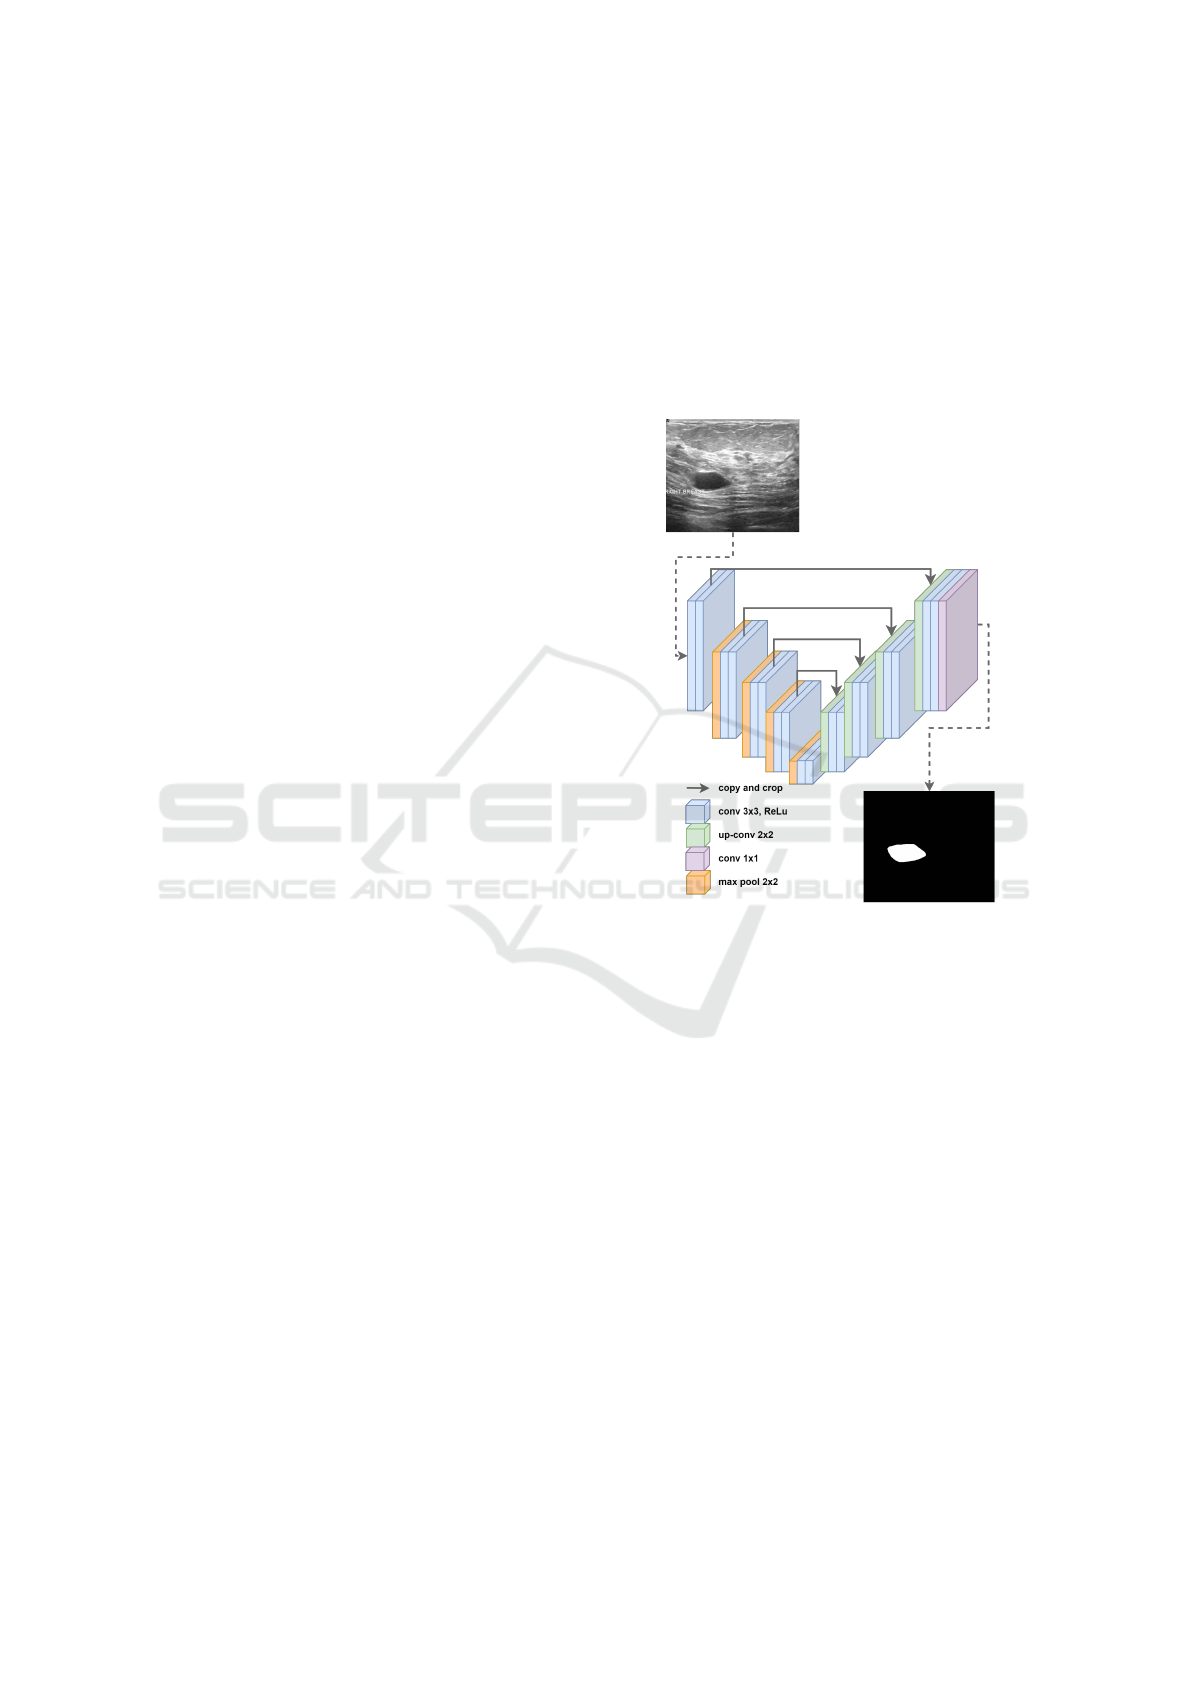
2.1 U-Net
Proposed by (Ronneberger et al., 2015), U-Net is
a semantic segmentation neural network architecture
originally designed for medical image segmentation
tasks such as segmenting blood vessels and brain tu-
mors. U-Net has two main components that gives it
the “U” shape: the encoder path to map network in-
puts to feature map representations by convolutions
and max-pooling; and the decoder path to take that
feature representation as input using up-convolutions
and concatenations that are used for localizing object
boundaries. The architecture has 23 convolution lay-
ers, as illustrated in Figure 2.
Figure 2: An ilustration of U-Net archtecture. The gray ar-
rows indicate the skip connections that concatenate the en-
coder feature map with the decoder, which helps the back-
ward flow of gradients for improved training. It consists of
a contracting path and an expansive path. The contracting
path follows the typical architecture of a convolutional net-
work.
The ability to handle limited amounts of data, ro-
bustness to variable image resolutions, and success-
ful application to complex segmentation tasks are fea-
tures of this architecture (Ronneberger et al., 2015).
2.2 SegNet
The SegNet architecture was proposed by (Badri-
narayanan et al., 2017), and is based on the VGG
family by the same author with the primary goal of
being used in scene understanding applications. With
a smaller total number of parameters than other archi-
tectures, it has better memory efficiency and speed.
Segnet has an encoder-decoder architecture followed
by pixel-level classification. The advantage of SegNet
is in the way the decoder increases the sampling of its
Comparision Through Architectures of Semantic Segmentation in Breast Ultrasound Images Across Differents Input Data Dimensions
355
lower-resolution input feature maps. Specifically, the
decoder uses pooling indices computed in the max-
pooling phase of the corresponding encoder to per-
form non-linear upsampling. This eliminates the need
to learn how to increase resolution. In this way, high-
resolution details are preserved in the segmented im-
age (Badrinarayanan et al., 2017; Cui et al., 2023).
The Figure 3 illustrates the SegNet architecture.
Figure 3: An illustration of the SegNet architecture. There
are no fully connected layers and hence it is only convolu-
tional. A decoder upsamples its input using the transferred
pool indices from its encoder to produce a sparse feature
map(s). It then performs convolution with a trainable filter
bank to densify the feature map. The final decoder output
feature maps are fed to a soft-max classifier for pixel-wise
classification.
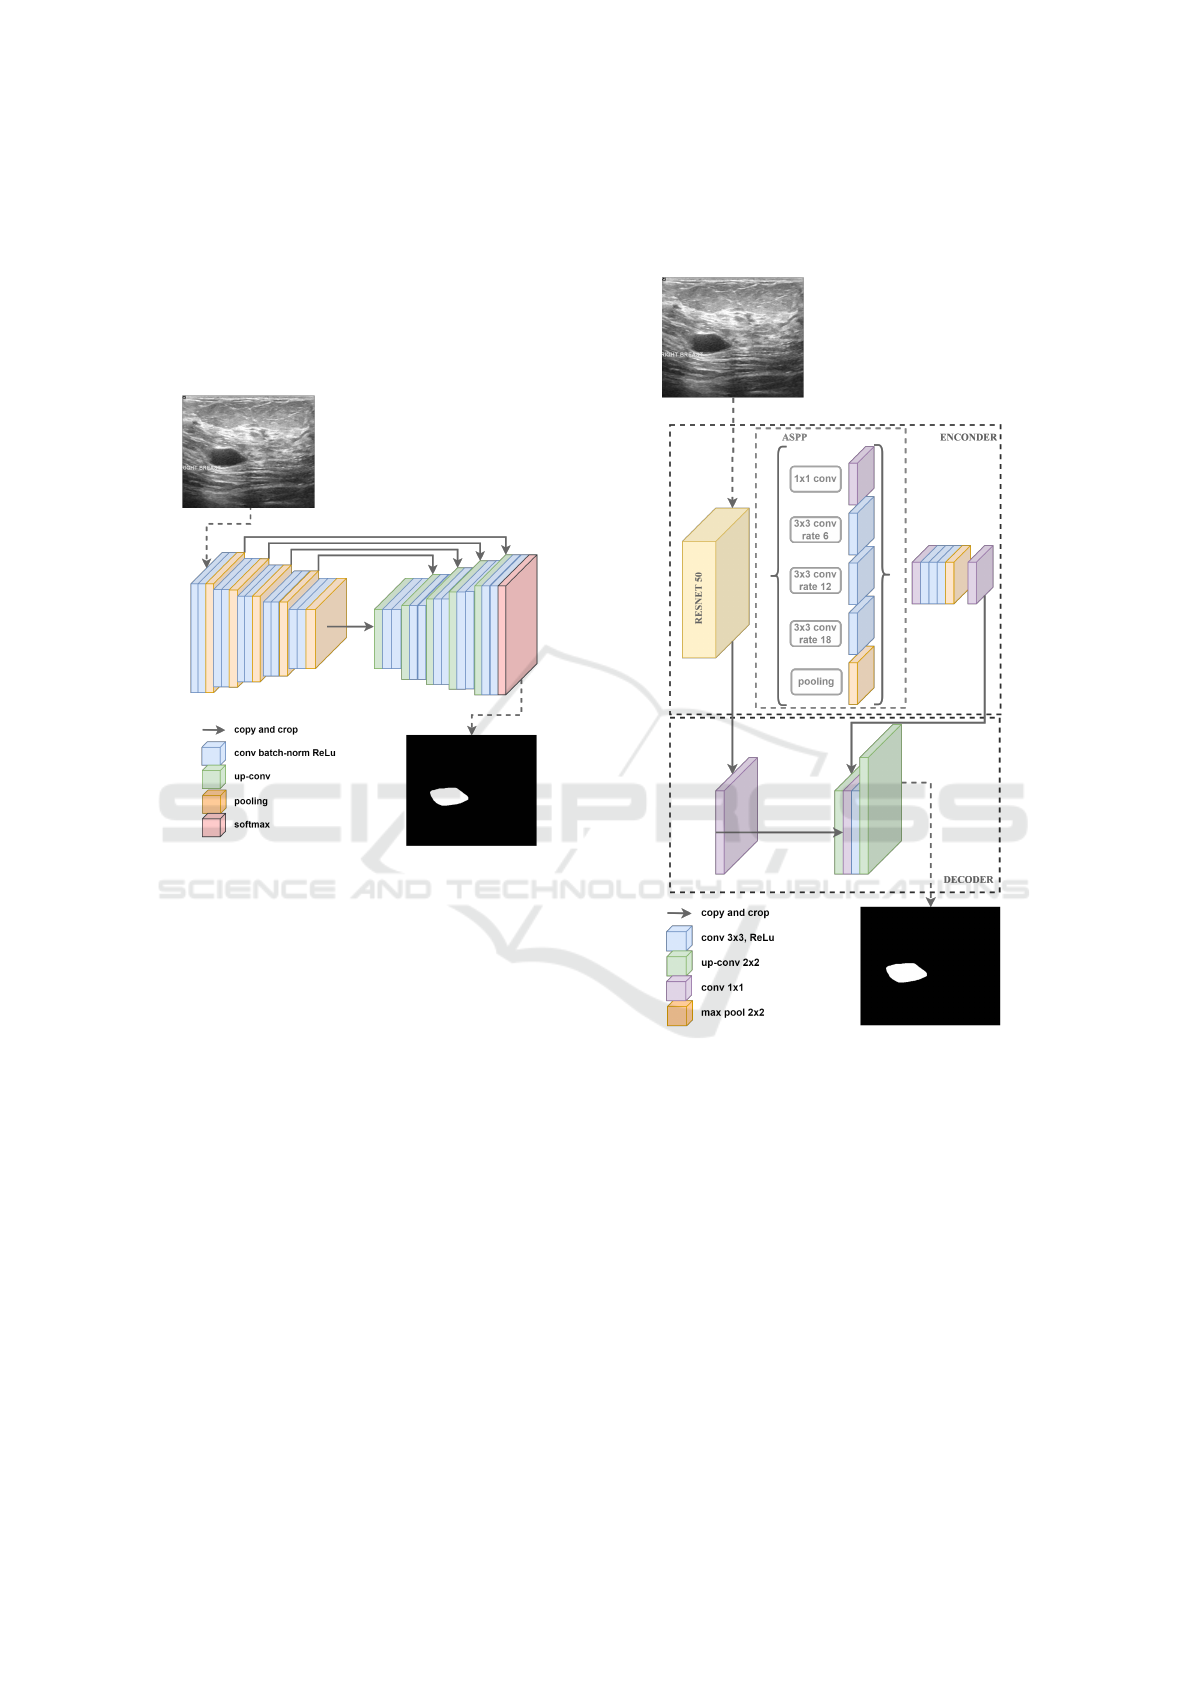
2.2.1 DeepLabV3+
The DeepLab family was proposed by Google re-
searchers (Chen et al., 2017). The third version called
DeepLabV3 is an encoder-decoder network aimed at
performing semantic segmentation tasks. It is capa-
ble of capturing multi-contextual information in its
encoder by grouping features with multi-rate filtering
and pooling operations that expand the receptive field
of neurons, while the final layers of the network can
capture sharper object boundaries, gradually recover-
ing spatial information. DeeplabV3+ adds a simple
but effective decoder module to DeepLabV3, added
to improve segmentation results (Liu et al., 2021).
In addition, DeepLabv3+ extends the Atrous Spa-
tial Pyramid Pooling module, which explores con-
volutional characteristics at various scales, applying
atrous convolutions at different rates (Yurtkulu et al.,
2019). The Figure 4 illustrates the DeepLabV3+ ar-
chitecture.
Figure 4: An ilustration of the DeeplabV3+ architecture.
The reason for using a Atrous Spatial Pyramid Pooling is
that it has been shown that as the sampling rate increases,
the number of valid filter weights (i.e., weights applied to
the valid feature region instead of padded zeros) becomes
smaller (Yurtkulu et al., 2019).
3 MATERIALS AND METHODS
3.1 BUS Dataset
The dataset used is called Breast Ultrasound Im-
ages (BUSI) and is made up of breast ultrasound im-
ages obtained from ultrasounds of 600 female patients
aged between 25 and 75. The BUSI dataset was pub-
lished in 2018 and has a collection of 780 images,
HEALTHINF 2024 - 17th International Conference on Health Informatics
356
with average dimensionality of 500x500 pixels. The
images were grouped by medical experts into three
categories: benign tumor, malignant tumor and nor-
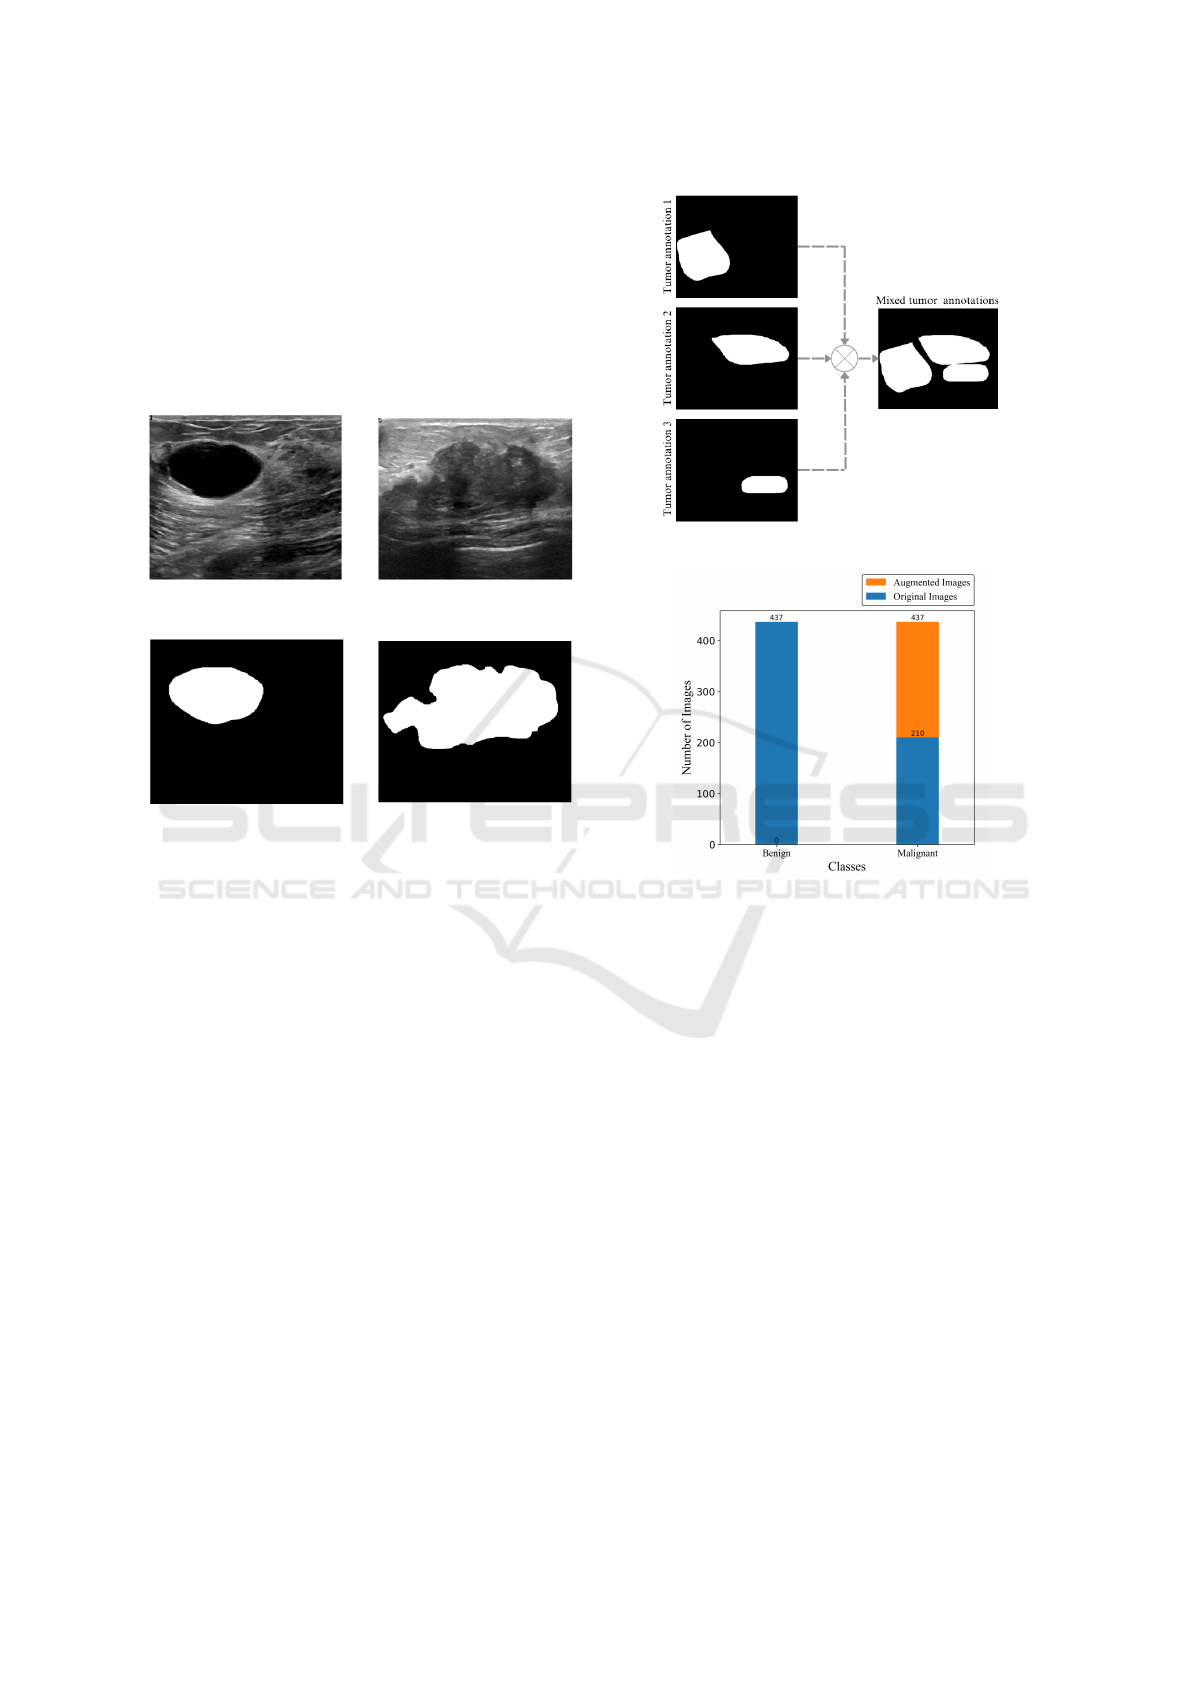
mal images. Figure 5 shows examples of images from
BUSI dataset. In total, the dataset consists of 437 im-
ages of benign tumors and 210 images of malignant
tumors and 133 images with no tumors present (Al-
Dhabyani et al., 2020). In this article, only the images
with tumors present were used.
(a) An image of a benign
tumor.
(b) An image of a malig-
nant tumor.
(c) Annotation of benign
tumor.
(d) Annotation of malig-
nant tumor.
Figure 5: Examples of breast ultrasound images from the
Dataset and their respective annotations.
3.2 Data Pre-Processing
For the neural networks semantic segmentation train-
ing, the annotations made by the experts were merged
into a single mask. Figure 6 shows the process for
merging 3 annotations of the tumors to form a single
output image.
In addition, in order to assess the dimensionality
impact of the input data on the segmentation perfor-
mance, five sets of data were created for training, dif-
fering only in the size of the images. The dimensions
established and analyzed in this article were: 32×32,
64×64, 128×128, 256×256 and 512× 512. Finally,
the data was divided into training, validation and test-
ing sets, following the proportion of 80%, 10% and
10% respectively.
Images of the malignant tumor class were aug-
mented to balance the dataset. The techniques used
were Horizontal Flip, Vertical Flip, Rotation 90º and
Transpose. 437 images were obtained for both the
malignant and benign classes, as shown in Figure 7.
Figure 6: Illustration of the annotation merging process.
Figure 7: Illustration graphically representing the total
number of images.
3.3 Deep Neural Network Training
The dimensionality of the data varies in different pro-
portions, from 32 to 512, and the architectures remain
with the same number of layers in all experiments.
For this reason, the regularization technique called
Early Stopping was used to avoid overffiting. This
method looks at the performance of the training data
and the validation set, this way when the model is fit-
ting the training data and making errors in the vali-
dation data, i.e. not generalizing, the method defines
early stopping rules before the model starts to over-
fit. This article used Early Stopping with a patience
of 20, i.e. the model was evaluated with the weights
20 epochs after overfitting.
The other hyperparameters used to train the archi-
tectures are shown in Table 1.
To illustrate the training process, Figure 8 shows
the loss and learning curve of the Segnet model for
the 64 × 64 dimension. A maximum of 100 epochs
was used for all training.
Comparision Through Architectures of Semantic Segmentation in Breast Ultrasound Images Across Differents Input Data Dimensions
357
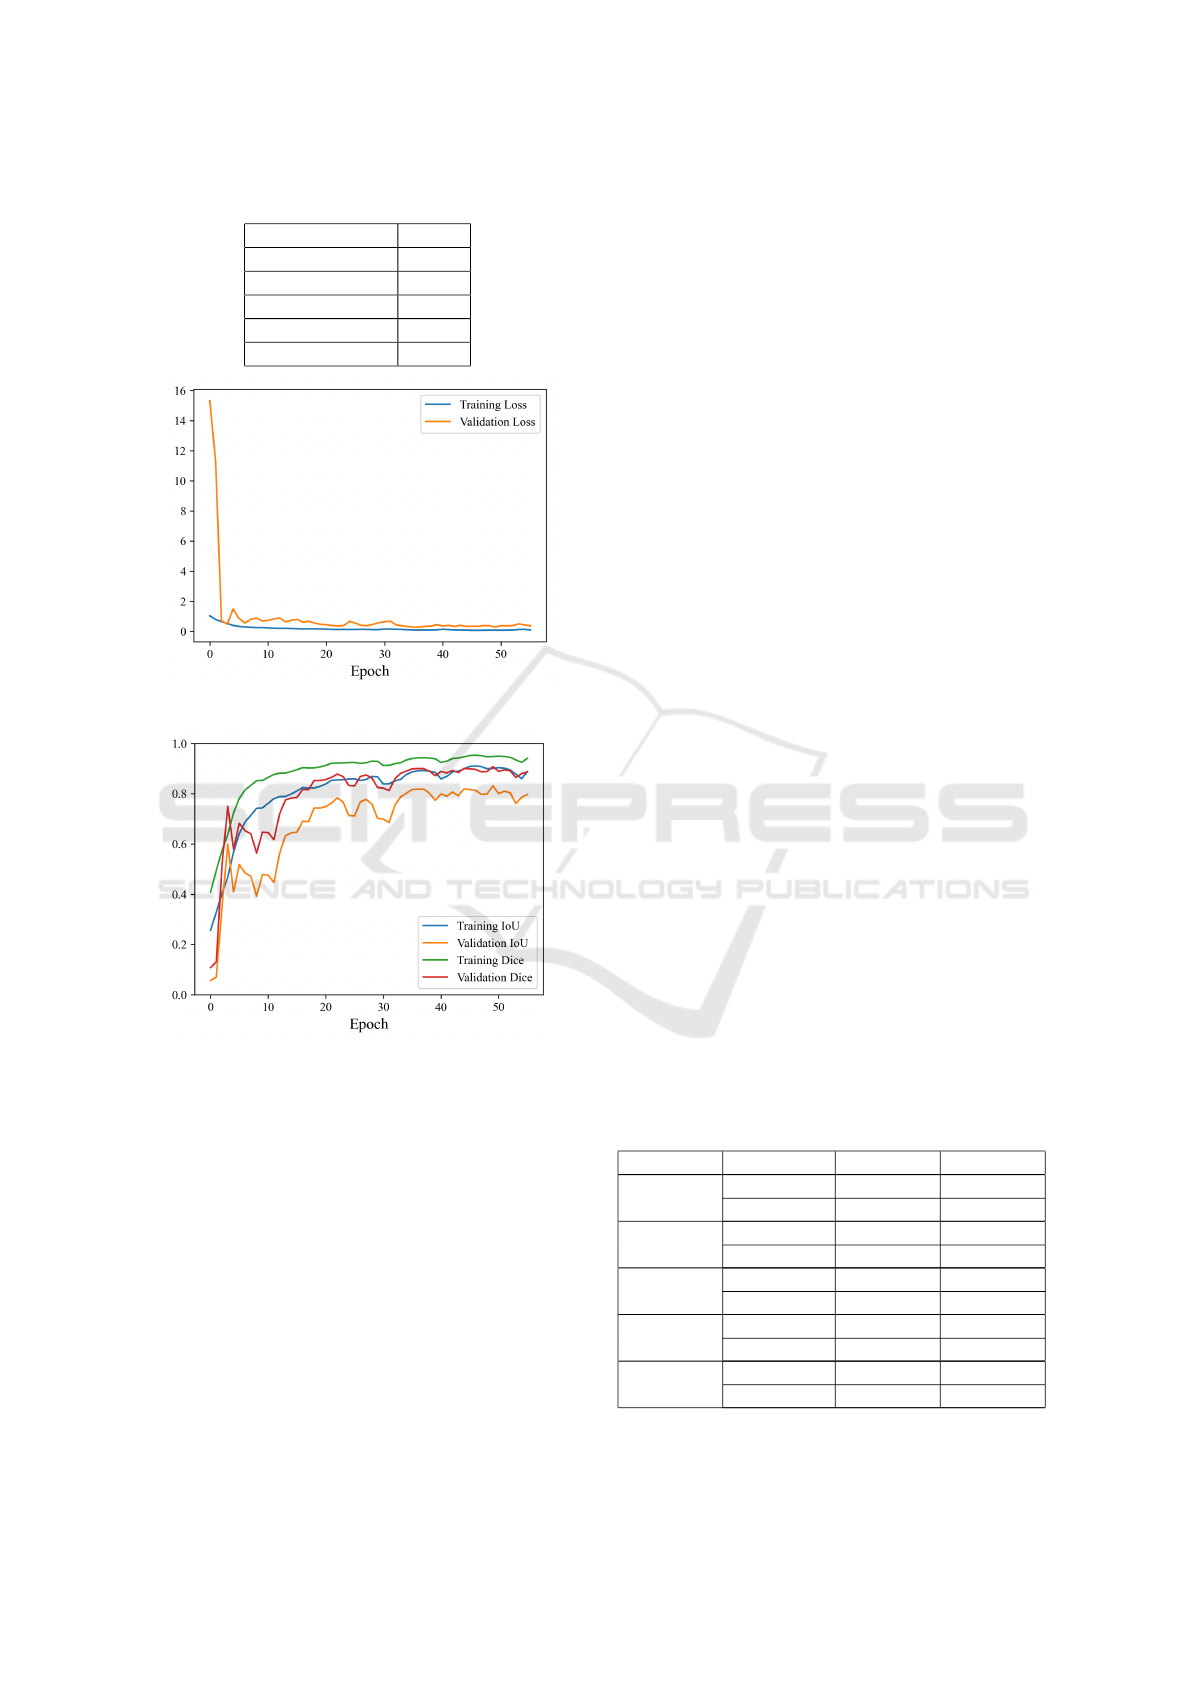
Table 1: Hyperparameter table applied to training.
Hyperparameter Value
Learning rate 0.001
Batch-size 32
Epochs 100
Patience 20
Optimizer Adam
(a) Training and validation loss curve.
(b) Training and validation metrics.
Figure 8: Comparison of loss curve and metrics for training
and validation.
A K-Fold cross-validation (K = 5) was carried
out. This means that the data set was randomly di-
vided into five distinct parts, and the models were
trained and validated five times, alternating the train-
ing and validation parts in each iteration. This proce-
dure helps to evaluate the model’s performance more
comprehensively, reducing the impact of variations in
the training and validation sets and providing a reli-
able estimation of its ability to generalize (Bishop and
Nasrabadi, 2006).
For the results, the average of the performance
metrics obtained from cross-validation for each
method and input image size and class was calculated.
The differences in the results of the 5-Folds, for the
same input image size, showed an overall average of
approximately 0.06.
The low variance indicates that the models per-
form similarly in all parts of the dataset during the
cross-validation process, as proven by (Ostertagova
et al., 2014). Therefore, the results obtained in any of
the trained models can be considered representative
for all of them, providing a stable assessment of their
ability to generalize.
4 RESULTS AND DISCUSSION
This section presents the results obtained for the ex-
periments carried out for the three architectures eval-
uated: U-Net, SegNet and DeepLabV3+.
4.1 U-Net
Table 2 shows the results of the tests carried out with
the U-net architecture. The first column shows the in-
put image sizes, the second column refers to the seg-
mented classes, while the last two columns show the
IoU and Dice. IoU and Dice for the benign tumor
class varies between 0.57 − 0.65 and 0.60 −0.67 with
a standard deviation between 0.32 − 0.42 and 0.34 −
0.40, respectively. For the malignant tumor class, IoU
and Dice varies between 0.31 − 0.56 and 0.35 − 0.60
with a standard deviation between 0.32 − 0.40 and
0.34 − 0.37, respectively.
Superior performance can be seen when the
model’s input image dimension is set to 64×64. With
IoU of 0.65 and Dice of 0.67 for the benign tumor
class and IoU of 0.56 and Dice of 0.60 for the ma-
lignant tumor class. Obtaining an average for both
classes of 0.60 for IoU and 0.64 for Dice.
Table 2: Segmentation performance scores (and standard
deviation) achieved by U-Net for different input image
sizes.
Size Class IoU Dice
32×32
Benign 0.65±0.38 0.67±0.36
Malignant 0.53±0.36 0.57±0.36
64×64
Benign 0.65±0.37 0.67±0.38
Malignant 0.56±0.35 0.60±0.35
128 × 128
Benign 0.63±0.40 0.65±0.40
Malignant 0.52±0.36 0.56±0.37
256 × 256
Benign 0.62±0.41 0.64±0.41
Malignant 0.39±0.40 0.44±0.37
512 × 512
Benign 0.57±0.42 0.60±0.42
Malignant 0.31±0.32 0.35±0.34
HEALTHINF 2024 - 17th International Conference on Health Informatics
358
Table 3: Segmentation performance scores (and standard
deviation) achieved by SegNet for different input image
sizes.
Size Class IoU Dice
32 × 32
Benign 0.59±0.42 0.60±0.45
Malignant 0.46±0.43 0.51±0.43
64 × 64
Benign 0.59±0.41 0.61±0.40
Malignant 0.57±0.38 0.61±0.38
128 × 128
Benign 0.61±0.39 0.64±0.39
Malignant 0.59±0.37 0.62±0.37
256×256
Benign 0.66±0.39 0.69±0.39
Malignant 0.59±0.38 0.63±0.38
512 × 512
Benign 0.65±0.38 0.68±0.39
Malignant 0.42±0.37 0.46±0.38
4.2 SegNet
Table 3 shows the results of the tests carried out with
the SegNet architecture. The first column shows the
input image sizes, the second column refers to the
segmented classes, while the last two columns show
the IoU and Dice. IoU and Dice for the benign tumor
class varies between 0.59 − 0.66 and 0.60 −0.69 with
a standard deviation between 0.38 − 0.42 and 0.39 −
0.45, respectively. For the malignant tumor class, IoU
and Dice varies between 0.42 − 0.59 and 0.46 − 0.63
with a standard deviation between 0.37 − 0.43 and
0.37 − 0.43, respectively.
The Table 3 shows that the results obtained are
similar to those of U-Net. The standard deviation for
both benign and malignant classes was between 0.37
and 0.44 for IoU and 0.37 and 0.45 for Dice.
The architecture performed best in the 256 × 256
dimension. With IoU of 0.66 and Dice of 0.69 for the
benign and IoU of 0.59 and Dice of 0.63 for malignant
tumor class. The average IoU and Dice were 0.63 and
0.66, respectively.
4.3 DeepLabV3+
Table 4 shows the results of the tests carried out
with the DeepLabV3+ architecture. The first col-
umn shows the input image sizes, the second col-
umn refers to the segmented classes, while the last
two columns show the IoU and Dice. IoU and Dice
for the benign tumor class varies between 0.68− 0.77
and 0.69 − 0.79 with a standard deviation between
0.33 − 0.40 for both metrics. For the malignant tu-
mor class, IoU and Dice varies between 0.51 − 0.63
and 0.53 − 0.66 with a standard deviation between
0.35 − 0.40 for both metrics.
The architecture performed best in the 128 × 128
dimension. With average IoU and Dice of 0.70 and
0.73, respectively.
Table 4: Segmentation performance scores (and standard
deviation) achieved by DeeplabV3+ for different input im-
age sizes.
Size Class IoU Dice
32 × 32
Benign 0.69±0.36 0.73±0.35
Malignant 0.54±0.36 0.61±0.36
64 × 64
Benign 0.68±0.38 0.71±0.38
Malignant 0.60±0.39 0.63±0.38
128×128
Benign 0.77±0.33 0.79±0.33
Malignant 0.63±0.35 0.66±0.35
256 × 256
Benign 0.73±0.37 0.74±0.37
Malignant 0.59±0.39 0.61±0.39
512 × 512
Benign 0.68±0.40 0.69±0.40
Malignant 0.51±0.40 0.53±0.40
4.4 Comparison Through Architectures
When comparing the three architectures imple-
mented, we can see a good performance in all archi-
tectures. U-net achieved the best performance with
an input size of 64 ×64, as shown in section 4.1. Seg-
Net achieved better performance with an input size of
256 × 256, as presented in section 4.2, with averages
of 0.60 for IoU and 0.64 for Dice. DeepLabV3+ per-
formed best with an input size of 128 ×128, as shown
in section 4.3, with averages of 0.63 and 0.66 for IoU
and Dice, respectively. The results obtained for the
DeepLabV3+ architecture were superior in all dimen-
sions tested for the other architectures, as shown in
Table 5, with an average of 0.70 and 0.73 for IoU and
Dice, respectively.
To illustrate the implementation of the three ana-
lyzed architectures, Figure 9 shows an example cre-
ated for U-net, SegNet, and DeepLabV3+. The first
column shows the original image, the second column
shows the ground truth, and the third column the pre-
diction of the architecture. The figure shows a small
tumor with poorly defined edges. In the figure, it
can be seen that DeepLabV3+ correctly segmented
the benign tumor (in orange), while SegNet misclas-
sified the tumor, i.e., predicted it as a malignant tumor
(green) even though it was benign (orange). U-Net’s
prediction was inferior to the other two architectures
because it predicted two classes simultaneously. For
tumors with large proportions and well-defined edges,
an example has been created and is shown in Figure
10. It can be seen that DeepLabV3+ and U-Net cor-
rectly segmented the benign tumor (in orange), while
SegNet prediction was inferior to the other two archi-
tectures because it predicted two classes simultane-
ously.
Comparision Through Architectures of Semantic Segmentation in Breast Ultrasound Images Across Differents Input Data Dimensions
359
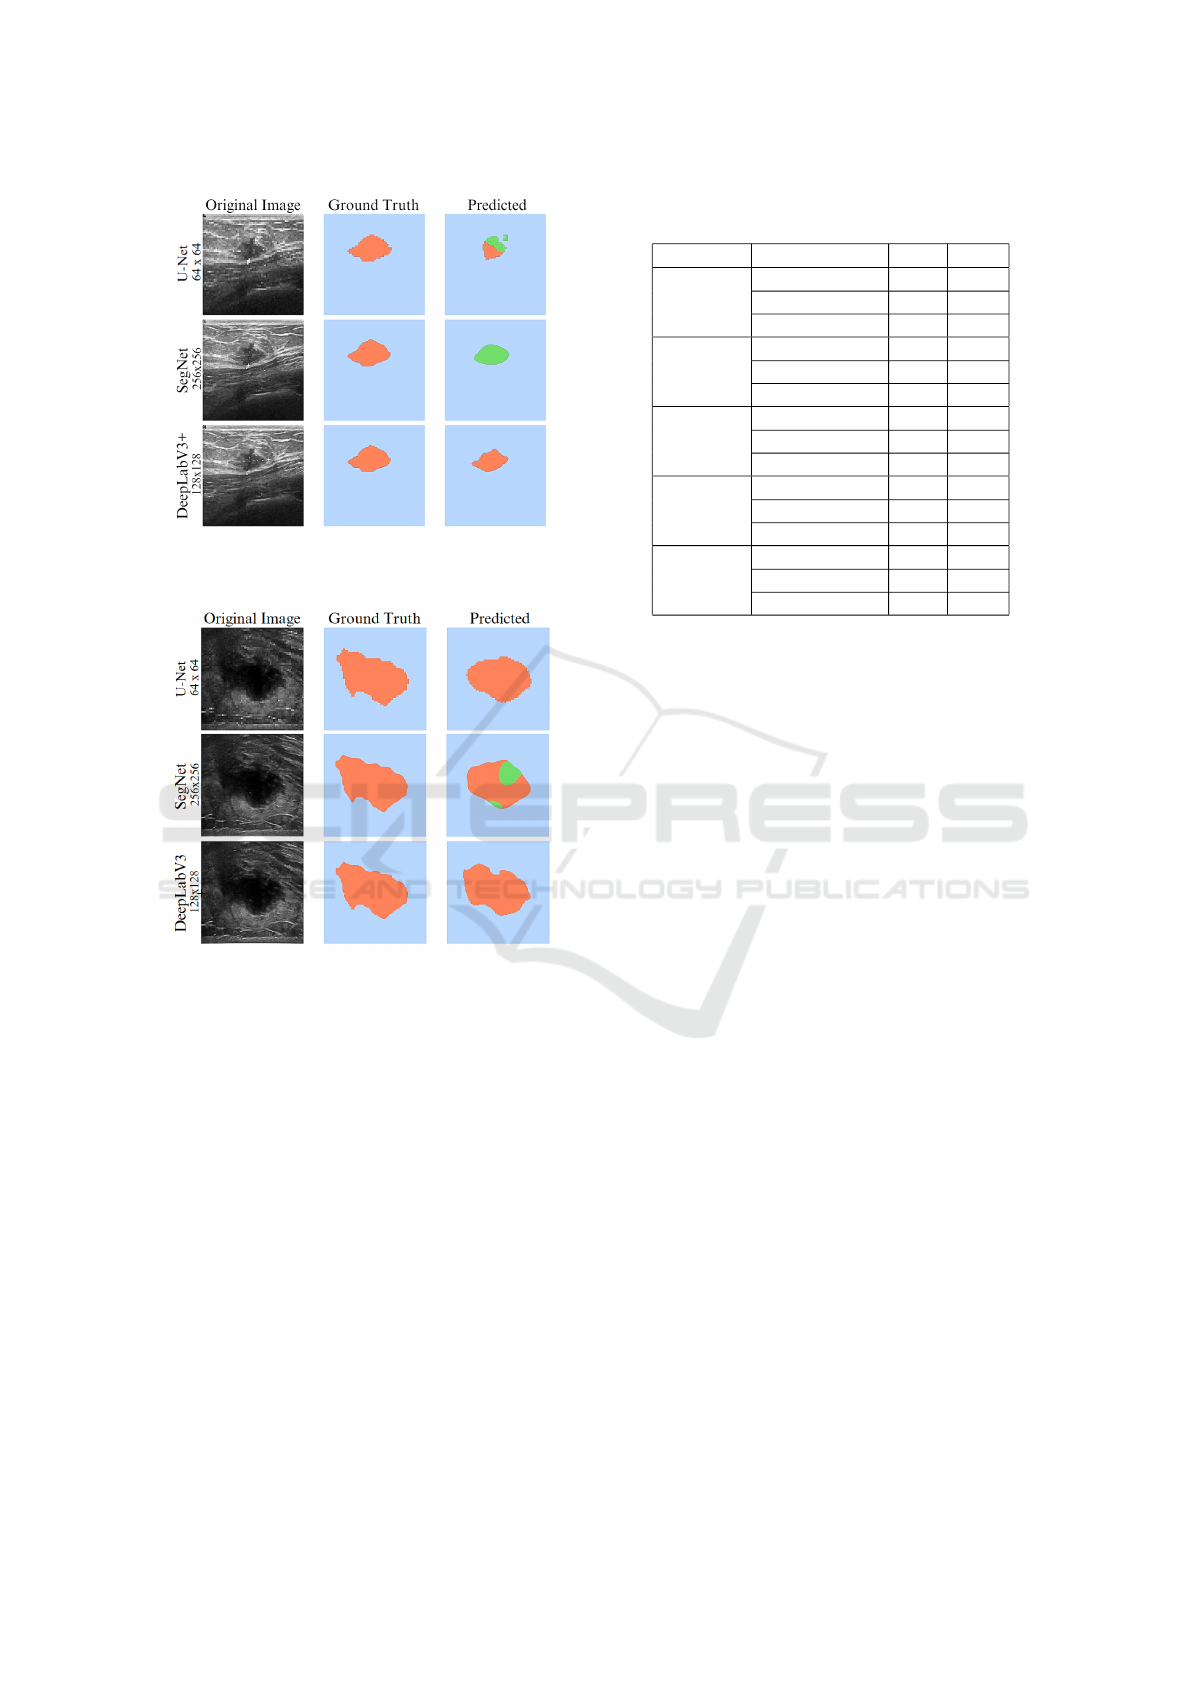
Figure 9: Example of tumor segmentation with small tumor
with poorly defined edges at different image sizes on the
analyzed architectures.
Figure 10: Example of tumor segmentation with large pro-
portions and well-defined edges at different image sizes on
the analyzed architectures.
5 CONCLUSION
In this paper was evaluated the impact of the image
input size on semantic segmentation models applied
to breast tumor ultrasound, where the architectures
selected were U-net, SegNet and DeepLabV3+. The
architectures were evaluated using IoU and Dice. In
addition, to check the generalization capability of seg-
mentation architectures models was used independent
training-test experiments based on the k-fold cross-
validation method.
It was observed that the three architectures tested
performed differently in terms of image dimensions.
The U-net, Segnet and DeepLabV3+ architectures
performed best with input dimensions of 64 × 64,
256 × 256 and 128 × 128, respectively. These find-
Table 5: Segmentation performance scores achieved by the
three architectures.
Size Architectures IoU Dice
32×32
U-net 0.59 0.62
SegNet 0.54 0.56
DeepLabV3+ 0.62 0.67
64×64
U-net 0.60 0.64
SegNet 0.58 0.61
DeepLabV3+ 0.64 0.67
128×128
U-net 0.57 0.61
SegNet 0.60 0.63
DeepLabV3+ 0.70 0.73
256×256
U-net 0.50 0.54
SegNet 0.63 0.66
DeepLabV3+ 0.66 0.68
512×512
U-net 0.44 0.47
SegNet 0.54 0.57
DeepLabV3+ 0.59 0.61
ings indicate that the sizing of input images is a crit-
ical factor in obtaining accurate and reliable results
in breast tumors segmentation. Each model showed
different preferences in relation to dimension, which
highlights the importance of a careful analysis of the
specific characteristics of each method when applying
them to different clinical and research contexts.
Furthermore, the significant variation in IoU and
Dice results for different tumor classes emphasizes
the need to consider the peculiarities of each tumor
type when choosing the appropriate image dimension
for segmentation. This detailed understanding can op-
timize the accuracy of the segmentation process and,
consequently, improve the detection and follow-up of
breast tumors.
According to the results, DeepLabV3+, among all
the architectures analyzed, obtained the best perfor-
mance in semantic segmentation of breast tumors. As
expected, segmentation performance improves as net-
work depth increases. This behavior happens because
deeper networks extracted more subtle features that
distinguish normal and abnormal patterns in breast
tissue, while shallower networks extracted global im-
age features.
For approximately two decades, researchers de-
veloped CAD systems with high generalization capa-
bility that are useful in clinical practice. A compar-
ison of the different data input dimensions revealed
their potential to increase breast screening efficiency
and effectiveness. Hence, the experimental results en-
courage the use of DeepLabV3+ model within a CAD
system for the automated segmentation of breast tu-
mors.
Therefore, the appropriate choice of dimension is
a fundamental role in the effectiveness and accuracy
HEALTHINF 2024 - 17th International Conference on Health Informatics
360

of the predictions of semantic segmentation models.
This information is valuable for guiding future re-
search and clinical applications aimed at improving
the diagnosis and treatment of this important cancer
pathology.
ACKNOWLEDGEMENTS
The work presented in this paper was supported by
the Pesquisa Aplicada em Vis
˜
ao e Intelig
ˆ
encia Com-
putacional (PAVIC) project at Universidade Federal
do Acre, Brazil.
REFERENCES
Al-Dhabyani, W., Gomaa, M., Khaled, H., and Fahmy, A.
(2020). Dataset of breast ultrasound images. Data in
brief, 28:104863.
Athira, K., Dharmarajan, J. P., Vijaykumar, D., and Sub-
banna, N. (2023). Analysis of the various techniques
used for breast segmentation from mammograms. In
2023 International Conference on Distributed Com-
puting and Electrical Circuits and Electronics (ICD-
CECE), pages 1–7. IEEE.
Ayana, G., Dese, K., Raj, H., Krishnamoorthy, J., and Kwa,
T. (2022). De-speckling breast cancer ultrasound
images using a rotationally invariant block matching
based non-local means (ribm-nlm) method. Diagnos-
tics, 12(4):862.
Badrinarayanan, V., Kendall, A., and Cipolla, R. (2017).
Segnet: A deep convolutional encoder-decoder ar-
chitecture for image segmentation. IEEE transac-
tions on pattern analysis and machine intelligence,
39(12):2481–2495.
Bishop, C. M. and Nasrabadi, N. M. (2006). Pattern recog-
nition and machine learning, volume 4. Springer.
Byra, M., Jarosik, P., Szubert, A., Galperin, M., Ojeda-
Fournier, H., Olson, L., O’Boyle, M., Comstock, C.,
and Andre, M. (2020). Breast mass segmentation in
ultrasound with selective kernel u-net convolutional
neural network. Biomedical Signal Processing and
Control, 61:102027.
Chen, L.-C., Papandreou, G., Kokkinos, I., Murphy, K., and
Yuille, A. L. (2017). Deeplab: Semantic image seg-
mentation with deep convolutional nets, atrous convo-
lution, and fully connected crfs. IEEE transactions on
pattern analysis and machine intelligence, 40(4):834–
848.
Cui, W., Meng, D., Lu, K., Wu, Y., Pan, Z., Li, X., and Sun,
S. (2023). Automatic segmentation of ultrasound im-
ages using segnet and local nakagami distribution fit-
ting model. Biomedical Signal Processing and Con-
trol, 81:104431.
Doi, K. (2007). Computer-aided diagnosis in medical imag-
ing: historical review, current status and future po-
tential. Computerized medical imaging and graphics,
31(4-5):198–211.
Gharekhanloo, F., Haseli, M. M., and Torabian, S. (2018).
Value of ultrasound in the detection of benign and ma-
lignant breast diseases: a diagnostic accuracy study.
Oman Medical Journal, 33(5):380.
Gokhale, S. (2009). Ultrasound characterization of breast
masses. Indian Journal of Radiology and Imaging,
19(03):242–247.
Jahwar, A. F. and Abdulazeez, A. M. (2022). Segmen-
tation and classification for breast cancer ultrasound
images using deep learning techniques: a review. In
2022 IEEE 18th International Colloquium on Signal
Processing & Applications (CSPA), pages 225–230.
IEEE.
Liu, M., Fu, B., Xie, S., He, H., Lan, F., Li, Y., Lou,
P., and Fan, D. (2021). Comparison of multi-source
satellite images for classifying marsh vegetation using
deeplabv3 plus deep learning algorithm. Ecological
Indicators, 125:107562.
Ostertagova, E., Ostertag, O., and Kov
´
a
ˇ
c, J. (2014).
Methodology and application of the kruskal-wallis
test. Applied mechanics and materials, 611:115–120.
Ploquin, M., Basarab, A., and Kouame, D. (2015). Res-
olution enhancement in medical ultrasound imaging.
Journal of Medical Imaging, 2(1):171.
Ronneberger, O., Fischer, P., and Brox, T. (2015). U-
net: Convolutional networks for biomedical image
segmentation. In Medical Image Computing and
Computer-Assisted Intervention–MICCAI 2015: 18th
International Conference, Munich, Germany, October
5-9, 2015, Proceedings, Part III 18, pages 234–241.
Springer.
Sun, Y., Yang, H., Zhou, J., and Wang, Y. (2022). Issmf:
Integrated semantic and spatial information of multi-
level features for automatic segmentation in prenatal
ultrasound images. Artificial Intelligence in Medicine,
125:102254.
Yu, K., Chen, S., and Chen, Y. (2021). Tumor segmenta-
tion in breast ultrasound image by means of res path
combined with dense connection neural network. Di-
agnostics, 11(9):1565.
Yurtkulu, S. C., S¸ahin, Y. H., and Unal, G. (2019). Se-
mantic segmentation with extended deeplabv3 archi-
tecture. In 2019 27th Signal Processing and Commu-
nications Applications Conference (SIU), pages 1–4.
IEEE.
Comparision Through Architectures of Semantic Segmentation in Breast Ultrasound Images Across Differents Input Data Dimensions
361
