
Agent Simulation Using Path Telemetry for Modeling COVID-19
Workplace Hazard and Risk
David Beymer
1
, Vandana Mukherjee
1
, Anup Pillai
1
, Hakan Bulu
1
, Vanessa Burrowes
2
,
James Kaufman
1,∗
and Ed Seabolt
1
1
IBM Research - Almaden, 650 Harry Rd, San Jose, CA 95120, U.S.A.
2
IBM, 3039 E Cornwallis Rd, Research Triangle Park, NC 27709, U.S.A.
Keywords:
Computer Simulation, Agent-Based Modeling, Epidemiological Modeling, Risk Analysis, Safety
Management.
Abstract:
We present a cloud native agent based simulation of disease transmission hazard and risk in a model of a
particular workplace. When combined with epidemiological data for employee home counties, the simulation
can be used to measure the effect of interventions and building policies on occupational hazard and risk from
an infectious disease, and to compare that hazard and risk to the average risk to the employees in their home
counties based on current outbreak data. We demonstrate this for two particular interventions, varying the
number of employees allowed to work onsite, and enabling/disabling alternate routes at choke points such
as cafeteria checkpoints. We discuss how occupational hazard and risk depends strongly on the details of
workplace layout and policies and propose how the current simulation (and tools like it) can be used to evaluate
policies and procedures for return to work.
1 INTRODUCTION
The pandemic disease COVID-19, caused by
the SARS-CoV-2 virus, disrupted economies and
lifestyles worldwide. As new variants continued to
evolve and emerge, many organizations struggled to
develop consistent and robust guidelines for policies
that supported a ”safe” return to work. The process is
confounded as the rates of viral transmission change
with the evolution of the virus as it adapts to human
host populations as well as to the changing landscape
of host immunity.
Understanding which policies might best support
a ”safe” return to work first requires an agreed defi-
nition of safety, along with quantitative measures for
both hazard and risk (Hosseini et al., 2017; Kumpu-
lainen, 2006; Sage and White, 1980). Assessment of
occupational risk requires quantification of the poten-
tial hazards a person encounters in a workplace envi-
ronment (Daniels et al., 2020). No workplace is com-
pletely free of risk, but in the context of infectious
disease exposure one might classify a workplace as
∗
J. Kaufman is currently with Altos Labs, Bay Area
Institute of Science, 1300 Island Drive, Redwood City, CA
94065, U.S.A.
”safe” if the exposure hazard and disease transmission
risk are less than the corresponding hazards and risks
an individual might face in the same time span had
they not come to the workplace. This baseline risk de-
pends, of course, on interventions, policies, and prac-
tices in their jurisdiction of residence, but the data re-
quired to measure local hazard and risk is currently
available in most jurisdictions through local public
health reporting. In this paper we apply epidemio-
logical compartment modeling (Gopalakrishnan et al.,
2021b; Gopalakrishnan et al., 2021a; Baldassi et al.,
2021; Douglas et al., 2019; Bianco et al., 2021) to the
home counties of employees in a simulated workforce
to drive an agent based simulation of a real workplace.
Agent-based models, which have been used in a
variety of fields such as economics, business, gaming
and the social sciences, construct a simulated environ-
ment of independent agents, from whose simple rules
of interaction an emergent system behavior arises.
Agent based modeling has been used to study how
workplace policies and practices influence workplace
outcomes across a variety of dimensions (Mu
˜
noz and
Iglesias, 2021; Duggirala et al., 2016; Hardy et al.,
2021; Vitins et al., 2016). Some agent-based sys-
tems have included strong spatial support, such as the
use of GIS concepts in the GAMA platform (Tail-
Beymer, D., Mukherjee, V., Pillai, A., Bulu, H., Burrowes, V., Kaufman, J. and Seabolt, E.
Agent Simulation Using Path Telemetry for Modeling COVID-19 Workplace Hazard and Risk.
DOI: 10.5220/0012322400003657
Paper published under CC license (CC BY-NC-ND 4.0)
In Proceedings of the 17th International Joint Conference on Biomedical Engineering Systems and Technologies (BIOSTEC 2024) - Volume 1, pages 417-428
ISBN: 978-989-758-688-0; ISSN: 2184-4305
Proceedings Copyright © 2024 by SCITEPRESS – Science and Technology Publications, Lda.
417

landier et al., 2018), and social simulations built on
top (BEN system (Bourgais et al., 2019)). When
applied to epidemiology, the agent-based model al-
lows for social networks between the agents to be
studied for their impact on viral dynamics. In (Kerr
et al., 2021; Hinch et al., 2021; Chang et al., 2020),
agent networks are formed consisting of households,
schools, workplaces, and random connections for in-
teractions with the community-at-large. An epidemi-
ological model is placed over the agents, and the ef-
fects of different simulated COVID-19 interventions
such as masks, contact tracing, or quarantine can be
studied. With the agent network, one could model,
for instance, how a virus can be transmitted from a
school to a workplace via child-to-parent infection in
a household. The OpenCOVID (Shattock et al., 2022)
agent simulation system constructs an agent network
based on the observation that the number of agent
contacts per day is age-dependent, peaking in mid-
dle age. Transmission between agents takes into con-
sideration the viral load of the infectious agent, the
infectivity factor of the COVID variant, a seasonality
factor, and the immunity of the susceptible agent.
In existing agent-based systems, the spatial loca-
tion of agents is typically modeled at a very coarse
level, such as presence in a household, school, or
workplace. Infection within a specific location is han-
dled by assuming that each agent has a certain num-
ber of contacts, and then these contacts are randomly
chosen from the agents present. One exception is (Is-
lam et al., 2022), where, similar to our work, they
model the detailed movement of agents in a plan map.
Instead of COVID in the workplace, they focus on
modeling student agents in an campus setting, evalu-
ating the placement of classroom seating to mitigate
the spread of COVID.
In the context of infectious disease work, we de-
fine workplace hazard as the cumulative contact time
between all pairs of people. Contact is defined in
terms of a configurable hazard radius. Risk is then the
pairwise transmission risk, as defined by mathemati-
cal epidemiology. Actual county level public health
data determines the average disease burden (as a func-
tion of time) in the employees home county, and epi-
demiological modeling is used to measure transmis-
sion rates and other epidemiological parameters based
on these data. These parameters reflect the time vary-
ing policies and practices in each home county. With
this framework it is possible to compare the expected
hazard and risk any employee might face in any par-
ticular workday to the population based hazard and
risk measured for each home county. Furthermore,
the agent based simulation supports a quantitative as-
sessment of workplace practices put in place to reduce
occupational hazard and risk from SARS-CoV-2.
We present an agent-based simulation system that
estimates COVID-19 hazard and risk by recording
pairwise interactions between simulated employee
agents in the workplace. Simulated agents move
about a plan map view of the workplace, guided by
a calendaring service that sets the daily schedule for
each agent, which includes meetings, lunch, and cof-
fee and restroom breaks. The natural office work
structure is re-created by placing agents in a vir-
tual organizational chart. Agents in the same orga-
nizational line have assigned offices next to one an-
other and will have scheduled meetings with one an-
other. As agents move about the workplace, our sys-
tem records hazard and risk when agents are within
a distance threshold. Epidemiological compartmental
modeling is used to seed some agents as infected, us-
ing transmission rates from their home county, and
then the workday simulation will record exposure
events to other susceptible agents.
Comparing our proposed system to existing agent-
based systems, the former tend to operate at a macro
level, modeling entire countries or metropolitan re-
gions (Kerr et al., 2021; Hinch et al., 2021; Shat-
tock et al., 2022). The location of agents and their
interactions happens at an abstract level, in census
block groups (Chang et al., 2021), statistical local ar-
eas (Chang et al., 2020) or even more abstracted as
”school” or ”workplace”. We focus on a particular
workplace site, adding a floor plan map and modeling
detailed (x,y) telemetry of agents in the floor plan.
This allows our system to model specific virus trans-
mission events at an exact location between the in-
fected and susceptible agents. We don’t need to pos-
tulate, as in the more generic agent-based approach,
general exposure risks when two agents are in the
same generic context like a school or household. Sec-
ondly, for interventions, this allows the exploration of
how modifications to the floor plan changes agents’
behavior and hence infection events. And finally, for
reporting, our system allows for visualizations based
on the floor plan, such as heat maps of exposure
events in the building. This reveals trouble spots in
the floor plan that may require tweaking to improve
agent / employee traffic flow.
In this paper, we use the agent-based simulation
system to quantitatively compare COVID-19 hazard
and risk for different workplace policies or interven-
tions. By plotting this risk as a function of building
occupancy, we can look for intersection points with
the same risk curve of the same agents working from
home. This crossover point suggests a safe operation
building occupancy, where workplace risk equals the
county-based working-from-home rate. We perform
BIOINFORMATICS 2024 - 15th International Conference on Bioinformatics Models, Methods and Algorithms
418

this analysis for two building policies and also look at
the effect that vaccinations have on the process.
2 METHODS
2.1 Epidemiology
2.1.1 Epidemiological Data
This study uses data from the USAFacts COVID-19
datasets (USAFacts, 2020) to measure the baseline,
time varying, disease hazard and risk in each employ-
ees home county. This data includes daily COVID-19
confirmed cases and deaths, compiled by the CDC,
and obtained directly from state and local agencies.
For the two building interventions tested in detail,
all agent based simulation runs were done for a full
workday on the date July 30, 2021. Later, for a his-
torical analysis, the date range is opened up to a se-
ries of dates in 2021 and 2022; in principle, any series
of dates can be chosen. Where historic data exists,
county disease prevalence is taken from the historic
data. For a chosen 1-4 weeks into the future, county
disease prevalence would be predicted by epidemio-
logical modeling.
2.1.2 Epidemiological Model
To derive the time varying epidemiological parame-
ters from this data, we chose the SpatioTemporal Epi-
demiological Modeler (STEM) (Douglas et al., 2019;
Edlund et al., 2010), a modeling framework available
through the Eclipse Foundation (Kaufman, 2022).
The framework and model are open source and avail-
able under the Eclipse Public License (EPL2) (Alam-
oudi et al., 2020). STEM supports a variety of models
and provides a graphical model design tool for new
model composition (Baldassi et al., 2021). The par-
ticular model used in this study, the compartmental
model, is discussed in detail elsewhere (Gopalakrish-
nan et al., 2021b; Gopalakrishnan et al., 2021a). This
model demonstrates a statistical error (MAPE) of less
than 0.5% for predictions 1-4 weeks into the future.
It was run at least weekly for more than a year to ac-
curately predict ICU bed demand for Tampa General
Hospital (Gopalakrishnan et al., 2021b). As input to
the agent based simulation, the data from USAFacts
was used to determine the initial probability that em-
ployees residing in a given county arrived at work in
the infectious state. Since the worksite being mod-
eled is in Santa Clara County, the transmission rate
obtained from the epidemiological modeling of Santa
Clara on any particular date was used in the agent sim-
ulation. This transmission rate varied over time, re-
flecting changes in local practices, behavior, and reg-
ulation (Gopalakrishnan et al., 2021b).
2.1.3 Model Calibration
The force of infection that drives new incidence in
most epidemiological compartment models has the
form
βSI/P (1)
where S is the susceptible population, I the infectious
population, P the total population, and β the transmis-
sion rate parameter (with typical units of 1/[person-
day]). On the other hand, the disease transmission
rate in a typical agent based model is stochastic and
depends on the cumulative number of contacts be-
tween agents. Contact implies pairs of agents gath-
ering within a hazard radius (defined as 6 feet in this
model) with a smallest discrete time interval of 1.0
second. If two agents are within this defined radius
for any period of time that is recorded as a hazard;
but it is only a risk if one of the agents is infectious
(shedding virus) and the other is susceptible. The
total number of exposed agents (those becoming in-
fected at work) depends on the cumulative contacts
in [person-seconds]. This is not a universal number
but depends on details of the workplace and agent be-
havior. To calibrate this stochastic transmission pro-
cess, the cumulative number of hazardous encoun-
ters was measured for the simulated workforce with
the building running at a normal capacity of 500 em-
ployees, and with no interventions in place. A single
calibration parameter was then set so that the num-
ber of newly exposed agents (the incidence) matches
that predicted for an equivalent population group in
Santa Clara on the same date. This calibration factor
was kept constant as other interventions and building
policies were varied across multiple runs of the Agent
Based Model.
2.2 Agent Based Modeling
In this section, we describe workplace modeling and
interventions, creation of agents and their calendars,
and our cloud-based simulation engine with user in-
terface dashboard.
2.2.1 Building Structure and Locations
The workplace used for the agent based simulation
was the IBM Almaden Research Center in San Jose,
California. CAD drawings of the physical site were
transformed into black and white bitmaps with a res-
olution of 0.454 [feet/pixel]. Fixed locations (pix-
els) representing destinations were assigned for all of-
Agent Simulation Using Path Telemetry for Modeling COVID-19 Workplace Hazard and Risk
419

fices, labs, bathrooms, auditorium and cafeteria en-
trances, conference rooms, and facilities sites, along
with unique locations for all chairs in the cafeteria
and auditorium. The building itself was divided into
12 partitions or tiles representing the different wings
of the building at each floor. These partitions sup-
ported distribution of the simulation across multiple
cloud compute nodes.
2.2.2 Path Finding
To determine the routes or paths agents would take
during their daily activities in a simulation, a path
finder leveraging a Bi-directional A* algorithm was
employed. For each partition of the building, this path
finder was used to generate all possible combinations
of paths between each unique location. A path object
is represented in our system as a structure with the fol-
lowing properties: identifier, starting and ending loca-
tion, the owning partition, and a list of steps or coordi-
nates comprising the path. These pre-computed paths
were persisted in a database to be referenced by the
simulation engine when constructing the plan needed
by an agent to get from point A to B. While paths
within partitions are pre-computed, paths across par-
titions were computed at run-time using breadth-first
search across the connections defined in the building
graph configuration, where nodes represent a partition
and edges represent either stairs, elevators, or other
way-points between partitions. Random selection of
way-points was used to simulate agents making a de-
cision about the choice of way-point they would use
when crossing partition boundaries.
2.2.3 Employee Properties, Organization Chart,
and Home Address
Synthetic employees were created programmatically,
with a Poisson distribution on commute distance used
to define employees’ home addresses in nearby coun-
ties. An organizational chart was created with four
levels of technical management up to and including
the lab director (who reports to an offsite Director
of Research). Facilities staff have a similar reporting
structure under an offsite facilities director. Offsite
agents were not explicitly modeled in the simulation.
Each onsite employee and manager had a unique pri-
mary work location (e.g., office) and secondary work
location (e.g., lab).
2.2.4 Employee Calendars
At the beginning of each workday, employee agents
arriving at the site were each assigned a unique cal-
endar of events with destination location and dura-
tion. These included work time intervals at primary
and secondary work locations, coffee breaks (with a
destination of the cafeteria), restroom breaks, meet-
ing at a colleagues office, conferences, lunch breaks,
and all hands meetings. Colleagues meetings were
derived preferentially for using the org chart to favor
meetings within an organization (including meetings
between manager and employee). With all building
paths pre-computed (see above), path IDs were asso-
ciated with every employee calendar event based on
the start and destination locations for the event. The
calendar also included travel times to allow for transit
of a given path (although traffic jams could result in a
delayed arrival at a meeting or event).
2.2.5 Traffic Flow Model
Unobstructed, employees would move around the
building following pre-computed paths with an ini-
tial velocity of 4.54 feet/second. People (like cars)
can not move through one another. High densities are
known to reduce speed - eventually leading to traf-
fic jams. We based our model of walking speed on
Newell’s optimal velocity (OV) model (Newell, 1961;
Wang et al., 2011), with velocity parameterised as a
logistic function in density and described by the fol-
lowing equation:
s =
1
1 + exp
k(n−n
0
)
(2)
Where s is the scaling factor used for reducing walk-
ing speed, k is the logistic growth rate, n is the num-
ber of nearby agents, and n
0
is the midpoint. Values
used for k and n
0
were 0.9 and 3.0 respectively. The
number of nearby agents, n, is determined by super-
imposing a mesh with 1.8×1.8 ft
2
cells over the plan
map, partitioning agents at each moment in time into
velocity groups.
2.2.6 Interventions and Building Policies
Although the workplace modeled was calibrated for
a typical occupancy of 500 employees onsite, the
building occupancy does vary widely with, at times,
over 700 employees (including summer interns), and
of course many fewer onsite employees during the
height of the pandemic. The number of onsite em-
ployees was varied (between 34-750) to study the ef-
fect of policy on disease hazard and risk. Two distinct
methods were used to select this number for a given
run: employees could be selected at random, or by
third line organization in the org chart. In this way
the org chart itself is used to model a particular social
network graph. Another variable used in the simula-
tion was the use (or non-use) of alternate entrances
to densely populated areas including the auditorium
BIOINFORMATICS 2024 - 15th International Conference on Bioinformatics Models, Methods and Algorithms
420

(one or two separate entrances), the cafeteria (one or
three cash registers), etc.
2.2.7 Disease Transmission, Initialization, and
Herd Immunity
At the start of each agent based simulation the ini-
tial infectious fraction is determined by public health
prevalence data for the home counties of all employ-
ees on the date to be simulated. In the agent based
simulation, a SEIR transmission process (Anderson
and May, 1992) is used so that a susceptible individual
in proximity to an infectious individual has the poten-
tial to move the susceptible individual to an exposed
state. In the exposed state individuals are incubating
the virus but not yet infectious. The incubation pe-
riod is chosen as one day, so that individuals exposed
at work return in the infectious state the next day.
To understand how vaccination and recovery from
prior infection is handled, first consider that in epi-
demiological compartment modeling, recovered and
vaccinated individuals are often referred to as re-
moved, or in one or more R compartments. This is the
case because the force of infection depends only on
the fraction of individuals susceptible, S, and the frac-
tion infectious, I. Over time, waning immunity may
lead to removed individuals returning to a susceptible
state, but instantaneously they are not part of the force
of infection. This is also reflected in the definition of
the effective reproductive number (R
t
) which is a re-
scaling of the basic reproductive number (R
o
) by the
fraction of susceptible individuals. i.e.,
R
t
∼ R
0
(S/N),
where N is the total agent population. We take advan-
tage of this fact in our experimental design by initial-
izing the simulation beginning with all employees ei-
ther in a susceptible or infectious state, and generating
multiple runs as a function of onsite employee pop-
ulation. In so doing the results can be applied to any
level of initial herd immunity simply by re-scaling the
building population by the fractions susceptible. For
example, in a building with population of 1001 indi-
viduals (one infectious), if 50% are initially immune
(removed) due to previous infection or from vaccina-
tions, then the outcome of the simulation is mathe-
matically identical to a simulation run with 500 sus-
ceptible individuals (and a single infectious). Accord-
ingly, estimation of the removed population for any
simulation date can be performed as a post processing
step and the appropriately re-scaled population used
to predict hazard and risk on that date. This approach
will be explained in detail in the results and discus-
sion section 3.
2.2.8 Batch Runs
To examine a policy choice, one would like to run a
batch of agent simulations over a matrix of configu-
ration parameter values, saving recorded hazards and
risks as a function of the parameter matrix. When the
batch run of simulations is complete, we would tend
to favor a policy choice that minimizes the estimated
hazards and risks. Ideally, there is a base level of ac-
ceptability when the risk from working at the work-
place is approximately equal to the risk of working at
home over the same 8 hour work window.
We have built a batch run system to examine pol-
icy choices, where the batch run is specified by a set of
configuration parameters to vary, plus the set of pos-
sible values. The batch system forms the outer prod-
uct of the parameter choices; for N parameters, we
form a N-D tensor of all the parameter combinations.
After forming the tensor, the batch system calls the
main simulation engine for each tensor cell, recording
the resulting hazards and risks in an event database.
Graphs and data analysis is performed by rolling up
results across parameter values.
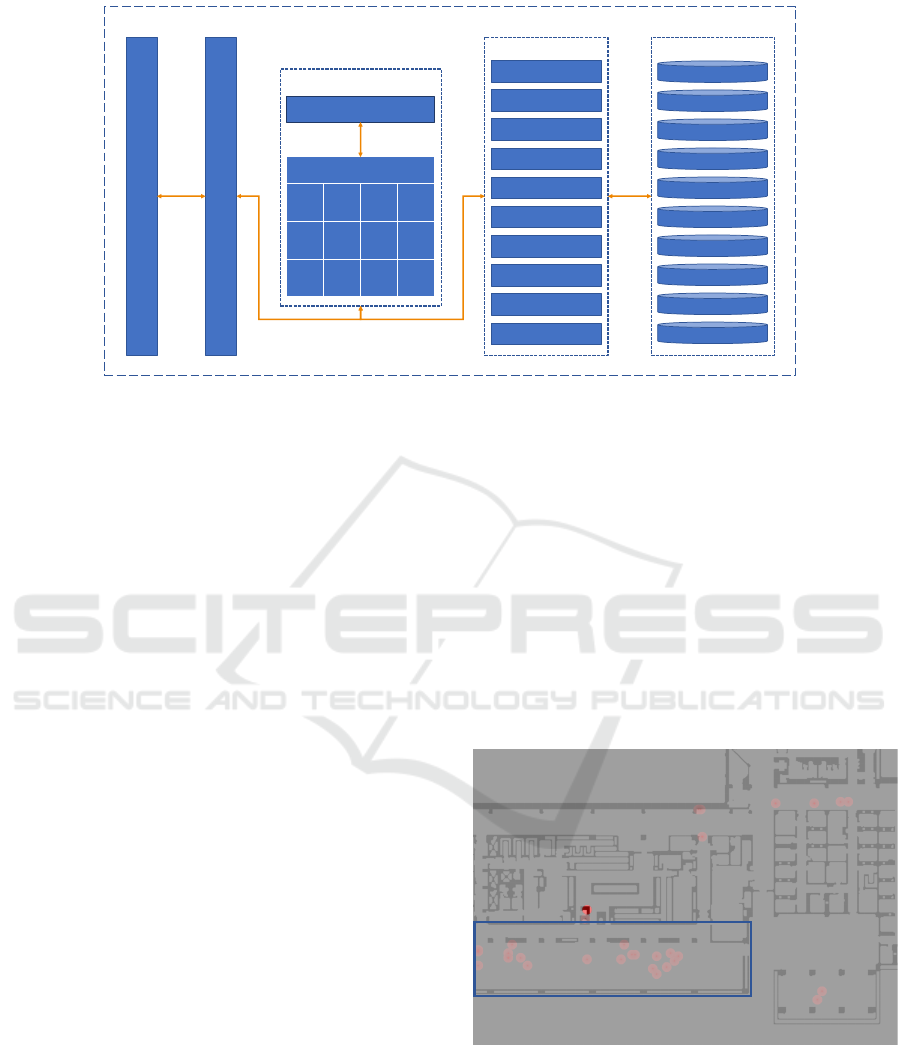
2.2.9 Cloud Architecture
Fig. 1 shows our agent based simulation engine as de-
ployed on Red Hat OpenShift v4.6 in the IBM Cloud.
RedHat OpenShift is a platform as a service based on
Kubernetes (Vayghan et al., 2018) providing software
developers tools for creating and managing cloud na-
tive applications using Linux containerization tech-
nologies. Our cloud instance is comprised of 6 com-
pute nodes, with each node having 16 CPUs (Intel
Xeon CPU E5-2683 @ 2.00GHz) and 64 GB RAM.
The data for simulations, which included details
such as agent properties, building locations, disease
states, events, paths, etc. were stored as JSON doc-
uments in CouchDB (Manyam et al., 2012). The
database instances were configured in cluster mode,
having three replicas for high availability, and with
replication between instances enabled for redundancy.
Microservices providing Application Program-
ming Interfaces (APIs) in support of various functions
such as retrieving and modification of data contained
within the CouchDB instances were developed with
LoopBack v4. LoopBack is an open-source frame-
work based on Node.js, Typescript, and OpenAPI
standards enabling developers to build APIs for ac-
cessing database backends and other web based ser-
vices quickly. Additionally, we deployed an API gate-
way based on aiohttp and Python 3.9 to provide a con-
solidated interface to the microservice APIs deployed
in our cluster.
The simulation engine was deployed as a set of
Agent Simulation Using Path Telemetry for Modeling COVID-19 Workplace Hazard and Risk
421
RedHat OpenShift on IBM Cloud
API Gateway
User Interface
Agents
Calendars
Diseases
Disease States
Hazard Events
Movement Events
Epidemiological Data
Locations
Paths
Databases
Configurations
Services
Agents
Calendars
Diseases
Events
Epidemiological
Locations
Paths
Configurations
Batching
Analytics
Simulation Engine
Coordinator
Workers
0 1 2 3
4 5 6 7
8 9 10 11
Figure 1: Agent based simulation engine deployed on RedHat OpenShift in the IBM Cloud.
containerized processes representing a coordinator
and a set of workers. These individual components
were developed with Python 3.9.9 using the aiohttp
package as the basis for the communication model.
The coordinator is responsible for keeping the simu-
lation date and time, controlling synchronization, and
reconciling the entering and exiting of agents between
workers. A worker process is deployed for each part
of the building or partition it represents. For our sim-
ulation of the IBM Almaden Research Center, we di-
vided the building into 12 distinct partitions. To sim-
ulate an alternative site would simply require deploy-
ing fewer or additional worker processes depending
on the layout of the building. Workers are responsi-
ble for computing their part of the simulation, which
includes steps such as handling new calendar events,
moving agents within and between partitions, prox-
imity detection, and disease transmission. These pro-
cesses would utilize the microservices mentioned pre-
viously to create and update simulation data such as
movement and hazard events and disease states for the
agents.
As mentioned previously, the coordinator controls
the overall flow of the simulation. Its primary job is
to handle the synchronization of a tick of the clock. A
tick in our simulations is defined as 5 seconds. Thus,
every call the coordinator makes to the workers to
progress will represent 5 seconds of elapsed time in
the simulated world. Furthermore, workers will per-
form a micro-tick analysis at 1 second intervals within
the 5 second tick for analyzing the movement, prox-
imity, and disease transmission of agents. This fine-
grained timing allows our system to record very de-
tailed information regarding the progress of a simula-
tion.
Analytics based on the outcome of the simula-
tions can be queried and viewed as plotted images
and JSON output. The JSON output provides users
the capability to use the summarized results in their
own analytic or graphing tools. CouchDB views were
employed to transform the raw movement, hazard,
and agent disease state data into summarized results
after a completed work day. Fig. 2 shows an ex-
ample heatmap visualization of agent-to-agent expo-
sures (red) in one simulated day in the cafeteria dining
area of Almaden Research Center, outlined in dark
blue. Through this service an operations officer has
the tools at hand to make data driven decisions and
apply policy actions depending on the outcomes.
Cafeteria Dining Area
Figure 2: Example heat map of COVID-19 exposures (red)
in one partition of Almaden Research Center, showing most
simulated exposures happen in the cafeteria dining area
(outlined in blue).
2.2.10 User Interface
To visualize the simulations, we developed a web-
based application based on React v17.0.2 and de-
BIOINFORMATICS 2024 - 15th International Conference on Bioinformatics Models, Methods and Algorithms
422

ployed in our OpenShift cluster along with our other
components and microservices. Fig. 3 shows an ex-
ample of our web application with the 2nd floor, D-
wing as the focus. The application provides the abil-
ity to see the entire layout of a building and view the
instantaneous locations of the agents. Depending on
their disease state, agents will either appear in one of
the possible 4 colors: blue for susceptible, red for in-
fected, yellow for exposed, and green for recovered or
vaccinated. The application provides users the abil-
ity to select the date and time period, as well as the
playback speed of a simulation. Our application also
provides additional filtering capabilities for viewing
agents of selected states, selecting agents by their se-
rial number, and recorded exposures. Lastly, the web
application is integrated with our API gateway and
analytic services providing users a single purpose ap-
plication for working with simulations.
3 RESULTS AND DISCUSSION
From the data generated by the agent based simula-
tion it is possible to measure both the hazard and the
risk associated with transmission of the SARS-CoV-
2 virus. Hazard reflects the frequency and duration
of encounters between people within a configurable
hazard radius (6 feet in these simulations). It does
not depend upon - or presuppose - disease transmis-
sion. Transmission risk exists only when both sus-
ceptible and infectious individuals are in the building.
We note that other hazardous factors could be mod-
eled, and studied, but in the case of aerosol transmis-
sion of an infectious disease the proximity of people
to one another is fundamental to the hazard - and to
any interventions designed to remediate it.
3.1 Hazard Distribution
Figs. 4a-4d show the distribution of hazard exposure
as a function of number of employees in the building.
As defined previously in section 2, the units of hazard
are [person-seconds]. The data is shown as a series
of violin plots, where each sub-figure represents the
outcome from a different run condition. In Fig. 4a,
on site employees are selected by third line organiza-
tion and alternate routes are disabled, while in Fig. 4b,
on site employees are selected by third line organiza-
tion and alternate routes are enabled. In Fig. 4c, on
site employees are selected at random and alternate
routes are disabled, and in Fig. 4d, on site employ-
ees are selected at random and alternate routes are en-
abled. Each violin represents one full day run of the
simulation using five different random number seeds.
In all cases the daily hazard exposure increases sys-
tematically with building occupancy.
The total work force hazard based on person-
person contact time is shown in Fig. 5. The units are
[person-seconds]. The standard deviation is obtained
by averaging the mean hazard for each distribution
over the five trials. For those run conditions where the
employee population is selected at random, the num-
ber of employees selected is exact and plotted along
the abscissa. Where on-site employees are selected
by the number of third line management organizations
allowed in the building, the number of employees will
vary with randomized trial as third line organizations
vary in size. This variation is shown as a horizontal
error bar for this mode of population selection. To
understand the vertical scale in Fig. 5, if the work-
force hazard is (for example) 150,000 [person-secs])
with 500 employees in the building, that corresponds
to an average person-person exposure of 300 person-
seconds of contact per employee over the 8 hour day.
Note that the measured hazard does not always fol-
low a simple linear relation with building occupancy.
In particular, for occupancy determined by selecting
third line organization(s), and with alternate routes
enabled, the measured hazard follows the hazard vs
number of employees for selection by third line orga-
nization(s), and without alternate routes, until a build-
ing population of 300 employees where there is a
knee in the data and hazard increases at a reduced rate
for alternate routes enabled (orange symbols).
In all cases the mean hazard-exposure increases
with building occupancy. Selecting employees by
third line organization leads to systematically higher
hazard than random selection. Supporting alternate
routes to reduce crowding systematically lowers haz-
ard exposure. The observed variation with run con-
ditions demonstrates that the occupational hazard de-
pends both on the the physical layout of the build-
ing as well as the social (or organizational) network
graph reflecting connections between people. Either
can be effectively modified by appropriate interven-
tions and the corresponding outcomes can be mea-
sured. Observe that for each run condition, the haz-
ard data was fit with a linear least squares fit with
respect to the number of employees, but in general
the observed hazard vs number of employees on-site
may not always be linear. This is particularly evident
for the runs where on-site employees were selected
by organization, and alternate routes were allowed.
Alternate routes are most effective in reducing haz-
ard when and if crowded conditions such as extended
cafeteria checkout lines are a significant source of
person-person contact. This crowding is and of it-
self nonlinear, and the non-linearity is observed for
Agent Simulation Using Path Telemetry for Modeling COVID-19 Workplace Hazard and Risk
423
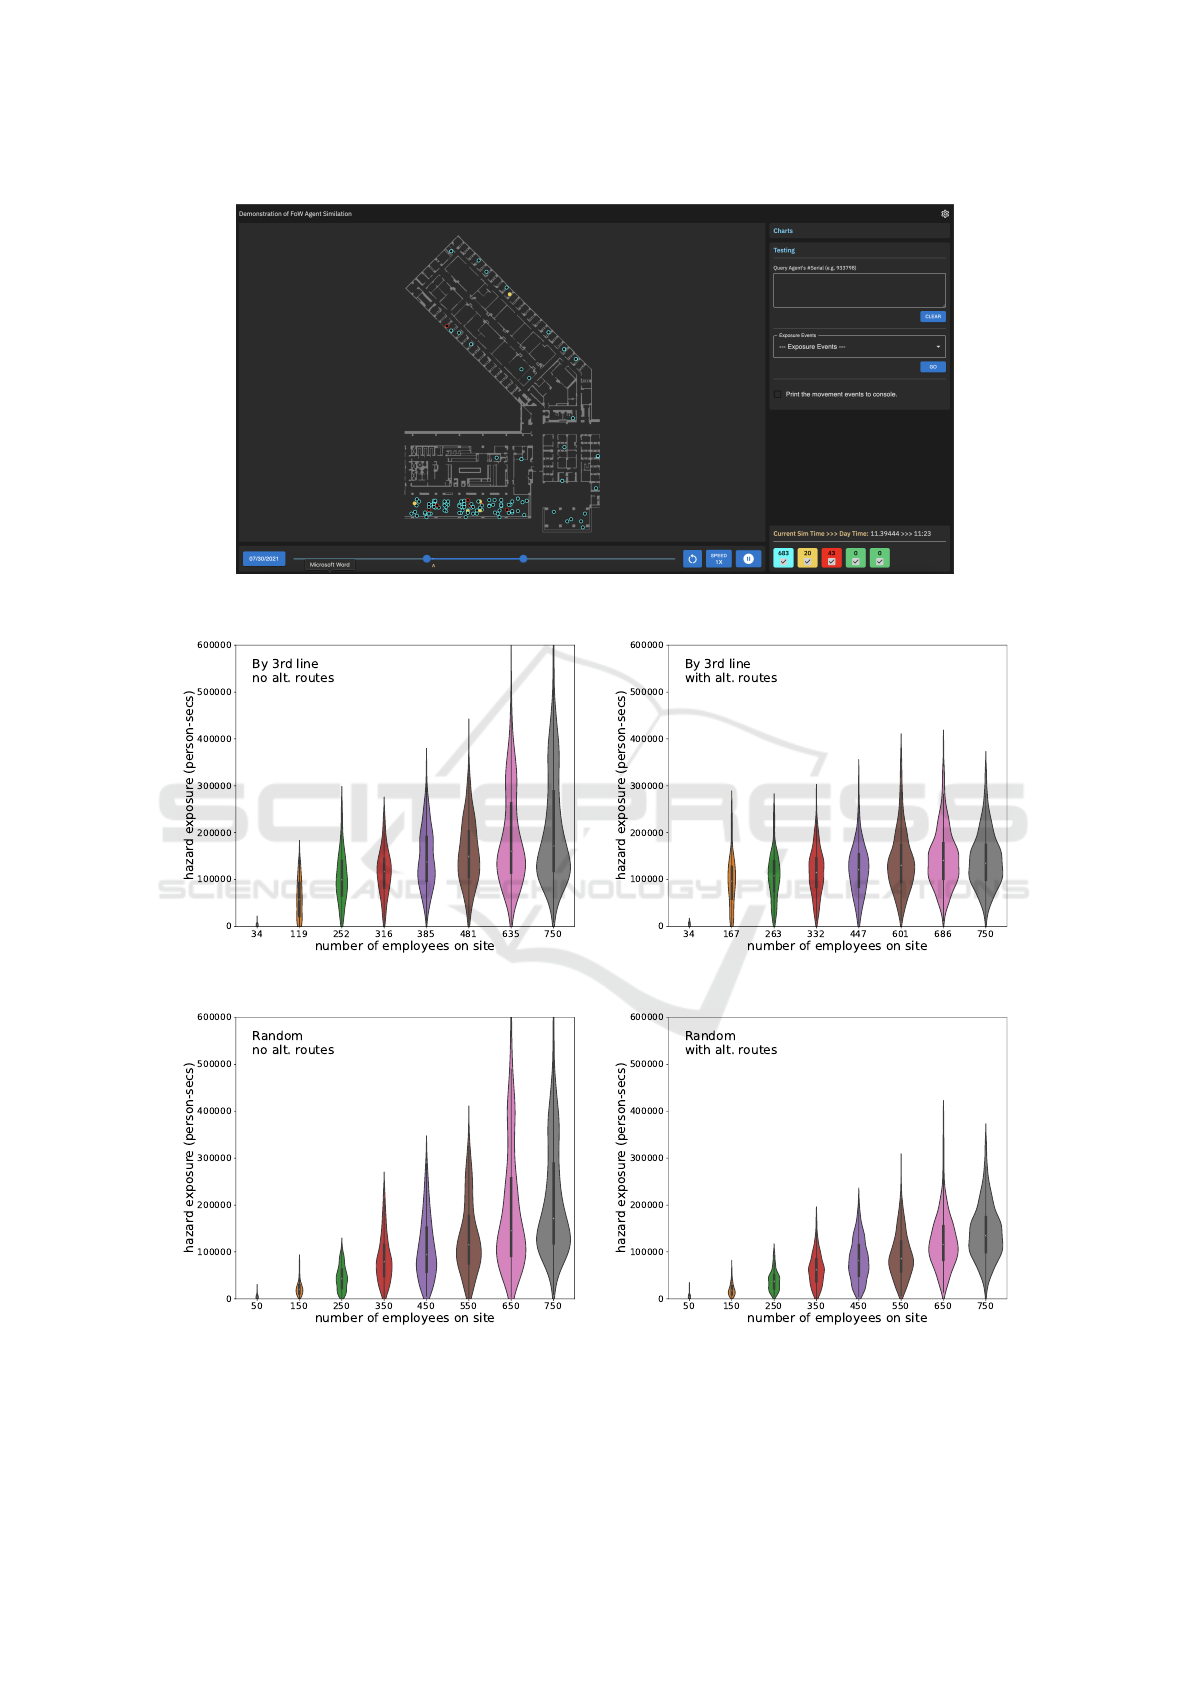
Figure 3: User interface for the agent based simulation engine showing a zoomed in view of a running simulation for the 2nd
floor D-wing of the building during lunch time.
(a) Employees selected by org, alt. routes disabled (b) Employees selected by org, alt. routes enabled
(c) Employees selected at random, alt. routes disabled (d) Employees selected at random, alt. routes enabled
Figure 4: Violin plots showing the hazard exposure [person-seconds] distribution as a function of the number of onsite
employees. Each sub-panel corresponds to a different run condition. For all run conditions the average daily hazard increases
with building occupancy.
BIOINFORMATICS 2024 - 15th International Conference on Bioinformatics Models, Methods and Algorithms
424
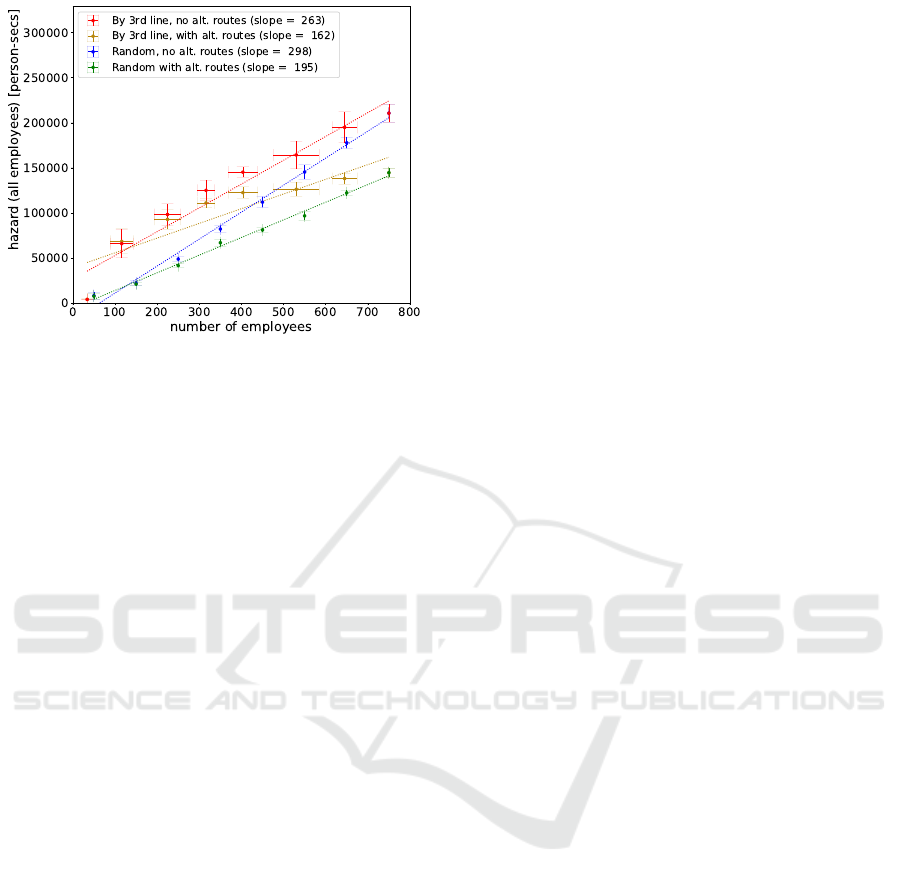
Figure 5: The figure shows the total work force hazard
(person-person contact time [person-seconds]) as a func-
tion of the number of onsite employees. The data was ob-
tained by averaging the mean hazard (see Figs. 4a-4d) over
five runs with different random number seeds. In all cases
the employee-employee contact time increases with build-
ing occupancy. Selecting employees by third line organi-
zation leads to systematically higher hazard than random
selection. Supporting alternate routes to reduce crowding
systematically lowers hazard exposure.
relatively high building populations. This is to be ex-
pected given the non-linearity of traffic flow (and of
Newell’s optimal velocity model used in this simula-
tion (Newell, 1961; Wang et al., 2011)).
3.2 Risk of Disease Transmission
Figs. 6a-6d show the number of employees infected
as a function of time since midnight [hours] for four
run conditions. When infected, susceptible employ-
ees first enter a latent exposed state, and become in-
fectious on the following day. The number of employ-
ees on site is selected by organization, or selected at
random; each with and without the use of alternate
routes. Each sub-figure shows a series of runs with
varying average number of employees on site (shown
in the legend). Each curve represents an average over
five runs with five random number seeds. The stan-
dard deviation is shown at the end of each workday. In
all cases, for all runs, the run duration was a one full
business day. The curves represent the average cumu-
lative sum of infections over the day. Each curve ter-
minates at a slightly different time based on the time
of the final infection for that run condition.
Based on individual calendars, arrival times for
employees varies between 6:30am and 10am. The
rate of new infections (the slopes in Figs. 6a-6d)
starts at zero at 6:30am when the building is empty,
reaches a maximum around lunchtime where the
largest groups gather in the cafeteria, and falls off
again as people leave at the end of the day. Disease
transmission is a stochastic process and the number
of individuals exposed at work (and the time of day
for the exposures) varies from run to run. The dashed
lines represent the number of expected infections had
a sub-population of the same size remained at home.
Based on the cumulative disease exposures during
the workday, Fig. 7 shows the infection risk vs. the
number of employees in the building. The infection
risk is measured by the cumulative number of newly
infected (exposed) employees over the full workday.
The total risk is measured in five trials for the run
conditions shown in the legend. Once again, where
on-site employees are selected by third line organiza-
tions, the number of employees varies with random-
ized trial. This variation is shown as a horizontal error
bar for this mode of population selection. For each of
the run parameters (or mode) listed in the legend, we
also show the slope based on a least squares fit to the
data. This slope represents the incremental increase
in infection risk as additional employees arrive in the
building.
In Fig. 7, in black, we plot the expected number of
new exposures for the same sub-population if the indi-
viduals remained in their home counties and not come
to work. This is derived from the county level SARS-
CoV-2 epidemiological modeling and prevalence data
scaled to the same sub-population size.
As discussed above, none of the results from the
agent based simulation are universal, since they are
a function of both building layout, workplace poli-
cies, and other interventions including the size of the
onsite workforce. However, for any particular work-
place or model workplace, it is possible to quantita-
tively compare the on-site risk to the corresponding
risk if the same sub-population of employees were to
remain at home. In Table 1 we list, for each mode,
the incremental increase in risk as a function of the
number of onsite employees (the slope in Fig. 7), as
well as the number of onsite employees at which the
total onsite risk is equivalent to the current at home
risk. This is the point at which the risk lines for on-
site employees crosses the average risk line for the
same sub-population at home. As is the case in Fig. 7,
the population size along the x-axis does not include
individuals in an immune or removed state, so if the
risk lines cross, the onsite population can be re-scaled.
For example, at 100 employees, and if 50% of em-
ployees are known to be fully vaccinated or otherwise
immune, then the risks become equivalent for 200 on
site employees. This crossing point does not represent
zero risk, it simply identifies the onsite population and
policies, for a particular workplace site, where the av-
erage occupational risk would most closely match the
Agent Simulation Using Path Telemetry for Modeling COVID-19 Workplace Hazard and Risk
425
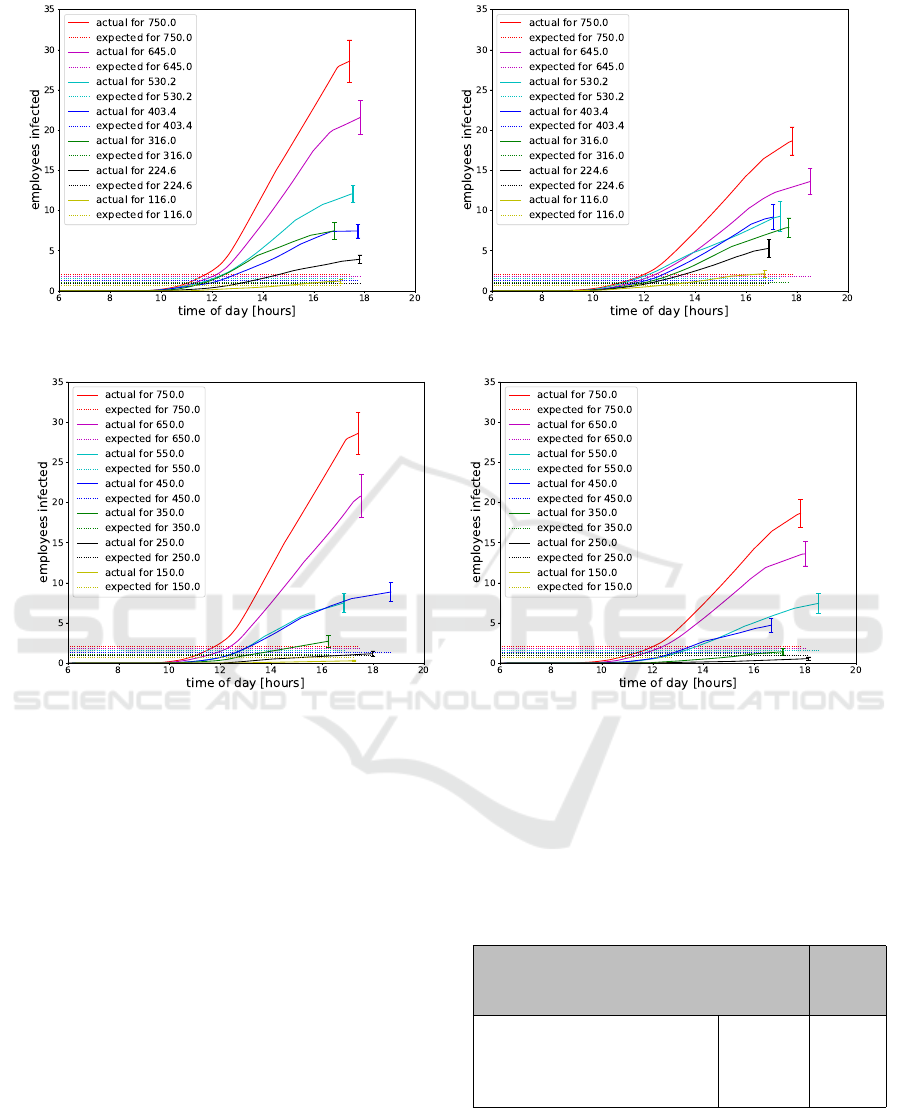
(a) Employees selected by org, alt. routes disabled (b) Employees selected by org, alt. routes enabled
(c) Employees selected at random, alt. routes disabled (d) Employees selected at random, alt. routes enabled
Figure 6: Number of employees infected as a function of time of day [hours], and as a function of number of employees
on site, for four run conditions with on site employees selected by organization or at random, with and without the use of
alternate routes. Each subfigure shows the average number of onsite employees (averaging over 5 random trials, with std. dev.
shown at the end of each workday). The dashed lines represent the total number of expected infections during the eight hour
workday had a sub-population of the same size remained at home.
average at home risk. Defining an acceptable occu-
pational risk is, of course, a matter of policy. A zero
risk criteria would never support even partial return to
work policy. One might choose an intermediate pol-
icy such that acceptable occupational risk should, on
average, be half the current at home risk. Modeling
can not select criteria, but given the criteria, modeling
can evaluate the interventions and policies required to
achieve the defined goal.
To examine using the intersection of risk lines as
a policy recommendation to a workplace site man-
ager, we performed a historical analysis of our sim-
ulation system, looking at how the crossover point
moved over nine months of the COVID-19 pandemic
from July, 2021 to March, 2022. For each date, we
ran 25 simulations (5 capacities × 5 random seeds)
to produce a risk vs. number employees chart such as
Table 1: The incremental risk per person working onsite
(from Fig. 7) and the estimated building occupancy where
total onsite risk is equivalent to the current at home risk for
each mode or site policy.
Mode Incr. Bldg.
risk per Occ.
person (+/- 5)
Random, with alt. routes 0.022 178
Random, no alt. routes 0.035 172
By 3rd line, with alt. routes 0.019 0
By 3rd line, no alt. routes 0.032 85
Fig. 7. Following the lowest risk policy choice from
our prior analysis, the simulations reduce agent popu-
lations randomly and alternate routes are enabled, so
we are focused on risk vs. number employees at each
date. For each chart, we estimated the best fit lines
BIOINFORMATICS 2024 - 15th International Conference on Bioinformatics Models, Methods and Algorithms
426
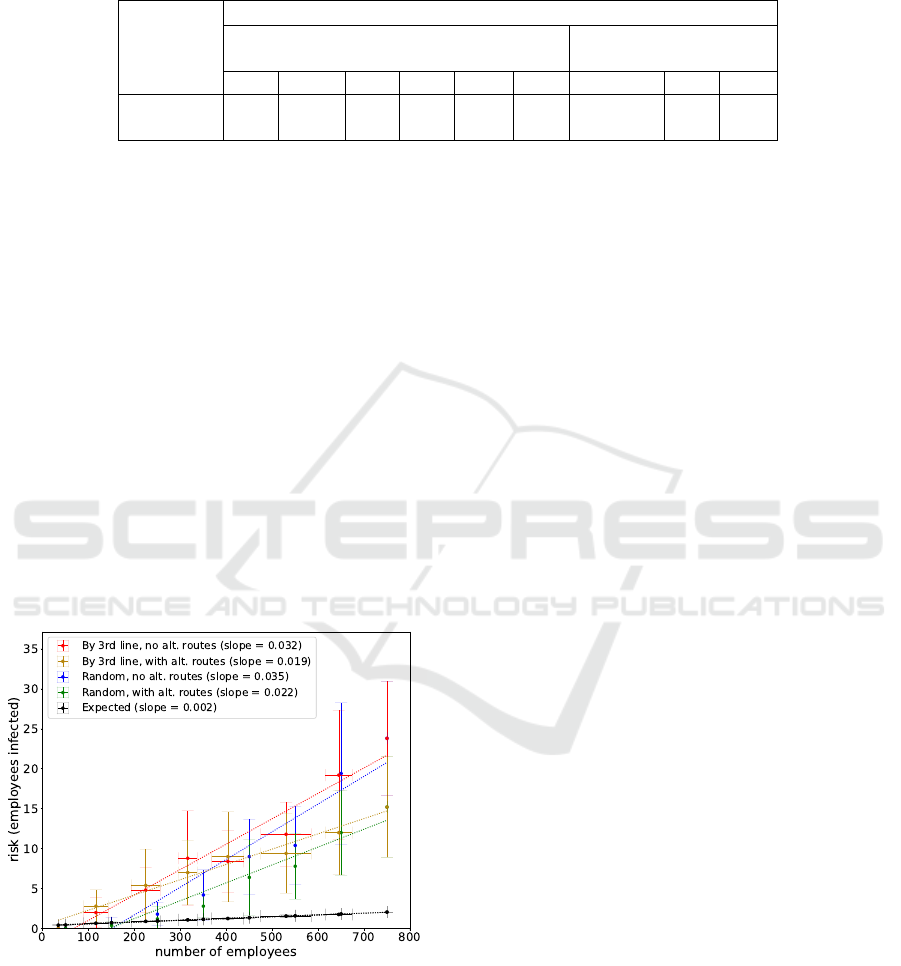
Table 2: Historical analysis of crossover capacity during the Delta and Omicron waves. For nine dates from July, 2021
through March, 2022, we repeated the risk crossover analysis of Fig. 7 to estimate the recommended site capacity at IBM
Almaden Research Center. The recommended site capacity is lowest at the peaks of the Delta and Omicron COVID-19 peaks,
highlighted in red and blue.
Date (10
th
of each month)
2021 2022
Delta Omicron
Jul Aug Sep Oct Nov Dec Jan Feb Mar
Crossover
Capacity
155 142 157 180 168 177 130 154 157
to: 1) estimated risk, and 2) expected risk, and we
found the intersection point where the risk levels cross
one another, which can be taken as a recommended
workplace site capacity. In Table 2, we show the rec-
ommended capacities for these nine dates, the 10
th
of the month from July, 2021 through March, 2022,
which includes both the Delta and Omicron COVID-
19 peaks in the US (highlighted as red and blue in Ta-
ble 2). As we were hoping to see, the recommended
capacity drops to its lowest points at the peaks of the
Delta and Omicron waves.
4 CONCLUSION
To advise workplace site managers on handling
hazard and risks from infectious diseases such as
COVID-19, ideally one would like to explore the
effects of different policies using a data-driven ap-
Figure 7: The figure shows the infection risk as measured
by the cumulative number of infected employees over one
workday as a function of the number of employees in the
building. The error bars reflect the standard deviation over
five trials with different random number seeds. Each line
represents a different set of run conditions as indicated in
the legend. The black data show the expected number of
new infections (based on the county level epidemiological
data) had the same sub-population stayed at home.
proach. Agent simulation provides a lens for explor-
ing policy choices by systematically altering simula-
tion parameters. The differing simulation parameters
changes the physical interactions between virtual em-
ployees traversing a virtual workplace, yielding dif-
ferent levels of hazard and risk. In a simulation of a
large research laboratory with maximum capacity of
750, we compared the effects of reducing the popu-
lation by randomly selecting employees in the orga-
nization chart with eliminating some number of third
line organizations. We also explored simulations with
and without the benefits of alternate routes available
to the agents for social distancing (e.g. multiple cash
registers, multiple auditorium entrances). Comparing
the hazards and risks from these options, we showed
that the random selection method was the best, and
that alternate routes do result in lower virus transmis-
sion. For the various parameter choices, we can plot
hazard and risk for different levels of building occu-
pancy, and we estimate the number of employees who
can ”safely” work in the building. Here, ”safe” is the
point where workplace virus risk is the same as work-
ing at home, which is estimated by county epidemi-
ological modeling. Even if one wants to operate at
a stricter level of safety, the agent simulation frame-
work is general enough to provide valuable guidance
to a workplace site manager.
REFERENCES
Alamoudi, E., Mehmood, R., Aljudaibi, W., Albeshri, A.,
and Hasan, S. H. (2020). Open Source and Open Data
Licenses in the Smart Infrastructure Era: Review and
License Selection Frameworks. In Smart Infrastruc-
ture and Applications, pages 537–559. Springer.
Anderson, R. M. and May, R. M. (1992). Infectious Dis-
eases of Humans: Dynamics and Control. Oxford
University Press.
Baldassi, F., D’Amico, F., Malizia, A., and Gaudio, P.
(2021). Evaluation of the Spatiotemporal Epidemi-
ological Modeler (STEM) during the recent COVID-
19 pandemic. The European Physical Journal Plus,
136:1072.
Agent Simulation Using Path Telemetry for Modeling COVID-19 Workplace Hazard and Risk
427

Bianco, S., Capponi, S., and Kaufman, J. H. (2021).
Matematica epidemiologica per COVID-19. Ithaca:
Viaggio nella Scienza, 2021(17b):5–12.
Bourgais, M., Taillandier, P., and Vercounter, L. (2019).
BEN: An Agent Architecture for Explainable and Ex-
pressive Behavior in Social Simulation. In EXTRAA-
MAS, Montreal, Canada.
Chang, S., Pierson, E., Koh, P. W., Gerardin, J., Redbird,
B., Grusky, D., and Leskovec, J. (2021). Mobility net-
work models of COVID-19 explain inequities and in-
form reopening. Nature, 589:82–87.
Chang, S. L., Harding, N., Zachreson, C., Cliff, O. M., and
Prokopenko, M. (2020). Modelling transmission and
control of the COVID-19 pandemic in Australia. Na-
ture Communications, 11(5710).
Daniels, R., Gilbert, S., Kuppusamy, S., Kuempel, E., Park,
R., Pandalai, S., Smith, R., Wheeler, M., Whittaker,
C., and Schulte, P. (2020). Current Intelligence Bul-
letin 69: NIOSH Practices in Occupational Risk As-
sessment. National Institute for Occupational Safety
and Health.
Douglas, J. V., Bianco, S., Edlund, S., Engelhardt, T., Filter,
M., G
¨
unther, T., Hu, K., Nixon, E. J., Sevilla, N. L.,
Swaid, A., et al. (2019). STEM: an open source tool
for disease modeling. Health security, 17(4):291–306.
Duggirala, M., Singh, M., Hayatnagarkar, H., Patel, S., and
Balaraman, V. (2016). Understanding impact of stress
on workplace outcomes using an agent based simula-
tion. In Proceedings of the Summer Computer Simu-
lation Conference, pages 1–10, Montreal, Canada.
Edlund, S. B., Davis, M. A., and Kaufman, J. H. (2010).
The spatiotemporal epidemiological modeler. In Pro-
ceedings of the 1st ACM International Health Infor-
matics Symposium, pages 817–820.
Gopalakrishnan, V., Navalekar, S., Ding, P., Hooley, R.,
Miller, J., Srinivasan, R., Deshpande, A., Liu, X.,
Bianco, S., and Kaufman, J. H. (2021a). Adaptive
Epidemic Forecasting and Community Risk Evalua-
tion of COVID-19. arXiv preprint arXiv:2106.02094.
Gopalakrishnan, V., Pethe, S., Kefayati, S., Srinivasan, R.,
Hake, P., Deshpande, A., Liu, X., Hoang, E., Davila,
M., Bianco, S., et al. (2021b). Globally local: Hyper-
local modeling for accurate forecast of COVID-19.
Epidemics, 37:100510.
Hardy, P., Marcolino, L. S., and Fontanari, J. F. (2021). The
paradox of productivity during quarantine: An agent-
based simulation. The European Physical Journal B,
94(1):40.
Hinch, R., Probert, W. J. M., Nurtay, A., et al. (2021).
OpenABM-Covid19 — An agent-based model for
non-pharmaceutical interventions against COVID-19
including contact tracing. PLOS Computational Biol-
ogy, 17(7):1–26.
Hosseini, P. R., Mills, J. N., Prieur-Richard, A.-H., et al.
(2017). Does the impact of biodiversity differ between
emerging and endemic pathogens? The need to sepa-
rate the concepts of hazard and risk. Philosophical
Transactions of the Royal Society B: Biological Sci-
ences, 372:20160129.
Islam, M. T., Jain, S., Chen, Y., et al. (2022). An Agent-
Based Simulation Model to Evaluate Contacts, Lay-
out, and Policies in Entrance, Exit, and Seating in In-
door Activities Under a Pandemic Situation. IEEE
Transactions on Automation Science and Engineer-
ing, 19(2):603–619.
Kaufman, James H., e. a. (2006-2022). The Eclipse Spa-
tioTemporal Epidemiological Modeler (STEM) web-
site. https://projects.eclipse.org/projects/technology.s
tem/.
Kerr, C. C., Stuart, R. M., Mistry, D., et al. (2021). Co-
vasim: An agent-based model of COVID-19 dynam-
ics and interventions. PLOS Computational Biology,
17(7):1–32.
Kumpulainen, S. (2006). Vulnerability concepts in haz-
ard and risk assessment. In Schmidt-Thome, P., edi-
tor, Natural and Technological Hazards and Risks Af-
fecting the Spatial Development of European Regions,
Special Paper 42, pages 65–74. Geological Survey of
Finland.
Manyam, G., Payton, M. A., Roth, J. A., Abruzzo, L. V.,
and Coombes, K. R. (2012). Relax with CouchDB —
Into the non-relational DBMS era of bioinformatics.
Genomics, 100(1):1–7.
Mu
˜
noz, S. and Iglesias, C. A. (2021). An agent based sim-
ulation system for analyzing stress regulation policies
at the workplace. Journal of Computational Science,
51:101326.
Newell, G. F. (1961). Nonlinear effects in the dynamics of
car following. Operations research, 9(2):209–229.
Sage, A. P. and White, E. B. (1980). Methodologies for risk
and hazard assessment: A survey and status report.
IEEE Transactions on Systems, Man, and Cybernet-
ics, 10(8):425–446.
Shattock, A. J., Le Rutte, E. A., D
¨
unner, R. P., Sen, S.,
Kelly, S. L., Chitnis, N., and Penny, M. A. (2022).
Impact of vaccination and non-pharmaceutical inter-
ventions on SARS-CoV-2 dynamics in Switzerland.
Epidemics, 38:100535.
Taillandier, P., Gaudou, B., Grignard, A., et al. (2018).
Building, composing and experimenting complex spa-
tial models with the GAMA platform. GeoInformat-
ica, 23:299–322.
USAFacts (2020). US Coronavirus Cases and Deaths. https:
//usafacts.org/visualizations/coronavirus-covid-19-s
pread-map. Accessed: 2020-10-04.
Vayghan, L. A., Saied, M. A., Toeroe, M., and Khendek, F.
(2018). Deploying Microservice Based Applications
with Kubernetes: Experiments and Lessons Learned.
In 2018 IEEE 11th international conference on cloud
computing (CLOUD), pages 970–973. IEEE.
Vitins, B. J., Erath, A., and Axhausen, K. W. (2016). Inte-
gration of a Capacity-Constrained Workplace Choice
Model: Recent Developments and Applications with
an Agent-Based Simulation in Singapore. Transporta-
tion Research Record, 2564(1):1–13.
Wang, H., Wang, W., and Chen, J. (2011). General Newell
model and related second-order expressions. Trans-
portation Research Record, 2260(1):42–49.
BIOINFORMATICS 2024 - 15th International Conference on Bioinformatics Models, Methods and Algorithms
428
