
Sequential Networks for Predicting the Clinical Risk of Chronic Patients
Using Drug Dispensation
Daniel Hijosa-Guzm
´
an
1,∗ a
, Mar
´
ıa Teresa Jurado-Camino
1,∗ b
, Pablo de Miguel-Bohoyo
2 c
and Inmaculada Mora-Jim
´
enez
1 d
1
Dept. Signal Theory and Communications, Telematics and Computing Systems, Rey Juan Carlos University, Madrid, Spain
2
University Hospital of Fuenlabrada, Madrid, Spain
Keywords:
Temporal Patterns, Clinical Decision Support, Chronic Conditions, Patient Disease Trajectory, Pharmaceutical
Treatment.
Abstract:
Chronic diseases are one of the leading causes of death worldwide, with diabetes, hypertension, congestive
heart failure, and chronic obstructive pulmonary disease among the most common ones. In this sense, the
extraction of clinical patterns from the data recorded in the Electronic Health Record is of great interest and
motivates research in models to predict the temporal evolution of the patient’s health status. Predictive models
would be of great help in the treatment of chronic patients to carry out preventive policies. Our approach
considers the Gated Recurrent Unit neural network to extract temporal patterns of drug dispensation and to
predict the progression of Chronic Conditions (CCs) towards a more complex health status. Real-world data
linked to chronic patients of a Spanish hospital were considered, obtaining the most probable health status
among a set of 10, including single dominant or moderate CCs, significant CCs in multiple organ systems,
and dominant CC in three or more organ systems. Accuracy rates above 70% for single dominant or moderate
CCs and nearly 50% for significant/dominant conditions across multiple organs were obtained. These results
show the potential of sequential networks to predict the clinical risk of chronic patients and support clinical
decision-making.
1 INTRODUCTION
The increase in life expectancy in developed coun-
tries has lead to a paradigm shift from high prevalence
of acute diseases towards a dominance of Chronic
Conditions (CC) (Pawlson, 1994). This increase in
CC prevalence has a great impact in healthcare bud-
gets (Anderson and Horvath, 2004), due to the need
of providing sustained treatments (Care, 2019), par-
ticularly medications (Hoffman and et al, 2012) over
time. In fact, the estimations foresee a continued
increase in the prevalence of CC over the coming
years (Ansah and Chiu, 2023) (Brennan and et al,
2017) and, by extension, a higher healthcare resources
investment.
The increase in CC represents a challenge for
a
https://orcid.org/0009-0005-1919-5682
b
https://orcid.org/0000-0002-5646-1290
c
https://orcid.org/0000-0001-5241-596X
d
https://orcid.org/0000-0003-0735-367X
*
These authors contributed equally to this work.
current healthcare systems, demanding a change in
healthcare to emphasize prevention and early detec-
tion over treatment (Boyd and Fortin, 2010). One of
the significant advances in healtcare systems has been
the implementation of the Electronic Health Record
(EHR), which allows the storage of a massive number
of patient encounters (Miotto and et al, 2016), con-
taining demographic and clinical data. These large
data sets can be analysed by using data science and
Machine Learning (ML) tools, in order to extract pat-
terns which give value to health data. These infor-
mation is specially valuable in a clinical environment,
because can be used as a guide for healthcare profes-
sionals or healthcare resource managers.
In this paper we use data collected in the EHR
of the University Hospital of Fuenlabrada (UHF) in
Madrid (Spain), which encompass a total of 225.000
inhabitants. This research was previously approved
by the Ethics Committee of the UHF. In our previous
works related to the patient’s health status analysis
with CCs (Soguero et al., 2016) (Chushig et al., 2022)
we considered both diagnosis and pharmacological
Hijosa-Guzmán, D., Jurado-Camino, M., de Miguel-Bohoyo, P. and Mora-Jiménez, I.
Sequential Networks for Predicting the Clinical Risk of Chronic Patients Using Drug Dispensation.
DOI: 10.5220/0012321800003657
Paper published under CC license (CC BY-NC-ND 4.0)
In Proceedings of the 17th International Joint Conference on Biomedical Engineering Systems and Technologies (BIOSTEC 2024) - Volume 2, pages 37-44
ISBN: 978-989-758-688-0; ISSN: 2184-4305
Proceedings Copyright © 2024 by SCITEPRESS – Science and Technology Publications, Lda.
37

codes registered in the EHR during the patient’s en-
counters with the healthcare system for a year, con-
cluding that codes associated with drugs were the
most informative ones (Chushig et al., 2021). Since
this conclusion is in line with the physician’s knowl-
edge, we will only use data related to the patient’s
encounters with the pharmacy system. Additionally,
in our previous works we only used data registered
during one year, and this is our first work analyzing
the patients’ health status progression over a span of
four years. In this paper we also increase the num-
ber of considered CC. Specifically we analyse the
health progression of chronic patients with one or sev-
eral of the following CC: Diabetes (DIA), Congestive
Heart Failure (CHF), Hypertension (HT) and Chronic
Obstructive Pulmonary Disease (COPD). It is known
that past clinical and life style events have impact in
the current patient’s health status (Petrides and et al,
2019). Since when CCs emerge they persist through-
out the individual’s lifetime, the temporal analysis of
the patient’s health status is of great importance to
implement healthcare policies and to support efficient
and sustainable health systems. Also, to assist practi-
tioners in their clinical decision-making, we propose
here to use sequential networks. The goal is to predict
the clinical worsening of chronic patients over time,
identifying those chronic patients with higher risk of
developing additional CCs.
In the field of data-driven systems and ML, Re-
current Neural Networks (RNNs) (Levin, 1990) have
been used in a variety of applications for dealing with
sequential data (Wang and Wang, 2017). In RNN, the
network architecture (with input layer, recurrent layer
and output layer) allows to maintain a hidden state
(recurrent layer) capturing information about previ-
ous inputs (previous temporal data in the sequence).
However, the use of the original RNN architecture has
been limited mainly because of the lack of long-term
memory and phenomena like the vanishing gradient
during training (Muraki and et al, 2022). To address
these limitations, architectures such as Long Short-
Term Memory (LSTM) have been proposed (Hochre-
iter and Schmidhuber, 1997). LSTM contains a kind
of memory, known as “forget gate” which enables the
storage of information over a longer period than tra-
ditional RNN. Studies like (Muraki and et al, 2022)
show that LSTMs are more efficient than conventional
RNNs, in this case for the detection of myocardial in-
farction. The main drawback of LSTM is the com-
plexity of its architecture, with a large number of pa-
rameters to be determined. To simplify the LSTM ar-
chitecture, authors in (Cho and et al., 2014) proposed
to merge some of their units, leading to the Gated
Recurrent Unit (GRU). RNN, LSTM and GRU have
been used to extract knowledge from EHR data due to
their ability to handle the sparsity and the irregularity
collection of the data (Liang and Guo, 2023). A com-
parison among these three architectures and simpler
models such as N
¨
aive Bayes was presented in (Bar-
wal and Raheja, 2022) for medical recommendation
systems, showing that GRU offered the best perfor-
mance.
The rest of the paper is structured as follows.
Section 2 presents our database and associated pre-
processing. Section 3 explains the GRU network.
Section 4 details the experimental work and results.
Conclusions and discussion are drawn in Section 5.
2 DATA DESCRIPTION AND
PRE-PROCESSING
This section begins by presenting the system used to
identify chronic patients and continues showing a de-
scriptive analysis of the database. Finally, we explain
the process to adequate the database for utilization by
sequential neural models.
2.1 Clinical Risk Groups
The population classification system named Clin-
ical Risk Groups (CRG), internationally vali-
dated (Hughes et al., 2004) and also used in our pre-
vious works (Soguero et al., 2016) (Soguero et al.,
2020), is also considered here to determine the ground
truth patient’s health status. The CRG system is fed
with demographic data and patient’s clinical encoun-
ters encompassing diagnoses, procedures and medica-
tions for a time period, typically one year. As a result,
the CRG system assigns every patient to one of the
1080 health groups specified by the CRG system. We
only consider data associated with patients older than
18 years.
The CRG categories characterizing the patient’s
health status are identified by a 5-digit code. The first
digit represents the Core Health Status (CHS), being
a number from 1 to 9 with the following meaning:
1, healthy; 2, significant acute disease; 3, single mi-
nor CC; 4, minor CC in multiple organ system; 5,
single dominant or moderate CC; 6, significant CCs
in multiple organ systems; 7, dominant CC in 3 or
more organ systems; 8, dominant and metastatic ma-
lignancies; and 9, catastrophic condition. Note that
CCs are considered in numbers from 5 to 7, and there-
fore CRG categories starting with these numbers are
considered in this work. The next three digits of the
CRG code represent a more specific health condition
and the whole number until the fourth digit is referred
HEALTHINF 2024 - 17th International Conference on Health Informatics
38

as base-CRG. The fifth digit of the CRG code refers
to the severity level of the medical condition. It has
not been considered in this study because of the con-
sequent increase in the number of CRG groups re-
lated to chronic health statuses, and the inherent re-
duction in the number of patients per CRG group,
which would make the design of data-driven mod-
els more difficult. The CRG system considers de-
mographic data (age and sex) and clinical attributes
such as diagnoses coded by the International Classifi-
cation Disease (ICD) system, and drugs coded by the
Anatomical Therapeutic Chemical (ATC) classifica-
tion system (Ronning, 2002) recorded along a period
of time, usually one year in order to allocate.
The CRGs considered in this study are linked to
the CCs indicated in Section 1, resulting in a total of
10 base-CRGs: 3 linked to the core health status iden-
tified by number 5, 3 to the core health status with
number 6, and 4 to the more complex health status
with dominant CC in 3 or more organ systems. For
each base-CRG, we provide next statistics (mean and
standard deviation) of the number of patients per year
(#pats), percentage of women (%W ) and age (Age):
CRG-5179 (CHF)
#pats: 144.5±11.3; %W : 66.05±3.4; Age: 70.3±14.3
CRG-5192 (HT)
#pats: 13307.7±654.7; %W: 55.0±0.6; Age: 58.6±12.4
CRG-5424 (DM)
#pats: 2782.2±6192.9; %W: 40.1±0.2; Age: 54.4±15.4
CRG-6190 (CHF and COPD)
#pats: 128.5±3.6; %W: 42.1±2.8; Age: 74.1±13.1
CRG-6191 (CHF and DIA)
#pats: 153.7±7.9; %W: 62.9±3.9; Age: 73.4±12.3
CRG-6313 (HT and DIA)
#pats: 4061.7±171.6; %W: 49.8±6.0; Age: 64.5±11.6
CRG-7060 (CHF, DIA and COPD)
#pats: 204.5±19.6; %W: 55.3±4.9; Age: 76.6±10.8
CRG-7080 (CHF, DIA and other CC)
#pats: 112.5±10.2; %W: 60.6±2.4; Age: 76.3±12.4
CRG-7081 (CHF, COPD and other CC)
#pats: 231.7±21.3; %W: 53.1±1.3; Age: 80.7±11.4
CRG-7140 (HT, DIA and other CC)
#pats: 3606±79.6; %W: 56.7±2.0; Age: 68.5±11.3
Note that there is no specific CRG group for
COPD in the CHS with number 5. The CRG system
always considers COPD in combination with other
CCs.
The clinical information collected in the EHR de-
pends on the patient’s encounters with the healthcare
system. Thus, if a patient does not have any medical
visits throughout the considered time period, no di-
agnosis will be recorded for that period in the EHR.
Similarly, if the medical visit is not apparently related
with the CC, the CC will not be registered even when
it is present forever. Also, in the EHR of the UHF,
clinical information is registered as text by the practi-
tioner and it is necessary a post-processing stage (usu-
ally by an expert) to translate to clinical codes the text
notes registered by the medical staff.
In the case of medical treatment, the UHF pro-
vides us with drugs: (1) monthly withdrawn by the
patient in any pharmacy of the Madrid region (regard-
less of whether a medical visit is associated or not);
and (2) daily administered to the patient when hospi-
talized in the UHF. In both cases drugs are provided
by using ATC codes, being possible to access them on
a monthly basis.
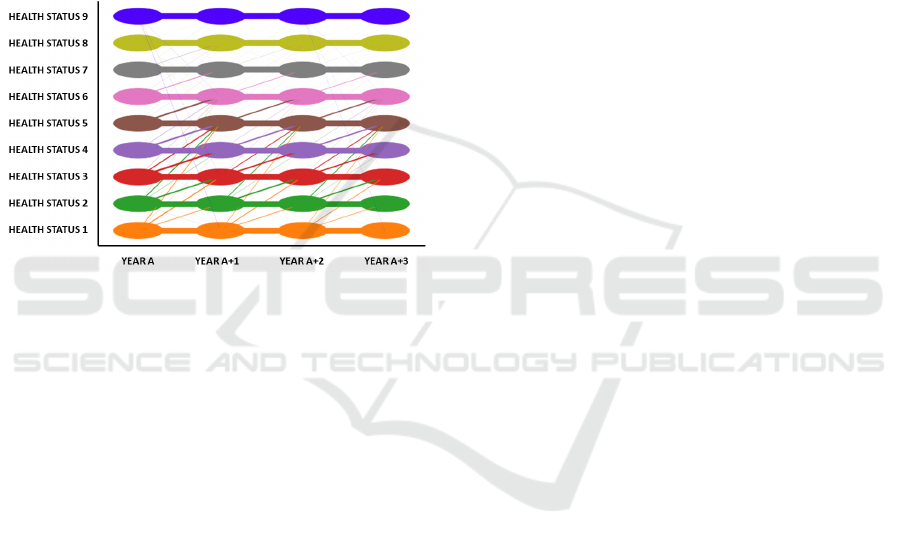
2.2 Preprocesing for Temporal Analysis
Since the patient’s health status can vary over time,
Figure 1 illustrates the patient’s migration among the
9 CHS of the considered base-CRGs for the whole
database of patients linked to the UHF. These migra-
tions are conditioned by data registered in the EHR of
the UHF. Therefore, if a patient linked to the UHF vis-
its this hospital in year A and the same patient visits
both the UHF and another hospital in year A+1, since
EHRs of both hospitals are not connected, only data
registered in UHF will be considered to determine the
patient’s health status. This fact justifies, for exam-
ple, migrations from a chronic disease to non-chronic
disease from one year to another, what it is not pos-
sible from a clinical viewpoint. When observing the
patient’s health status over time, it can be interpreted
as a pattern for the “patient’s trajectory”. In our work,
we encode this pattern as a temporal sequence of 4
numbers, where each number denotes the CHS indi-
cated by the base-CRG during each of the four years
of the temporal sequence considered.
In Figure 1, each CHS is represented by a differ-
ent color, with oval shapes encompassing patients as-
signed to each one. Straight lines represent migra-
tions between CHS in two consecutive years, with the
line thickness being proportional to the number of pa-
tients changing their CHS. Note that the thickest lines
are between consecutive numbers in the CHS.
As for the “patient’s trajectory” pattern, we must
emphasize that, for chronic patients (CHS from 5 to 7)
migrations to a lower CHS are not clinically possible.
However, the CRG system can assign to the chronic
patient a lower number in the base-CRG in Year
A+1
with respect to that in Year
A
. As previously discussed,
this can be motivated because of the lack of clinical
encounters. Therefore, while clinically this situation
might be deemed as an inappropriate patient’s assign-
ment to the base-CRG, it is in accordance with the
Sequential Networks for Predicting the Clinical Risk of Chronic Patients Using Drug Dispensation
39
data recorded for a specific time period.
In this paper we will use patient data for whom
the CRG system has assigned at least one of the base-
CRGs within the scope of any of the four years un-
der examination. Furthermore, we will take into ac-
count that each patient’s trajectory is clinically valid.
Note that the number of patients in each base-CRG
varies annually. On the one hand, certain patients
can worsen their health status and consequently be as-
signed to another of the base-CRGs considered in this
work. On the other hand, it is also possible that even
if the assigned base-CRG corresponds to a worsening
in the patient’s health status, the new base-CRG may
not be taken into account in this study.
Figure 1: Diagram for the patterns of the “patient’s trajec-
tory”.
2.2.1 ATC Selection
To characterize the drug pattern of each patient, a bi-
nary feature vector with as many elements as different
ATC codes there exist (3430), is created. Elements
of the vector for which the drug is included in the
patient’s EHR are set to ‘1’. In our previous stud-
ies (Soguero et al., 2020) (Chushig et al., 2020) (Ju-
rado et al., 2023), these feature vectors have been used
to create profiles of drugs as an exploratory tool. Each
base-CRG has a characteristic drug profile, defined
as a vector with as many elements as different ATC
codes there are (3430). Each vector element contains
the percentage of patients for whom that drug appears
in their EHR over a period of time of one year. There-
fore, the drug profile of each base-CRG shows the
most prevalent drugs in a specific population.
Since the dimension of the vector representing the
patient is large in comparison with the number of
patients in some of the base-CRG (e.g. CRG-5179,
CRG-6190 or CRG-7080), and most of the vector el-
ements are zero, the drug profiles are also used as a
feature selection tool. Thus, the annual drug profile
is computed for each base-CRG and it is subtracted
from the drug profile linked to one of the base-CRG in
the CHS with number 5 (the one with the lowest drug
consumption). Only ATC codes whose absolute dif-
ference in percentage exceeds 5 percent (heuristically
determined by the physicians) are selected. This leads
to a reduction in the dimension vector from 3430 fea-
tures to 161 features.
2.2.2 Monthly ATC Vectors
It is convenient to pre-process the binary ATC vectors
so that there is no spurious zero values in drugs usu-
ally used to deal with CCs when fed to the RNN ar-
chitectures. Apart from that, no pre-processing could
cause difficulties in learning due to the presence of
feature vectors with all elements being zero. There-
fore, since drug data should be regularly provided
for dealing with CCs, later in this document we will
use sliding windows (Qiao and et al, 2003) to prop-
agate the value ‘1’ linked to a specific drug over a
few months. Though the sliding window length can
directly affect to the model performance, results pro-
vided in this work have been obtained with a length
of three months. This value has been heuristically de-
termined to reduce the noise that would be produced
by considering only monthly records. Note that the
patient could be on vacation away from the Madrid
region and the medications dispensed in this period
would not be recorded in the considered EHR. There-
fore, patients would be represented with a vector of
all zeros regardless of their real health status. As a
compromise solution, and after a previous study in
which window lengths of 2, 3, 4 and 5 months were
evaluated, we decided to choose the 3-month window
length.
Though interesting, a systematic study of the slid-
ing window length to provide recommendations for
choosing the appropriate window length is out of the
scope of this work.
To illustrate this pre-processing, the upper panel
in Figure 2 shows the window length encompassing
drug feature vectors over three months for a certain
patient. For each sliding window, the most recent
month is considered as the “center” of the window
(represented by a stethoscope). Sliding windows are
depicted by rectangular shapes in the same color as
that of the corresponding stethoscope. Elements in
the drug feature vector set to ‘1’ (registered in the pa-
tient’s EHR) in that specific month are marked by a
symbol (different symbol per drug).
The bottom panel shows the pre-processed drug
feature vectors, with marks (triangles and stars) in-
dicating values set to ‘1’, either because the original
vector had this value or because one of the two pre-
vious months (encompassed by the sliding window)
had it.
HEALTHINF 2024 - 17th International Conference on Health Informatics
40

Figure 2: Upper panel represents the original binary vectors
assigned to certain patient from January to March. Bottom
panel shows the pre-processed vector for the same months
after applying the sliding window of 3-month length, which
center is positioned in the month indicated by the stetho-
scope symbol in the upper panel.
3 GATED RECURRENT
NETWORKS
RNNs stand out by its ability to work with longitudi-
nal data by using interconnected cells in the recurrent
layer of neurons. Vectors x
<t>
are presented to each
cell. Additionally, in the recurrent layer the output
of every cell, known as the hidden state a
<t>
, is also
considered as input to the next cell (related to the next
“time instant”). Thus, the hidden state of the cell is
propagated throughout the network and contains in-
formation of previous time data, which are succes-
sively transmitted to the following cells. The hidden
state a
<t>
is obtained using Eq. (1), being a
<t−1>
the
previous cell state and x
<t>
the new temporal input
vector (Jordan et al., 2021)
a
<t>
= g(W
a
[a
<t−1>
, x
<t>
] + b
a
) (1)
with g(.) the activation function, W
a
the coefficient
matrix and b
a
the bias learned during training. The
main drawback of traditional RNNs is that they are
highly sensitive to the most recent events regardless
the importance of older events. This has lead to new
RNN-based architectures such as the GRU-RNN ap-
proach (Liang and Guo, 2023), which can be divided
in two different stages: the encoding stage, where the
information is stored in the hidden states; and the de-
coding stage, with the purpose of making predictions
y
<t>
according to the current and past input vectors.
In our scenario, predictions are associated with the
clinical risk of the patient for each of the ten base-
CRGs here considered. Cells in the recurrent layer
of the GRU-RNN consider two functions named as Γ,
working as gates that control what is stored in the hid-
den state, performing as a memory. On the one hand,
the reset gate Γ
r
selects the information of the hid-
den state that the network should keep/forget. On the
other hand, the update gate Γ
u
determines how much
the network parameters should be modified according
to the Γ
r
gate. Finally, W
r
, W
u
and W
a
are coefficient
matrices to be determined in training.
Figure 3: GRU-RNN architecture composed by 24 cells
(each cell is linked to monthly data for two consecutive
years). Colored in green is the pre-processed sample vec-
tor, in yellow the initialization vector.
The set of functions in the GRU architecture can
be summarized by the following equations:
Γ
r
= σ(W
r
[a
<t−1>
, x
<t>
])
Γ
u
= σ(W
u
[a
<t−1>
, x
<t>
])
˜
a
<t>
= tanh(W
a
[Γ
r
∗ a
<t−1>
, x
<t>
])
a
<t>
= (1 − Γ
u
) ∗ a
<t−1>
+ Γ
u
∗
˜
a
<t>
where σ and tanh denotes the logistic and hyperbolic
tangent function, respectively. The GRU-RNN archi-
tecture considered in this work as the encoder stage
is shown in Figure 3. Note that the recurrent layer
is composed of 24 cells. The predicted base-CRG is
obtained as the one linked to the maximum value of
y
<t>
= so f tmax(W
f
a
<24>
+ b
f
)
with W
f
and b
f
being the coefficient matrix and bias
vector to be learned. Next section provides details
about the processing applied to the original sequences
to determine the number of required cells.
4 EXPERIMENTAL SETUP AND
RESULTS
The set of patients X presented in Section 2 is split
into design (X
D
) and test sets (X
T
), with the propor-
tion of 70%- 30% and following a criterion related to
the pattern of the “patient’s trajectory”. Thus, if there
is only one patient in the database associated with a
four-year trajectory pattern, the patient is assigned to
X
D
. However, in cases where several patients follow
the same pattern, they are randomly assigned to X
D
and X
T
, trying to maintain the split proportion in de-
sign and test sets. Next, the X
D
set is split into training
(X
train
) and validation (X
val
) subsets in a 80% -20%
proportion (Bishop, 2010).
Sequential Networks for Predicting the Clinical Risk of Chronic Patients Using Drug Dispensation
41

As previously indicated, sequences of four years
(48 months) can have many zero vectors, hamper-
ing the network training. To address this issue, we
propose here to deal with sequences of two consec-
utive years (instead of four years) and discard those
sequences such that the target base-CRG is not one
of those considered in Section 2. Thus, for each pa-
tient we generated three potential inputs to the se-
quential network, each one composed by two con-
secutive years, i.e., Year
A
-Year
A+1
, Year
A+1
-Year
A+2
,
and Year
A+2
-Year
A+3
. Each sequence of two years is
composed by 24 ATC binary vectors (one per month).
As illustrated in Figure 4, we have only considered se-
quences of two consecutive years such that the base-
CRG linked to the most recent year is among those in
Section 2. For those sequences, the target output in
the sequential network is the base-CRG of the most
recent year.
Figure 4: Two patients and corresponding base-CRG for
four consecutive years (from Year
A
to Year
A+3
). Green
color denotes ATC vectors of the year associated with one
of the considered base-CRG, while yellow color indicates
that the base-CRG is not one of those indicated in Section 2.
For each patient, the three right panels show the three pairs
of two consecutive years. Only pairs such that the most re-
cent year is green-coloured are kept, with the rest of pairs
being discarded (see red arrows).
Experiments with two GRU-RNN architectures
were performed. We first consider a basic architec-
ture as the one presented in Figure 3, composed of a
total of 24 input cells (each cell with a binary 161-
dimensional input, as indicated in Section 2) and just
using temporal data, with a
<0>
initialized to zero val-
ues. Secondly, we extend this architecture to include
non-temporal data in the form of context information
as age. This is motivated by the exploratory analysis
in Section 2, showing a different value of the average
age for some base-CRGs. For this purpose, a layer of
161 neurons is used to transform the scalar input (age)
into a 161-dimensional vector a
<0>
that can be fed to
the GRU-RNN. Note that the second architecture also
requires to find during training the parameter’s vector
linked to the age layer. Before training, the age fea-
ture is normalized within the interval [0, 1] by apply-
ing a robust to outliers scaler using the 5th percentile
and the 95th percentile of the age distribution in X
train
as a substitute for the min-max normalization.
For both architectures the network learning is per-
formed using the Adam algorithm (Kingma and Ba,
2015) with early stopping (Bishop, 2010) on the vali-
dation loss function (cross-entropy). For the learning
rate we explored a range of values between 0.005 and
0.01, with almost no difference in performance when
considering different values. However, the batch size
was very influential, with very bad results when it was
lower than 100 sequences. This may be motivated be-
cause using less than 100 sequences associated with
10 different targets did not statistically encompass a
representative number of the ten base-CRGs. Due
to the high class imbalance in our data set, also a
weighted cost function was applied to penalize er-
rors in the minority classes in the same proportion
than in the majority class. Analyzing the evolution
of the loss function on the validation set, we observed
that convergence is achieved in 175 epochs for the ba-
sic GRU-RNN architecture, and even before when in-
cluding the patient’s age.
The prediction results are presented as confusion
matrices in Fig. 5 for both models: panel (a) for the
basic GRU-RNN architecture, and (b) when including
the age. Values presented in cells in Figure 5 represent
percentages relative to the total number of sequences
for each class on the test set (i.e., the sum of values
in each row is 1). The number of considered two-
year sequences after pre-processing in the design/test
sets is (in ascending order of the base-CRG num-
ber): 328/64, 1937/736, 950/593, 255/91, 323/97,
1306/652, 375/207, 217/88, 436/182, 629/344.
The analysis of these results evidences that the
prediction of the base-CRGs associated with the CHS
with number 5 (single dominant or moderate CC) is
quite accurate (above 70% for all base-CRGS and
even reaching 90% in some cases). For the rest of
the base-CRGs, results are not so impressive but also
are quite reasonable (values nearly to or above 50%
in most cases) taking into account there are 10 classes
(random choice corresponds to an accuracy of 10%)
and that CHS with numbers 6 and 7 correspond to
complex health statuses. Most of the misclassifica-
tions are between base-CRGs related with the same
CC, excepting the CRG 6190 (CHF and COPD),
which the GRU-RNN assigns to the CRG 5424 (DIA).
We speculate this could be motivated by medications
such as acetylsalicylic acid, used in diabetic patients
HEALTHINF 2024 - 17th International Conference on Health Informatics
42
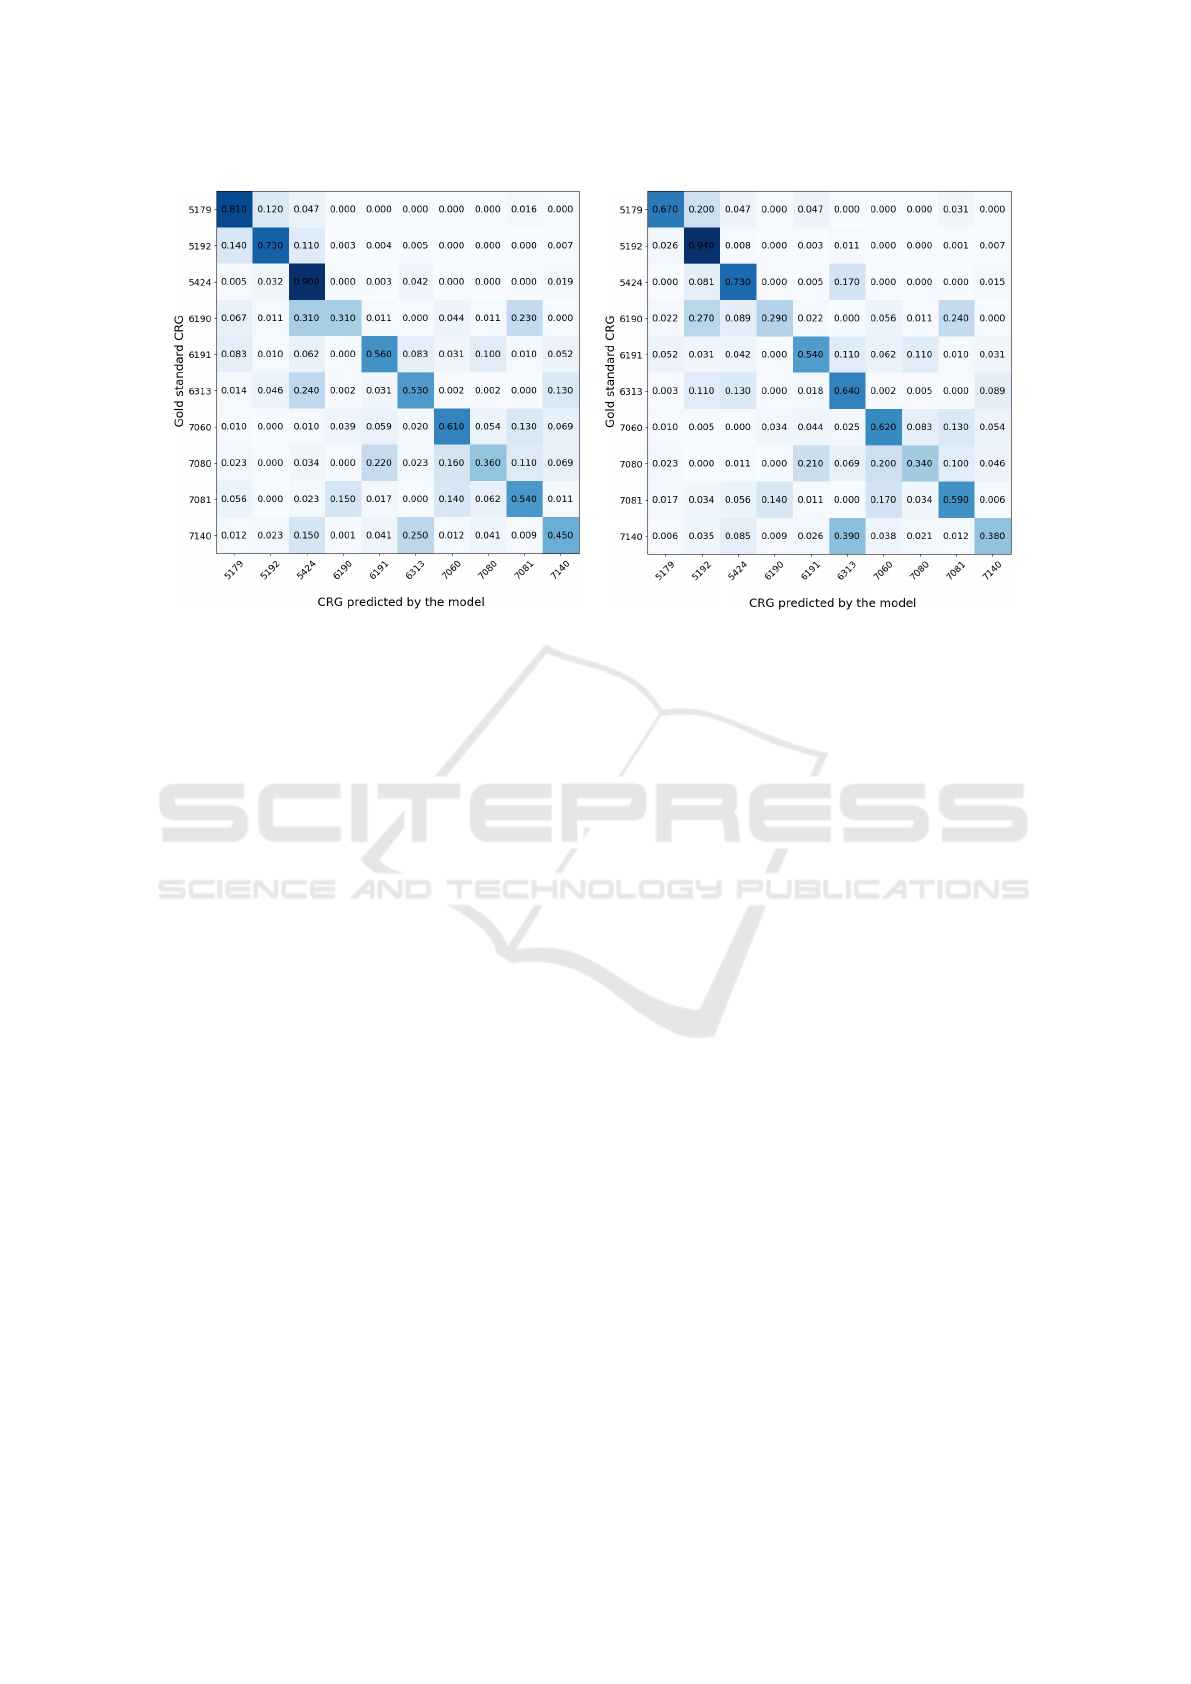
(a) (b)
Figure 5: Confusion Matrix on the test set: (a) Considering the GRU-RNN architecture using only ATC codes; (b) Considering
the GRU-RNN architecture with ATC codes and demographic data.
for the primary prevention of cardiovascular prob-
lems. Interestingly, when the age is included in the
GRU-RNN, the CRG 5192 (HT) is the one with more
incorrect assignments, probably because the average
age in the base-CRG 5192 is more similar to that in
the CRG 6190 (when compared to the age in the CRG
5424). When comparing percentages of both confu-
sion matrices, note that more sequences are assigned
to the CRG 5192 when including age as context infor-
mation.
5 CONCLUSIONS AND
DISCUSSION
Chronic diseases have a significant sociosanitary and
economic impact on the healthcare systems, as evi-
denced by the substantial investments made by health-
care authorities. In this scenario, the use of ML-based
tools to extract knowledge from longitudinal data reg-
istered in the EHR is of vital importance for finding
associations among features and the clinical progres-
sion of patients. In this way, the future patient’s health
status could be predicted, thereby facilitating the im-
plementation of preventive measures and enhancing
the effectiveness of strategic planning.
In this paper, several pre-processing stages have
been considered to handle the temporal dimension of
the data, from the use of sliding windows to the split
of the original four-year sequence. This split allowed
to simultaneously reduce both the number of cells
(and associated parameters) in the GRU-RNN and
increase the number of observations used for learn-
ing. As a future work, we propose to replace the
sliding window with the use of a “forget factor func-
tion” which exponentially gives less weight to the
registration of ATC codes as time evolves. On the
one hand, the use of such a function would allow to
have numerical (non-binary) vectors for the sequen-
tial data, probably enhancing the learning process. On
the other hand, a different decay rate of the expo-
nential weighting function could be used for generic
drugs and for specific drugs for dealing with CCs,
therefore including context information in the tem-
poral sequence. Also, to overcome the class imbal-
ance in training it could be convenient to use synthetic
sequences by means of Generative Adversarial Net-
works (Jurado et al., 2023).
The use of GRU-RNN networks for predicting the
clinical risk of chronic patients has been evaluated in
this work. Taking into account that we considered 10
base-CRGs (targets) and that the gold-standard was
determined including more clinical data (diagnoses
and procedures) than those considered here, our re-
sults are quite promising. In particular, accuracy rates
higher than 70% were achieved for single dominant
or moderate CC, and close to 50% for significant or
dominant CCs in multiple organs. Though the re-
sults obtained by incorporating the demographic layer
did not improve significantly those achieved when
considering only ATC codes, our findings highlight
the importance of including contextual information in
certain situations, showing the potential of the con-
Sequential Networks for Predicting the Clinical Risk of Chronic Patients Using Drug Dispensation
43

sidered architecture. It is clear that considering other
data related to genetic factors or lifestyle can intro-
duce some context to the network that could improve
considerably our results.
ACKNOWLEDGMENT
This work has been partly supported by the
Spanish Research Agency, grant number PID2019-
106623RB-C41/AEI/10.13039/501100011033 (Big
Theory), PID2022-136887NB-I00 (POLIGRAPH)
and by the European Union NextGeneration-EU
funds (Youth Employment Plan of the Spanish Gov-
ernment) in the INVESTIGO project with reference
URJC-AI-11.
REFERENCES
Anderson, G. and Horvath, J. (2004). The growing burden
of chronic disease in america. Public Health Reports,
119(3):263–70.
Ansah, J. P. and Chiu, C.-T. (2023). Projecting the chronic
disease burden among the adult population in the
united states using a multi-state population model.
Frontiers in Public Health, 10:1082183.
Barwal, R. K. and Raheja, N. (2022). Comparative analy-
sis of recommendation systems based on medical data
sets. In Intl Conf on Advances in Computing, Comm.
Control and Networking, pages 739–46. IEEE.
Bishop, C. M. (2010). Pattern Recognition and Machine
Learning. Springer.
Boyd, C. M. and Fortin, M. (2010). Future of multimorbid-
ity research: how should understanding of multimor-
bidity inform health system design? Public Health
Reviews, 32(2):451–74.
Brennan, P. and et al (2017). Chronic disease research in
europe and the need for integrated population cohorts.
European Journal of Epidemiology, 32:741–49.
Care, D. (2019). Standards of medical care in diabetes 2019.
Diabetes Care, 42(Suppl 1):S124–38.
Cho, K. and et al. (2014). Learning phrase representations
using RNN encoder-decoder for statistical machine
translation. arXiv preprint arXiv:1406.1078.
Chushig, D., Soguero, C., de Miguel, P., and Mora, I.
(2021). Interpreting clinical latent representations us-
ing autoencoders and probabilistic models. Artificial
Intelligence in Medicine, 122:102211.
Chushig, D., Soguero, C., de Miguel, P., and Mora, I.
(2022). Learning and visualizing chronic latent rep-
resentations using electronic health records. BioData
Mining, 15(1):1–27.
Chushig, D., Soguero, C., Engelbrecht, A., de Miguel, P.,
and Mora, I. (2020). Data-driven visual characteri-
zation of patient health-status using electronic health
records and self-organizing maps. IEEE, 8:137019–
31.
Hochreiter, S. and Schmidhuber, J. (1997). Long Short-
Term Memory. Neural Computation, 9(8):1735–80.
Hoffman, J. M. and et al (2012). Projecting future drug
expenditures—2012. American Journal of Health-
System Pharmacy, 69(5):405–21.
Hughes, J. S., Averill, R. F., et al. (2004). Clinical risk
groups (crgs): a classification system for risk-adjusted
capitation-based payment and health care manage-
ment. Medical Care, pages 81–90.
Jordan, I. D., Sok
´
oł, P. A., and Park, I. M. (2021). Gated
recurrent units viewed through the lens of continuous
time dynamical systems. Frontiers in Computational
Neuroscience, 15:678158.
Jurado, T., Chushig, D., Soguero, C., de Miguel, P., and
Mora, I. (2023). On the use of generative adversarial
networks to predict health status among chronic pa-
tients. In Intl Conf Health Informatics, pages 167–78.
Kingma, D. P. and Ba, J. L. (2015). Adam : A method
for stochastic optimization. In Intl Conf on Learning
Representations.
Levin, E. (1990). A recurrent neural network: Limitations
and training. Neural Networks, 3(6):641–50.
Liang, Y. and Guo, C. (2023). Heart failure disease predic-
tion and stratification with temporal electronic health
records data using patient representation. Biocyber-
netics and Biomedical Engineering, 43(1):124–41.
Miotto, R. and et al (2016). Deep patient: an unsupervised
representation to predict the future of patients from the
electronic health records. Scientific Reports, 6(1):1–
10.
Muraki, R. and et al (2022). Automated detection scheme
for acute myocardial infarction using convolutional
neural network and long short-term memory. PLOS
ONE, 17(2):1–22.
Pawlson, L. G. (1994). Chronic illness: implications of a
new paradigm for health care. The Joint Commission
Journal on Quality Improvement, 20(1):33–39.
Petrides, J. and et al (2019). Lifestyle changes for disease
prevention. Primary Care: Clinics in Office Practice,
46(1):1–12.
Qiao, L. and et al (2003). Supporting sliding window
queries for continuous data streams. In Intl Conf
on Scientific and Statistical Database Management,
pages 85–94. IEEE.
Ronning, M. (2002). A historical overview of the atc/ddd
methodology. World Health Organization Drug Infor-
mation, 16(3):233.
Soguero, C., Alonso, N., Mu
˜
noz, S., Rojo, J. L., Rubio, M.,
Caballero, I., and Mora, I. (2020). Finding associa-
tions among chronic conditions by bootstrap and mul-
tiple correspondence analysis. In Intl Conf on Bioin-
formatics and Biomedicine, pages 2066–73. IEEE.
Soguero, C., de Miguel, P., and Mora, I. (2016). A data-
driven model based on support vector machine to
identify chronic hypertensive and diabetic patients. In
Phys. Computing Systems, pages 110–29. Springer.
Wang, H. and Wang, L. (2017). Modeling temporal dynam-
ics and spatial configurations of actions using two-
stream recurrent neural networks. In IEEE Conf on
Computer Vis. and Pattern Recogn., pages 499–508.
HEALTHINF 2024 - 17th International Conference on Health Informatics
44
