
Garment Returns Prediction for AI-Based Processing and Waste
Reduction in E-Commerce
Marie Niederlaender
a
, Aena Nuzhat Lodi
b
, Soeren Gry
c
, Rajarshi Biswas and Dirk Werth
d
August-Wilhelm Scheer Institut, Uni Campus D 5 1, Saarbr
¨
ucken, Germany
{firstname.lastname}@aws-institut.de
Keywords:
Returns Prediction, Machine Learning, Recommendation System, Sustainable Return Management,
E-Commerce, Fashion, Apparel, Artificial Intelligence.
Abstract:
Product returns are an increasing burden for manufacturers and online retailers across the globe, both economi-
cally and ecologically. Especially in the textile and fashion industry, on average more than half of the ordered
products are being returned. The first step towards reducing returns and being able to process unavoidable
returns effectively, is the reliable prediction of upcoming returns at the time of order, allowing to estimate
inventory risk and to plan the next steps to be taken to resell and avoid destruction of the garments. This
study explores the potential of 5 different Machine Learning Algorithms combined with regualised target
encoding for categorical features to predict returns of a German online retailer, exclusively selling festive
dresses and garments for special occasions, where a balanced accuracy of up to
0.86
can be reached even for
newly introduced products, if historical data on customer behavior is available. This work aims to be extended
towards an AI-based recommendation system to find the ecologically and economically best processing strategy
for garment returns to reduce waste and the financial burden on retailers.
1 INTRODUCTION
Global fashion e-commerce is estimated to have
reached a global size of US $871.2 billion in 2023
and is therefore the largest B2C e-commerce market
segment, expecting further growth at a rate of 11.5 %
per year (Statista, 2023). In 2022, the vast majority
of returned packages in Europe are associated with
the fashion sector, in Germany as much as 91% of
returned goods were fashion items (Forschungsgruppe
Retourenmanagement, 2022). The ever-increasing
number of returns results not only in high economical
costs for e-commerce retailers, but also in an increas-
ing burden for the environment: Due to the additional
(financial) effort needed to resell returned items, send-
ing returned items to landfill is one solution a lot of
businesses opt for. It is estimated that in Germany in
2021 alone, about 17 million returned items were dis-
posed and that the disposal rate for returns in other Eu-
ropean countries is even higher (Forschungsgruppe Re-
tourenmanagement, 2022). Returns also play a big role
a
https://orcid.org/0009-0008-1935-821X
b
https://orcid.org/0009-0001-4739-4743
c
https://orcid.org/0000-0002-4441-0517
d
https://orcid.org/0000-0003-2115-6955
when it comes to CO
2
emissions, contributing to the
5% of global emissions created by the fashion industry.
This makes the fashion industry one of the three most
polluting sectors in the world (Vogue/BCG, 2021).
The average CO
2
equivalent caused by a single re-
turned package is valued at 1.5 kg (Forschungsgruppe
Retourenmanagement, 2022). In order to reduce the
environmental and economical impact of product re-
turns, the best way is to reduce returns in total. There
are preventative strategies, but also reactive strategies
with regards to this issue (Deges, 2021), because some
returns are inevitable, for example when customers
order one item in different sizes or colours with the
intention to keep only one or few of them, a custom re-
ferred to as bracketing which is prevalent with fashion
products (Bimschleger et al., 2019). Even when only
one item is ordered, there are several possibilities why
a garment is returned. It can be due to a wrong size,
bad fit, personal preference, unmet expectations due
to a discrepancy between how the product is displayed
online versus its appearance in real life, or even be-
cause of insufficient quality or damaging. No matter if
a preventive or reactive strategy is chosen to tackle the
issue, the first step to be able to act is to be prepared,
so this study investigates different methods to predict
fashion product returns utilizing several machine learn-
156
Niederlaender, M., Lodi, A., Gry, S., Biswas, R. and Werth, D.
Garment Returns Prediction for AI-Based Processing and Waste Reduction in E-Commerce.
DOI: 10.5220/0012321300003636
Paper published under CC license (CC BY-NC-ND 4.0)
In Proceedings of the 16th International Conference on Agents and Artificial Intelligence (ICAART 2024) - Volume 2, pages 156-164
ISBN: 978-989-758-680-4; ISSN: 2184-433X
Proceedings Copyright © 2024 by SCITEPRESS – Science and Technology Publications, Lda.

ing algorithms. This paper is part of a wider scope of
research that aims at using return predictions to cre-
ate an AI-based recommendation system for the more
(cost-)effective and eco-friendly handling of unavoid-
able returns. Section 2 of this paper states different
studies that have been performed in the area of product
returns prediction and gives an overview of the dif-
ferent methods used and circumstances that had most
impact on increased or decreased return probabilities.
After describing the data utilised in this study in sec-
tion 3, we describe the steps undertaken and machine
learning methods used to make reliable return predic-
tions in section 4. In section 5, we discuss the results
using the performance measures Balanced Accuracy,
Area under the ROC-Curve (AUC), Precision and Re-
call to get the full picture on the model’s strengths
and shortcomings. The results are compared for the
introduction of new products with unknown return his-
tory, for future orders or a selection of random orders,
respectively. The final section gives a summary of the
findings and gives an outlook on possibilities for fu-
ture research based on research gaps and shortcomings
identified in this paper.
2 RELATED WORK
The causes of returns can be many and varied. In
order to capture the possible drivers and returns in the
fashion and apparel sector, research in recent years
has used a variety of techniques related to machine
learning algorithms (Gry. et al., 2023). A selection of
current approaches is presented below.
Feature Selection, ML Models and Analysis
Methods: In fashion e-commerce, retailers typically
work with large data sets, some of which contain lit-
tle usable information. It is often an aggregation of
a large number of data points, only a few of which
contribute to the quality of the ML models. However,
in order to make accurate predictions of returns, it
is important that the ML models contain informative
features. To assist in the selection of these features,
Urbanke et al. (2015) developed Mahalanobis feature
extraction in their research to help reduce the dimen-
sionality of large sparse datasets. During development,
the authors were able to draw on returns data from a
large German fashion retailer. Mahalanobis was able
to reduce the required storage capacity by more than
99%, outperforming the other feature extraction meth-
ods investigated in the study.
T
¨
uyl
¨
u and Ero
˘
glu (2019), for example, have been in-
volved in testing and comparing different ML models
in the context of predicting returns. They tested func-
tional, rule-based, lazy and decision tree algorithms.
The best performer was the M5P decision tree algo-
rithm, which combines elements of decision trees and
multiple linear regression. In the rule-based segment,
M5Rules and Decision Table performed similarly well.
Support Vector Regression and Linear Regression also
performed well among the functional algorithms.
Asdecker and Karl (2018) compared simple data min-
ing methods with complex data analysis methods to
assess their suitability for predicting customer returns.
They were able to use data on delivery and returns
information. Positive correlations with the likelihood
of returns were found for the number of items in the
parcel, the total value of the items in the parcel and
the age of the customer account. Delivery time was
negatively correlated. When comparing analysis meth-
ods, even simple data mining methods such as binary
logistic regression and linear discriminant analysis did
not perform much worse than more complex methods
such as ensembles (Asdecker and Karl, 2018).
In another study, Asdecker et al. (2017) used linear and
logistic regression to examine data sets from a German
online shop specialising in women’s clothing. Vari-
ables used included coupons, payment method, order
and return history, and basket contents. The highest
information content for predicting the likelihood of re-
turns was found when using historical returns informa-
tion for each item and customer. The impact of adding
a free gift to the order was also examined. Among
other things, the study found that ordering the same
garment in different colours reduced the likelihood of
returns. The addition of a free gift also reduced the
likelihood of returns in the study. On the other hand,
the likelihood of returns increased when paying on
account, using a voucher and as the average price of
the order increased.
Customer Reviews, Prices, Promotions and Pay-
ment Methods: Sahoo et al. (2018) used a two-stage
probit model, a type of binary regression model (Heck-
man, 1979), to investigate how product reviews affect
purchases and returns. They found that products with
fewer product reviews led to more bracketing. Brack-
eting refers to the consumer behaviour of ordering a
selection of items with the aim of keeping only a frac-
tion of them after trying them on (Bimschleger et al.,
2019). On the other hand, items with a large number
of reviews were less likely to be returned. The influ-
ence of item price on the likelihood of return was also
examined. Higher prices showed a lower likelihood
of returns than lower prices, which is attributed to the
mental effort consumers put into deciding to buy ex-
pensive items.
Free shipping is also considered to be a significant fac-
Garment Returns Prediction for AI-Based Processing and Waste Reduction in E-Commerce
157

tor influencing the likelihood of returns. Shehu et al.
(2020) used a Type II Tobit model (Van Heerde et al.,
2005) in their study. They found that free shipping pro-
motions increase the willingness to buy items that are
more difficult to evaluate from the customer’s point of
view, and thus also increase the likelihood of returns.
General free shipping offers outside of promotions
also show an increased likelihood of returns (Lepthien
and Clement, 2019).
Yan and Cao (2017) examined the effect of payment
method and product variety on the likelihood of returns.
The payment method proved to be a good indicator of
the likelihood of returns. When customers paid in cash,
they were less impulsive and made fewer non-essential
purchases than when they paid by credit card, and were
therefore less likely to return. They also found that
the likelihood of returns decreased with the variety of
items, such as shoes, clothing and accessories. In con-
trast to bracketing, this does not involve the selection
of multiple items to try on.
3 DATASET
The data used in this work consists of sales and re-
turns data logged via the retailer’s ERP-System. We
have been provided a subset of this data, containing all
the sales and returns made via an online-marketplace
for fashion, starting from April 1st 2022 until March
31st 2023. To exclude any effects of the Covid-19
Pandemic and data at the end of the period where re-
turns were yet to come in, only data from September
1st 2022 to February 26 2023 was used for the pre-
dictions. The data consists of two tabular datasets,
namely sold articles and returned articles, where each
instance represents a single product that has been sold
or returned. The entries can be clustered into orders or
returns of multiple products using a unique order-ID
and a soldarticle-ID, which represents a product in
a specific size and colour. The same method allows
to link the tables to form one table containing sales,
customer and product information and the boolean
target-column stating if the sale has been returned or
not. The dataset contains information on the price and
properties of items such as their colour and material,
but also on the city of the customer, order date and a
customer ID to identify if a customer ordered multiple
times. The overall return probability in this dataset is
P(r) = 0.73
, which may be higher then other average
return rates due to the specialisation on festive dresses
and garments which gives rise to other fitting standards
and different consumer behavior compared to everyday
wear. Based on a random sample for a given customer,
estimates of the conditional return probabilities have
been extracted. For the group of customers where the
first sample was a return, the return probability for
the remaining instances is
P(r|y = 1) = 0.85
. For the
other group of customers, namely where the first sam-
ple was not a return, the return probability decreases to
P(r|y = 0) = 0.56
for the remaining instances, which
indicates that for customers who returned once, the
probability that they return increases for the remainder
of their orders.
4 EXPERIMENT SETUP
In the scope of this paper, we investigate 5 different
ML algorithms using different settings for training and
optimisation. The following paragraphs describe the
steps that were undertaken for imputation, automated
feature selection, feature engineering, encoding and
hyperparameter tuning, which were the same for each
of the five algorithms. Additionally, 3 settings were set
for model training and hyperparameter optimisation to
further investigate which aspects affect performance
in which way.
Imputation, Automated Feature Selection and
Feature Engineering: As the first step of prepro-
cessing, columns and rows with small or no infor-
mational use were dropped. Some feature columns
were removed manually beforehand when there was
no possible dependency between the feature and the
target. Remaining missing values were filled with
−1
for numerical and with a blank string for categorical
variables. Decision factors for automated removal of
features were, if the percentage of missing values was
over a certain threshold of
50%
or if there was only
one feature value. Furthermore, for each feature pair,
redundant features were dropped if the Pearson cor-
relation coefficient exceeded
0.95
. Features with no
correlation to the target variable were dropped. To
feed the models information on different materials and
material combinations of garments, different fabric
types were extracted from the product description and
added as binary features. New features were also cre-
ated to reflect properties concerning each order as a
whole and making bracketing behavior by customers
more apparent. Features added were the number of
items in a given order, the number of same items in the
same colour, same size or clothing category (features
1-3 in Table 1). However, the creation of the remain-
ing features mentioned in Table 1 was necessary to
exceed a balanced accuracy of
0.61
for any of the ML
algorithms employed which indicates that historical
customer behavior as well as order-related observa-
tions give important insights to potential returns. One
ICAART 2024 - 16th International Conference on Agents and Artificial Intelligence
158

Table 1: Features that were created to target different aspects of consumer behavior, such as general return behavior, bracketing,
ordering for other people or impulse purchases and literature referring to this consumer behavior or investigating said features.
Nr Feature Explanation Literature
1
number of same items in
the same size for given
order ID
multiple items were ordered in the same size
but possibly in another colour, potential brack-
eting behavior
Makkonen et al. (2021),
Asdecker et al. (2017),
Yan and Cao (2017),
Bimschleger et al.
(2019)
2
number of same items in
the same colour for given
order ID
multiple items were ordered in the same
colour but possibly in a different size, poten-
tial bracketing behavior
3
number of items in
the same category (e.g.
dress, pants..) for a given
order ID
multiple items from the same category were
ordered, potential bracketing behavior, lack of
diversity in order
4
number of same items in
an order for a given order
ID
the same item was ordered multiple times, pos-
sibly in different colours and sizes, potential
bracketing behavior
5
number of items in one
order
correlation of larger number with larger returb
probability, potential bracketing behavior
Asdecker and Karl
(2018)
6
number of days since the
last order
see if and how recently a customer last or-
dered something; for first time customers
value is set to > 400 days
Yan and Cao (2017)
7
number of days since last
ordering same item
see if and how recently a customer ordered the
same item; ordering the same item again may
indicate stronger intention to keep/ ordering
correct size when ordering again; for first time
ordering item value is set to > 500 days
8
historical return probabil-
ity of customer
if less than 4 entries use
P(r|y = 1)
if major-
ity is true, else use
P(r|y = 0)
; if there’s no
majority, use P(r|y = 1)
Cui et al. (2020), As-
decker et al. (2017)
9
size varies by more than
1 value within a given or-
der for given clothing cat-
egory
potential bracketing behavior, indicator that
part of order is for other people
Makkonen et al. (2021)
10
size deviates usual for
given clothing category
bool variable indicating if a customer orders
their historical size or not
11, 12
relative and absolute dis-
count on an item
indicator for impulse purchase; unclear if rel-
ative or absolute value has more effect
Asdecker et al. (2017)
13, 14
relative and absolute dis-
count on order
to observe the effect of discounts on order
level
possible explanation for this observation is that the ma-
jority of return reasons do not depend on the specific
item and its properties, but on the context in which the
order has been placed, like the customer ordering a se-
lection of items with the intention to only keep one or a
few and some customers being more prone to returning
more frequently, as the difference between the prob-
abilities
P(r|y = 0)
and
P(r|y = 1)
suggests. Further,
the average return probability on order level increases
from
P
order
(n
items
= 1) = 0.73
for orders containing a
single item to
P
order
(n
items
> 1) = 0.94
for orders con-
taining at least two items, which underlines the effect
that bracketing behavior has on return volume. For
the 14 newly engineered features, no elimination tech-
niques were used and all of them were incorporated
into the final ML models. This procedure resulted
in a total of
48
features, including the 14 engineered
features (Table 1) for reflecting customer behavior.
These features were created based on indicators for
frequently returning customers, customers ordering for
other people, and customers ordering a selection of
items, for example in different sizes, with the intention
Garment Returns Prediction for AI-Based Processing and Waste Reduction in E-Commerce
159
to return most of them. The remaining features are a
set of boolean features for different materials, a colour
feature, customer-ID, article-ID (not unique regarding
size or colour), soldarticle-ID (unique regarding size
and colour), day, month and year of the order, the price
of the item, the total price of the order, the weight of
the garment, the product line, the style and fit, the
country it has been manufactured in and the clothing
category (e.g. dress, pants, bolero, skirt).
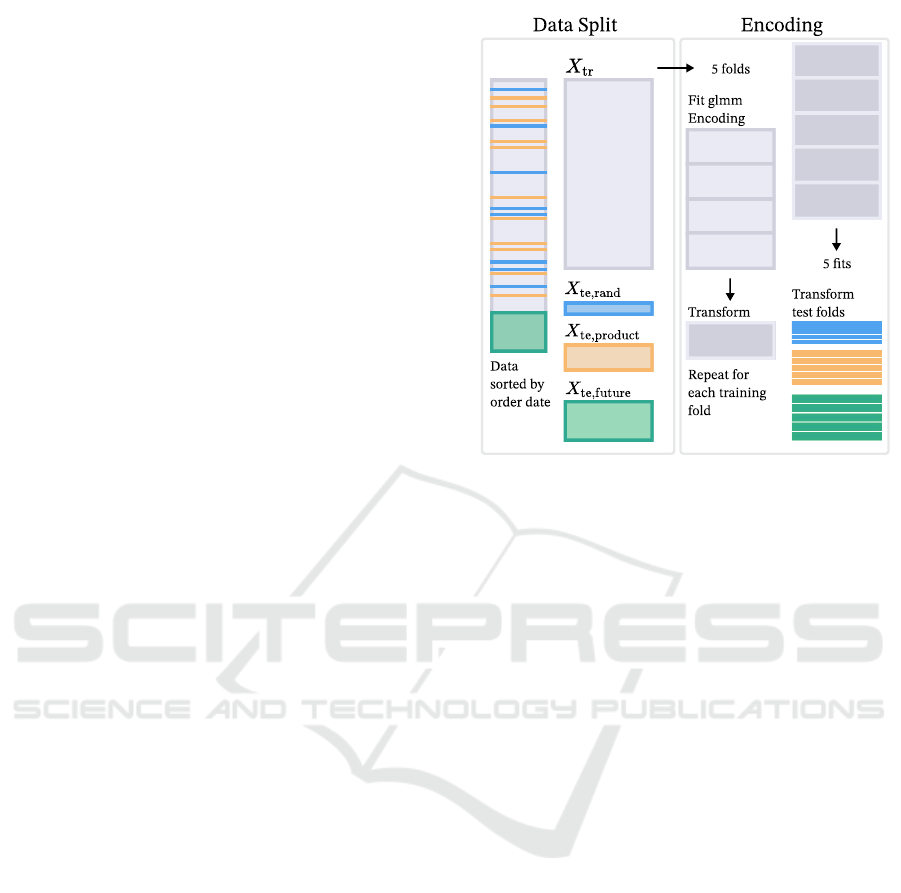
Encoding and Scaling: Numerical features were
scaled to have unit variance and a mean of zero. The
dataset contains many high cardinality categorical fea-
tures, which can be a problem when it comes to choos-
ing an encoding technique. As in a recent benchmark
study by Pargent et al. (2022), regularised target encod-
ing led to consistently improved results in supervised
machine learning with high cardinality features com-
pared to other state of the art encoding techniques, in
this study regularised target encoding is the method
of choice. This type of encoding can be interpreted
as a generalised linear mixed model (Micci-Barreca,
2001; Kuhn and Johnson, 2019), where a linear target
predictor for each feature value is combined with a
random effects. To prevent overfitting to the training
data, this encoding method is combined with 5-fold
stratified cross-validation (CV), where each left out
fold in the training set
X
tr
is encoded based on the
target encoding fit result for the remaining folds, re-
sulting in five training mappings. The test sets are also
divided into 5 stratified folds and then mapped to the
training mappings. A scheme on how the data was
split into training and test sets and then encoded using
this procedure, is shown in Figure 1. To implement
regularised target encoding, we use a generalised lin-
ear mixed model (glmm) encoder, where infrequent
values create outcomes near the grand mean, result-
ing in reduced sensitivity to outliers. An exception
for this method is the encoding of materials, which
are one-hot encoded to reflect different combinations
of materials for one product. Few experiments were
performed where categorical columns were encoded
with no cross-validation generalised linear mixed mod-
els. However, we found the models to be very prone
to overfitting and proceeded with 5-fold CV glmm-
encoding, which is in accordance with Pargent et al.
(2022). Most of orders were placed by unique cus-
tomers who did not order more than once in the ob-
served time scope, but to represent different personas
of return behavior, customer IDs were encoded using
target encoding with a smoothing parameter of
α = 20
,
resulting in 8 different numerical values. New cus-
tomer IDs in the test sets were encoded as the grand
mean.
Figure 1: Scheme for the preparation of training and test
sets from the original dataset, followed by 5-fold regularised
target encoding of the training set
X
tr
, and subsequent ap-
plication of the resultant encoding onto the respective test
folds.
Hyperparameter Tuning and Model Training:
5 different Models were used for training, including K
Nearest Neighbours (KNN), Gaussian Naive Bayes
(NB), Support Vector Machines (SVM), Bagged
Decision Trees (BDT) and XGBoost (XGB), a
regularising gradient boosting algorithm based on
Decision Trees. The following paragraphs show the
reasoning behind choosing this set of algorithms,
including their possible advantages and limitations.
KNN is a supervised learning algorithm that
predicts the target class based on a class vote of
its adjacent neighbors. Due to its straight forward
approach it is easy to interpret and local patterns in
feature space can be captured, which might suitable
for the imposed prediction problem. However, one
major drawback is its lack of efficiency as a lazy
algorithm. Another aspect to keep in mind is its
proneness to bias in the case of class imbalance due to
the existence of more neighbours with the majority
class (Murphy, 2018).
Gaussian Naive Bayes is a probabilistic algorithm
that assumes conditional independence of features.
The numerical features are assumed to have a normal
distribution. This algorithm is known for its simplicity
and computational efficiency. It might be a suitable
fit for a probabilistic setting such as estimating the
return probability of items and also in situations
where the data is limited, such as for newly introduced
products. However, if the conditional independence of
ICAART 2024 - 16th International Conference on Agents and Artificial Intelligence
160

features is not fulfilled because of strong correlations,
it may not deliver adequate performance (Bishop and
Nasrabadi, 2006).
Support Vector Machines are a supervised learning
method used to define a hyperplane that separates
the two target classes. This separation is determined
by support vectors, which are crucial instances in
the dataset that influence the positioning of the
hyperplane. The primary objective is to maximize
the margin between the hyperplane and the instances
of each class. The use of a nonlinear kernel allows
for the creation of nonlinear SVMs, which can be an
advantage, but makes the outcome very sensitive to
the chosen kernel function. Due to the maximisation
of the margins, the models can become fairly robust to
outliers, and high dimensional data can be handled
effectively. However, model complexity increases
exponentially with the amount of training examples,
which can be a major drawback (Murphy, 2018).
Bootstrap Aggregating (Bagging) Decision Trees
emerge as a suitable option for predicting garment
returns in data characterized by high cardinality
categorical features, owing to the discriminative nature
of split criteria employed during the construction of
the Decision Tree. Combining this advantage with
bagging enhances performance, can improve model
stability and reduces the risk of overfitting, if the base
classifiers are not too complex. Drawbacks can be
the lack of interpretability of the prediction results
due to the nature of ensembles and bias regarding the
training set (Murphy, 2018).
Lastly, XGBoost (Extreme Gradient Boosting) is
also an ensemble learning method based on decision
trees, which is widely used in state-of-the-art literature
and machine learning challenges, and known for its
scalability (Chen and Guestrin, 2016). It has been
applied successfully to a wide range of applications,
such as store sales prediciton and customer behavior
prediction (Chen and Guestrin, 2016), which indicates
that it can be a suitable solution for garment returns
prediction in this specific setting. The ability to
get feature importances for this method can also be
beneficial. A possible limitation is the proneness to
overfitting due to the sensitivity of boosting methods
to outliers.
Hyperparameters were tuned using 4 to 7-fold
CV on the training set, testing combinations using
a randomised grid. As the imbalanced distribution
of target values can lead to a bias towards the
positive class, random oversampling (labeled
O = 1
in Figure 2) of the minority class and random
undersampling (labeled
U = 1
in Figure 2) were used
as experiment settings besides keeping the training
sample as is, which contained
33, 777
instances. For
most models, random oversampling was the method
of choice, except for SVMs, where exponentially
increasing model complexity with the number of
instances gave rise to selecting random undersampling.
For testing the results, three test sets were created,
as shown in Figure 1. First, all instances related to
10 random products were removed from the original
dataset by their Article ID to form a test set
X
te,product
,
which consisted of
2, 851
instances, with the aim
to mimic the introduction of a new product line.
Second, from the remainder of the data, the last
15%
were used as a second test set
X
te,future
, consisting of
6, 000
instances, testing the scenario of new incoming
orders. Last, after removing these instances from the
dataset,
5%
were sampled randomly to form a third
test set
X
te,rand
with
1, 700
instances. For some of
the models, a random
10%−
portion of
X
te,rand
was
used for hyperparameter optimisation, using only
the remaining instances of
X
te,rand
as a test set. This
setting is labeled R = 1 in Figure 2.
Performance Evaluation: In order to fully as-
sess the performance of the tested models on the three
test scenarios, the balanced accuracy (BA) was chosen
as the most suitable indicator of model performance,
due to the imbalanced class ratio of roughly
70
to
30
.
To give true positives and true negatives equal weight
for the evaluation, the balanced accuracy is given by
the average of the true positive rate (TPR) and true
negative rate (TNR), also referred to as sensitivity or
recall, and specificity:
BA =
T PR + T NR
2
(1)
To gain the full picture of how many of the returns
could be predicted as such, we also investigate the re-
call or TPR. Further, an estimation of how many false
positives go along with the correct prediction of the
positive class is given by the precision, which is the
ratio of true positives and all test instances classified
as positive. The Area under the ROC-Curve (AUC)
is shown as an additional metric, indicating the rela-
tionship of true positives and false positives for varied
return probability thresholds, which can help assess
the suitability of the models to be used as an output
for return probability estimates.
5 DISCUSSION OF RESULTS
The results are summarised in Figure 2 and show the
four performance metrics used to evaluate the models
across the three test sets for randomly selected data,
Garment Returns Prediction for AI-Based Processing and Waste Reduction in E-Commerce
161
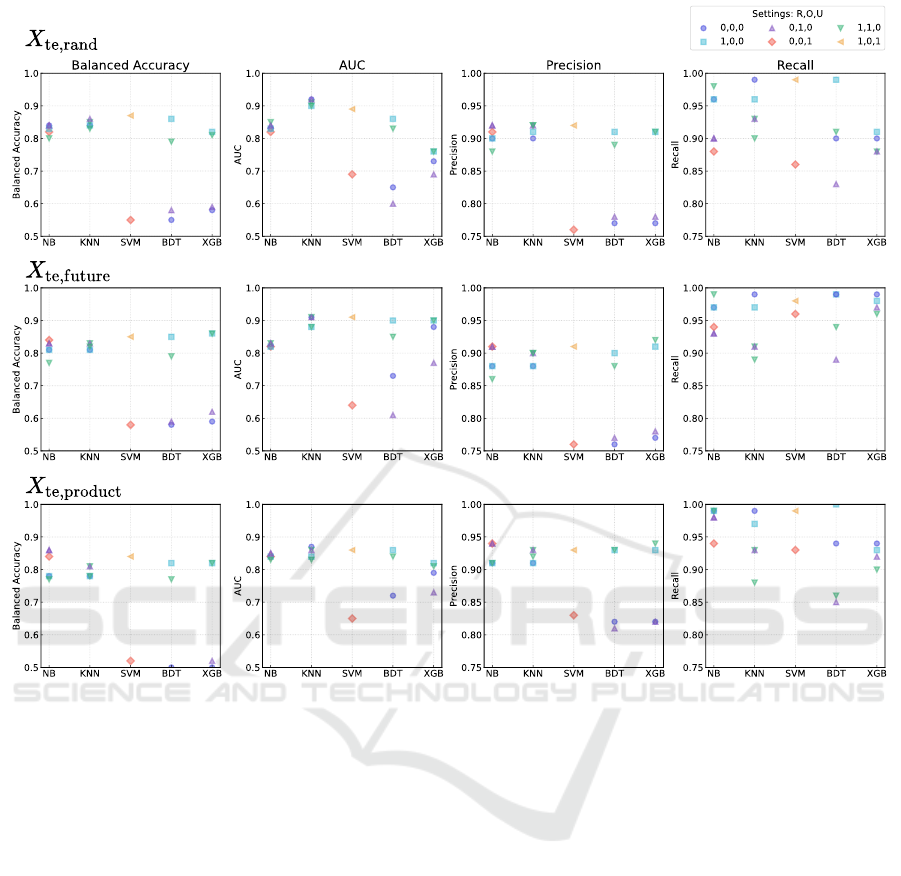
Figure 2: Performance scores for the trained models on the three test sets
X
te,rand
,
X
te,future
and
X
te,product
. Different marker
shapes indicate varied experiment settings, namely if hyperparameters were optimised on a portion of
X
te,rand
and testing on
the remainder (labeled R=1, else labeled R=0 if CV on
X
tr
was used instead), or if random oversampling (O=1) or random
undersampling (U=1) was used to counter class imbalance.
future order data and new product data. The influences
of the settings
R, O
and
U
will be discussed in the
following.
The Role of Optimisation Sets (
R = 1
or
R = 0
): One observation is that for SVMs, bagged
Decision Trees and XGBoost solely optimising on the
training set led to the worst performances across all
metrics and test sets, indicating that hyperparameter
optimisation on the training data might not be optimal
for these algorithms, whereas for KNN and Naive
Bayes no significant difference between optimising
on a portion of
X
te,rand
and optimising on the training
set can be found across the metrics and test sets,
except for improved precision and balanced accuracy
at the cost of a lower recall rate for the NB models.
For SVM, BDT and XGB the performances line up
next to NB and KNN, if
10%
of
X
te,rand
are used
for optimisation, the biggest overall improvement
can be seen for SVMs, where the balanced accuracy
changed from below
0.6
to
0.84
up to
0.87
across the
test sets, which can be explained by the significant
improvement in precision of up to 0.15.
The Role of Random Over- and Undersampling
(
O = 1
,
O = 0
and
U = 1
,
U = 0
): In contrast
to what one might expect for the imbalanced data
used in this work, no significant improvement on
the performances, especially on balanced accuracy
can be found when using random oversampling of
the minority class or random undersampling of the
majority class. Only for NB the over- or undersampled
versions with
R = 0
seem favorable for an improved
balanced accuracy, which might be explained by
the fact that Naive Bayes has a generally high bias,
so this can be counteracted by random over- or
undersampling. For the other models, choosing
O = 0
ICAART 2024 - 16th International Conference on Agents and Artificial Intelligence
162

and
U = 0
seems favorable, as the balanced accuracies
rank among the best with simultaneously high recall
rates.
Performances for Different Test Sets: The over-
all similar performances across all three test sets indi-
cate that there is not too much variance across test sets.
We can also infer from this that future orders on this
dataset can be classified correctly with a high likeli-
hood by observing historical data over the time scope
of six months. The importance of data on the historical
return behavior of customers is in accordance with find-
ings by Asdecker et al. (2017). Also, the introduction
of new products with possibly very different properties
like style, fit and colour, that have not been part of the
training set rank only slightly lower in balanced accu-
racy. A larger difference can be seen in AUC, where
the
0.9
mark is not surpassed for
X
te,product
. This in-
dicates that for new products, the models’ abilities to
make trade-offs between the sensitivity and specificity
is not as effective. However, when comparing the over-
all best-ranking models (i.e. ignoring SVM BDT and
XGB for
R = 0
), a slightly improved precision can
be reached compared to
X
te,future
and
X
te,rand
. Never-
theless, slight changes might manifest differently on
different test sets and other validation sets, when other
random products are chosen or future orders from other
times are selected. Another important point when in-
terpreting the performance on
X
te,product
is to keep in
mind that customer behavior played a significant role
in correctly classifying these instances, but upon the
introduction of a new product line one might not yet
have exact order information. It is also desirable to be
able to make predictions before new products are even
manufactured to get a first estimate on the return rate
to be expected.
6 CONCLUSION AND OUTLOOK
This work explores the application of five classical
Machine Learning algorithms for the prediction of e-
commerce returns using up-to-date data from a manu-
facturer of festive garments. Categorical features with
high cardinality were encoded using regularised target
encoding using 5-fold CV generalised target encoding
(Pargent et al., 2022), which is a novel approach in the
context of returns prediction. Three settings for hyper-
parameter optimisation and model training were ex-
plored. The results indicate that for tree-based models
and SVMs, it is favorable to optimise hyperparameters
with an additional set that is not the originally target
encoded training set, but that has been encoded using
the mapping obtained by the training set. When taking
this into account, SVMs are among the best performers
for the given data. Naive Bayes and K Nearest Neigh-
bours have shown to be very robust to the different
training settings. Balanced accuracies reach a max-
imum of
0.86
for
X
te,future
,
0.87
for
X
te,rand
and
0.86
for
X
te,product
. With newly added features based on the
historical customer behavior and potential bracketing
behavior, a high recall rate of up to
0.99
can be reached
across test sets. This implies that precise prediction
can become a challenge when the available amount
of historical data on customer behavior is limited or
if the majority of customers are first-time customers.
In this study, a balanced accuracy of
0.61
could not
be exceeded without utilising historical customer data.
For this situation, it can be a reasonable approach to
apply clustering methods in order to be able to clas-
sify the return behavior of new customers based on
similarities with existing customers. Adding historical
return rates for different Article IDs and other cate-
gories should also be investigated. This result should
be seen in the context of the clothing category, namely
festive dresses and garments. Therefore, further explo-
ration with data from retailers which include a variety
of other, non-festive clothing categories is indispens-
able. Additional research is needed to explore the
potential of predicting return rates for products that
have not yet been manufactured, which can make an
enormous contribution towards waste reduction and
CO
2
reduction in the fashion industry. Return predic-
tions lay the foundation for future research focusing on
the most sustainable processing of returned garments
and optimisation of reverse logistics processes based
on return probabilities on order and item level. We
recommend the investigation of return reasons as key
information for return processing and research on as-
signing most probable return reasons to orders with
large return probability. The problem of high return
rates is of large relevance from an economic but also
from an environmental perspective, but there is great
potential for improvement by employing AI and ML
applications. This research provides the basis to work
towards an AI-Based recommendation system that can
be integrated in to a system used to manage orders and
returns (e.g. Enterprice Resource Planning (ERP) or
Product Data Management (PDM) systems), where
return probabilities on order and item level shall give
the necessary insights to provide recommendations for
fast and sustainable processing of returns.
Garment Returns Prediction for AI-Based Processing and Waste Reduction in E-Commerce
163

ACKNOWLEDGEMENTS
This research was funded in part by the Ger-
man Federal Ministry of Education and Research
(BMBF) under the project OptiRetouren (grant num-
ber 01IS22046B). It is a joint project of the August-
Wilhelm Scheer Institut, INTEX, HAIX and h+p.
August-Wilhelm Scheer Institut is mainly entrusted
with conducting research in AI for forecasting returns
volume and for recommendations based on AI.
REFERENCES
Asdecker, B. and Karl, D. (2018). Big data analytics in
returns management-are complex techniques necessary
to forecast consumer returns properly? In 2nd Interna-
tional Conference on Advanced Research Methods and
Analytics. Proceedings, pages 39–46.
Asdecker, B., Karl, D., and Sucky, E. (2017). Examining
drivers of consumer returns in e-tailing with real shop
data. In Hawaii International Conference on System
Sciences, pages 4192–4201.
Bimschleger, C., Patel, K., and Leddy, M. (2019). Bringing
it back: Retailers need a synchronized reverse logistics
strategy. Technical report, Deloitte Development LLC.
Bishop, C. M. and Nasrabadi, N. M. (2006). Pattern recog-
nition and machine learning, volume 4. Springer.
Chen, T. and Guestrin, C. (2016). Xgboost: A scalable
tree boosting system. In Proceedings of the 22nd acm
sigkdd international conference on knowledge discov-
ery and data mining, pages 785–794.
Cui, H., Rajagopalan, S., and Ward, A. R. (2020). Pre-
dicting product return volume using machine learning
methods. European Journal of Operational Research,
281(3):612–627.
Deges, F. (2021). Retourencontrolling im online-handel.
Controlling – Zeitschrift f
¨
ur erfolgsorientierte Un-
ternehmenssteuerung, 2/2021:61–68.
Forschungsgruppe Retourenmanagement (2022).
Ergebnisse des europ
¨
aischen retourentachos
ver
¨
offentlicht. https://www.retourenforschung.de/info-
ergebnisse-des-europaeischen-retourentachos-
veroeffentlicht.html. Online; accessed 2023-01-26.
Gry., S., Niederlaender., M., Lodi., A., Mutz., M., and
Werth., D. (2023). Advances in ai-based garment
returns prediction and processing: A conceptual ap-
proach for an ai-based recommender system. In
Proceedings of the 20th International Conference on
Smart Business Technologies - ICSBT, pages 15–25.
INSTICC, SciTePress.
Heckman, J. J. (1979). Sample selection bias as a specifica-
tion error. Econometrica: Journal of the econometric
society, pages 153–161.
Kuhn, M. and Johnson, K. (2019). Feature engineering and
selection: A practical approach for predictive models.
n taylor & francis group.
Lepthien, A. and Clement, M. (2019). Shipping fee sched-
ules and return behavior. Marketing Letters, 30(2):151–
165.
Makkonen, M., Frank, L., and Kemppainen, T. (2021).
The effects of consumer demographics and payment
method preference on product return frequency and rea-
sons in online shopping. In Bled eConference, pages
567–580. University of Maribor.
Micci-Barreca, D. (2001). A preprocessing scheme for
high-cardinality categorical attributes in classification
and prediction problems. ACM SIGKDD Explorations
Newsletter, 3(1):27–32.
Murphy, K. P. (2018). Machine learning: A probabilistic per-
spective (adaptive computation and machine learning
series). The MIT Press: London, UK.
Pargent, F., Pfisterer, F., Thomas, J., and Bischl, B. (2022).
Regularized target encoding outperforms traditional
methods in supervised machine learning with high car-
dinality features. Computational Statistics, 37(5):2671–
2692.
Sahoo, N., Dellarocas, C., and Srinivasan, S. (2018). The
impact of online product reviews on product returns.
Information Systems Research, 29(3):723–738.
Shehu, E., Papies, D., and Neslin, S. A. (2020). Free shipping
promotions and product returns. Journal of Marketing
Research, 57(4):640–658.
Statista (2023). Fashion ecommerce report
2023. https://www.statista.com/study/38340/
ecommerce-report-fashion/. Online; accessed
2023-08-09.
T
¨
uyl
¨
u, A. N. A. and Ero
˘
glu, E. (2019). Using machine learn-
ing algorithms for forecasting rate of return product
in reverse logistics process. Alphanumeric Journal,
7(1):143–156.
Urbanke, P., Kranz, J., and Kolbe, L. M. (2015). Predict-
ing product returns in e-commerce: The contribution
of mahalanobis feature extraction. In International
Conference on Interaction Sciences, pages 1–19.
Van Heerde, H. J., Gijsbrechts, E., and Pauwels, K. (2005).
Price war: what is it good for? store incidence and
basket size response to the price war in dutch grocery
retailing. Tilburg University, LE Tilburg, The Nether-
lands.
Vogue/BCG (2021). Consumers’ adaption to sus-
tainability in fashion. https://web-assets.bcg.
com/27/f3/794284e7437d99a71d625caf589f/
consumers-adaptation-to-sustainability-in-fashion.
pdf. Online; accessed 2023-08-09.
Yan, R. and Cao, Z. (2017). Product returns, asymmetric
information, and firm performance. International Jour-
nal of Production Economics, 185:211–222.
ICAART 2024 - 16th International Conference on Agents and Artificial Intelligence
164
