
A Methodology Based on Subgroup Discovery to Generate Reduced
Subgroup Sets for Patient Phenotyping
Antonio Lopez-Martinez-Carrasco
1 a
, Jose M. Juarez
1 b
, Manuel Campos
1,2 c
and Bernardo Canovas-Segura
1 d
1
Med AI Lab, University of Murcia, Spain
2
Murcian Bio-Health Institute (IMIB-Arrixaca), Spain
Keywords:
Methodology, Patient Phenotyping, Subgroup Discovery, Reduced Subgroup Set.
Abstract:
Subgroup Discovery (SD) is a supervised machine learning technique that mines a set of easily readable
features of patients with a medical condition in the form of a subgroup set (called patient phenotype). However,
using only the output obtained by a single execution of an SD algorithm hinders the discovery of the best
phenotypes since it is difficult for clinicians to choose the most suitable algorithm, its best hyperparameters
and the quality measure. Therefore, we propose a new phenotyping approach based on SD that evaluates
the outcomes of different SD algorithms to obtain a final patient phenotype with a reduced dependency on
the initial conditions of these executions and to ensure diversity in terms of coverage of the subgroups from
this phenotype. For that, we first define the problem of mining a patient phenotype in the form of a reduced
subgroup set and, after that, we propose a new 6-step methodology to tackle this problem. Moreover, we carry
out experiments driven by this methodology and focused on the antibiotic resistance problem by using the
MIMIC-III public database and the patients infected by an Enteroccous Sp. bacterium resistant to Vancomycin
as a target. Finally, we obtain a phenotype formed of 7 subgroups.
1 INTRODUCTION
Finding a set of observable features of patients with a
medical condition has become a core issue in the clin-
ical research field. This task is denominated as patient
phenotyping and these patient features are denomi-
nated as patient phenotypes (Wojczynski and Tiwari,
2008). Patient phenotyping is useful for discover-
ing novel and possibly unexpected relations between
patient attributes, generating clinical hypotheses, or
supporting medical experts decision-making, among
others. Therefore, the development of new machine
learning (ML) methods to find patient phenotypes is a
key area in the health informatics research field.
A relevant application of the patient phenotyping
is the antibiotic resistance problem, which, according
to main healthcare organizations, is one of the grow-
ing and most alarming problems in the clinical field.
This problem takes place when microorganisms be-
a
https://orcid.org/0000-0002-2990-886X
b
https://orcid.org/0000-0003-1776-1992
c
https://orcid.org/0000-0002-5233-3769
d
https://orcid.org/0000-0002-0777-0441
come resistant to antimicrobials, causing antimicro-
bials to lose their effectiveness in combating microor-
ganism infections. In this context, ML-guided patient
phenotyping can be applied to automatically discover
patient phenotypes related to the antibiotic resistance
problem.
Subgroup Discovery (SD) (Atzmueller, 2015) is
a suitable approach by which to tackle patient phe-
notyping. SD is a supervised machine learning tech-
nique whose main objective is to extract a simple and
legible set of relations among attributes from a dataset
regarding a target attribute of interest. These indi-
vidual relations are denominated as subgroups. This
technique is used to model a subgroup set for de-
scriptive and exploratory data analysis, generating hy-
potheses, or extracting patterns, among others. An es-
sential aspect of this technique is to compute the qual-
ity of the individual subgroups obtained. For that, a
quality measure is used, which is a function that as-
signs a numerical value to a subgroup according to
different properties from the dataset.
Although the SD technique is useful and gener-
ates easily readable phenotypes in the form of sub-
group sets, using only the output obtained by a sin-
346
Lopez-Martinez-Carrasco, A., Juarez, J., Campos, M. and Canovas-Segura, B.
A Methodology Based on Subgroup Discovery to Generate Reduced Subgroup Sets for Patient Phenotyping.
DOI: 10.5220/0012321200003657
Paper published under CC license (CC BY-NC-ND 4.0)
In Proceedings of the 17th International Joint Conference on Biomedical Engineering Systems and Technologies (BIOSTEC 2024) - Volume 2, pages 346-353
ISBN: 978-989-758-688-0; ISSN: 2184-4305
Proceedings Copyright © 2024 by SCITEPRESS – Science and Technology Publications, Lda.

gle execution of a specific SD algorithm could involve
certain disadvantages. One of them concerns the SD
algorithm itself and its initial hyperparameters. In
this sense, an SD algorithm could implement either
an exhaustive or heuristic exploration strategy, return
either all subgroups explored or the top-k subgroups
explored, implement different pruning, and accept the
use of different quality measures. Besides, different
implementations of the same algorithm could incor-
porate other hyperparameters further than the origi-
nally defined ones (e.g., exploration depth). All the
aforementioned characteristics make the subgroup set
obtained by an SD algorithm highly variable and de-
pendent on the initial conditions of the algorithm, thus
causing the subgroups mined by different SD algo-
rithms or by different hyperparameters can be notably
different. Another disadvantage is the large number of
subgroups that could be mined by a certain SD algo-
rithm execution (pattern explosion problem), increas-
ing the subgroup set size and making the result hardly
readable and interpretable by experts in these cases.
Taking all this into account, we propose and de-
velop a new approach based on the evaluation of the
overlap between the subgroup sets mined by differ-
ent SD algorithm executions to obtain a reduced sub-
group set. More precisely, the main contributions of
this research are (1) the definition of the problem of
mining a patient phenotype in the form of a reduced
subgroup set and (2) a new 6-step methodology that
tackles this problem and allows the involvement of
clinical experts in the process. The idea behind this
methodology supported by the SD technique is based
on a previously developed work (Lopez-Martinez-
Carrasco et al., 2021), which consisted of finding pa-
tient cohorts by evaluating the overlap between differ-
ent executions of a certain clustering algorithm.
The experiments carried out in this research are
driven by the 6-step methodology proposed and the
results obtained are compared with another descrip-
tive SD method.
2 PROBLEM STATEMENT
This section provides the formal definitions related to
the problem of mining a patient phenotype in the form
of a reduced subgroup set.
An attribute a is a unique characteristic of an ob-
ject, which has an associated value. An example of
an attribute is a = headache : yes. Moreover, the
domain of a, denoted as dom(a), is the set of all
unique values that a can take. Note that an attribute
can be nominal or numeric depending on its domain.
An instance i is a tuple of attributes of the form
i = (a
1
, . . . , a
m
). Given the attributes a
1
= f ever :
no and a
2
= headache : yes, an example of an in-
stance is i = ( f ever : no, headache : yes). A dataset
d is a tuple of instances of the form d = (i
1
, . . . , i
n
).
Given the instances i
1
= (headache : yes, f ever :
no) and i
2
= (headache : yes, f ever : yes), an ex-
ample of a dataset is d = ((headache : yes, f ever :
no), (headache : yes, f ever : yes)). Moreover, the no-
tation v
x,y
is used to indicate the value of the x-th in-
stance i
x
and its y-th attribute a
y
from a dataset d.
Given an attribute a
y
from a dataset d, a bi-
nary operator ∈ {=, ̸=, <, >, ≤, ≥} and a value w ∈
dom(a
y
), then a selector e is defined as a 3-tuple of the
form (a
y
.characteristic, operator,w). Informally, a
selector is a binary relation between an attribute from
a dataset and a possible value of its domain. An ex-
ample of a selector is e = (headache, =, yes).
Given an instance i and a selector e, then i is cov-
ered by e if the binary expression “v
x,y
operator w”
holds true. Otherwise, i is not covered by e.
Given a dataset d, a pattern p is a list of selectors
of the form < e
1
, . . . , e
j
> in which all attributes of the
selectors are different. It is interpreted as a conjunc-
tion of selectors that represents a list of properties of a
subset from d. Additionally, the pattern size is defined
as the number of selectors that it contains.
Given an instance i and a pattern p, then i is cov-
ered by p if i is covered by all selectors e ∈ p. Other-
wise, i is not covered by p.
Given a pattern p and a selector e, a subgroup
s is a pair (p, e) in which the pattern is denomi-
nated as ‘description’ and the selector is denomi-
nated as ‘target’. Additionally, the subgroup size is
defined as the number of selectors that its descrip-
tion contains. An example of subgroup is s = (<
(headache, =, yes), ( f ever, =, no) >, ( f lu, =, no)).
Given two subgroups s and s
′
, s
′
is a refinement
of s (denoted as s ≺ s
′
) if s
′
has the same target as s,
i.e., s
′
.target = s.target, and has an extended descrip-
tion, i.e., s
′
.description = concat(s.description, <
e
1
, . . . , e
j
>).
Given a subgroup s and a dataset d, a quality mea-
sure q is a function that computes one numeric value
according to s and certain metrics from d (Atzmueller,
2015).
Focusing on a specific subgroup s and a specific
dataset d, different metrics with which to compute
quality measures can be defined: (1) true positives
(t p), defined as the number of instances i from the
dataset d that are covered by the subgroup descrip-
tion s.description and by the subgroup target s.target;
(2) false positives ( f p), defined as the number of in-
stances i from d that are covered by s.description, but
not by s.target; (3) true population (T P), defined as
A Methodology Based on Subgroup Discovery to Generate Reduced Subgroup Sets for Patient Phenotyping
347

subgroup
1
: IF description
1
THEN distribution
1
(target)
subgroup
2
: IF description
2
THEN distribution
2
(target)
.
.
.
subgroup
k
: IF description
k
THEN distribution
k
(target)
Figure 1: Example of a subgroup set with k subgroups in the form of a decision set.
the number of instances i from d that are covered by
s.target, and (4) false population (FP), defined as the
number of instances i from d that are not covered by
s.target.
Some examples of quality measures are Piatet-
sky Shapiro (PS = (t p + f p) · (
t p
t p+ f p
−
T P
T P+FP
)),
Weighted Relative Accuracy (W RAcc =
t p+ f p
T P+FP
·
(
t p
t p+ f p
−
T P
T P+FP
)) or Incremental Response Rate
(IRR =
t p
t p+ f p
− 1 +
FP− f p
FP
).
A subgroup set ss is an unordered collection of
subgroups of the form ss = {s
1
, s
2
, . . . , s
k
}. It can be
interpreted as a decision set of the form “if”, meaning
that all subgroups from the set apply independently
from the rest (Lakkaraju et al., 2016). An example is
depicted in Figure 1.
The SD problem consists of exploring the search
space of a dataset d to mine a subgroup set ss in which
the quality value, computed with a quality measure
q, for each individual subgroup s ∈ ss is greater or
equal to a given threshold. Some examples of SD al-
gorithms are SD-Map (Atzmueller and Puppe, 2006),
VLSD (Lopez-Martinez-Carrasco et al., 2023a) or
BSD (Lemmerich et al., 2010), among others.
Two different subgroups generated by any SD al-
gorithm are redundant when both cover the same por-
tion of instances from a specific dataset. In this con-
text and according to their coverage, one of them is
called the dominant subgroup and the other is called
the dominated subgroup, allowing the latter to be
deleted. Therefore, two types of dominance rela-
tions can be stated: (1) close (Garriga et al., 2006),
and (2) closed-on-the-positives (Lemmerich et al.,
2010). Considering both dominance relations, other
examples of SD algorithms are CBSD (BSD with the
close dominance relation) and CPBSD (BSD with the
closed-on-the-positives dominance relation).
Given a collection of subgroup sets
{ss
1
, ss
2
, . . . , ss
n
}, the overlap function o f is a
function that evaluates the overlap between these
subgroup sets by computing their intersections
and returns another subgroup set. Formally:
o f ({ss
1
, ss
2
, . . . , ss
n
}) =
T
n
i=1
ss
i
.
Finally, the subgroup set returned by an overlap
function o f is denominated as a reduced subgroup set
and is denoted as rss. In this context, we use a reduced
subgroup set rss to represent a phenotype.
3 METHODOLOGY
This section describes the proposed 6-step methodol-
ogy with which to tackle the problem defined in Sec-
tion 2, allowing the involvement of clinical experts in
the process. This methodology is shown in Figure 2
and consists of the following steps:
Step 1 consists of extracting the data from the
clinical source(s) to later preprocess it. This prepro-
cessing comprises different tasks such as data clean-
ing or data transformation, among others, which are
necessary to obtain the final dataset (denominates as
the mining view). Note that different SD algorithms
accept different data formats (e.g., only nominal at-
tributes, only numerical attributes, both nominal and
numerical attributes, etc.). Therefore, it is necessary
to ensure that the mining view has the correct format
according to the SD techniques that will be used in
the following steps. Step 1 also includes the selection
of the pair attribute-value that will be used as a target
in all SD algorithm executions.
Step 2 is formed of two phases: (1) splitting the
mining view as many times as different algorithms
and hyperparameters will be applied, and (2) for each
split, selecting the specific SD algorithm and its hy-
perparameters that will be applied over this split. In
this step, the greater the number of splits and different
algorithms and hyperparameters, the lower the depen-
dency between the algorithms, the hyperparameters
and the final subgroup set mined and, therefore, the
more reduced the final subgroup set will be. How-
ever, using an excessive number of splits, algorithms,
and hyperparameters may imply that the intermedi-
ate subgroup sets obtained do not overlap each other
and, therefore, that the rss is either of poor quality or
even empty. In Step 2, it is also possible to duplicate
a certain split to apply different algorithms and/or hy-
perparameters to the same data. Concerning this step,
remember that the target established in the first step
must be used in all the SD algorithm executions.
Step 3 consists of executing all SD algorithms
with their hyperparameters over the corresponding
splits to obtain the subgroup sets, one per algo-
rithm. These intermediate subgroup sets are denoted
as ss
1
, ss
2
, ss
3
, . . . , ss
n
. Note that these subgroup sets
are intermediate phenotypes that are highly dependent
on the specific SD algorithms and hyperparameters
HEALTHINF 2024 - 17th International Conference on Health Informatics
348
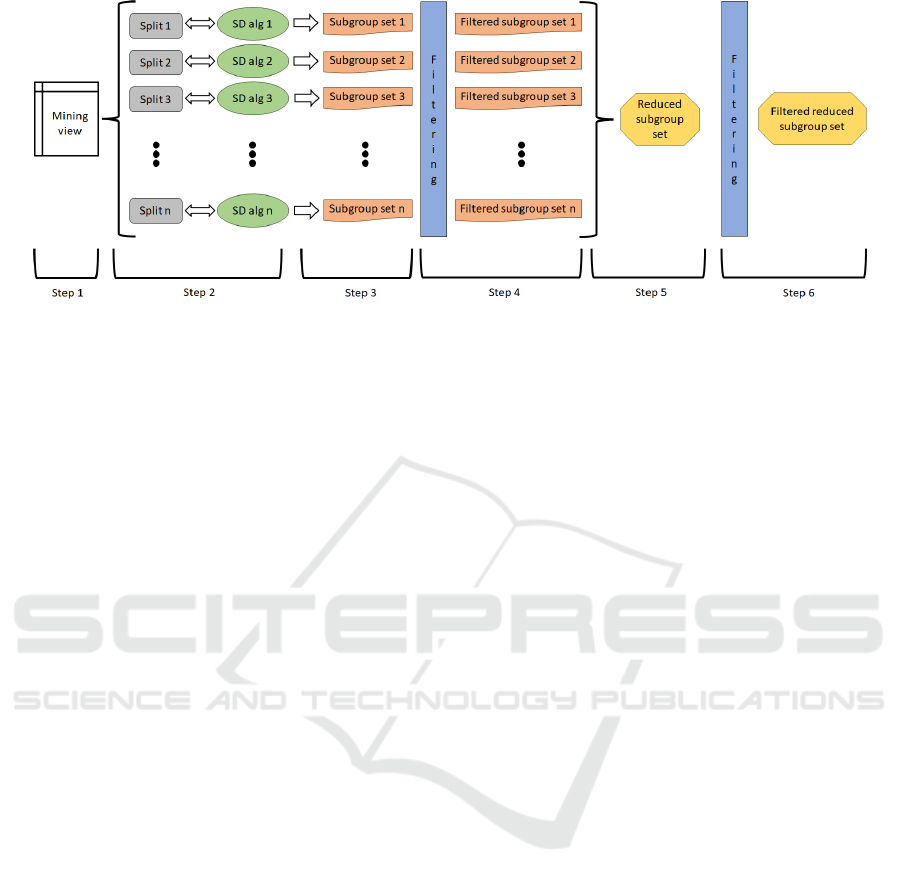
Figure 2: 6-Step methodology proposed.
used to generate them. Therefore, they will be com-
bined later to generate the rss, i.e., the final pheno-
type with a reduced dependency concerning each of
the multiple SD algorithms executed.
Step 4 consists of filtering each subgroup set gen-
erated by the SD algorithms in the previous step, ob-
taining a new collection of subgroup sets denoted as
f ss
1
, f ss
2
, f ss
3
, . . . , f ss
n
. The applied filters can be of
two types: (1) automatic filters, based on certain com-
putable criteria, for example, the quality measure of
the subgroups contained in the subgroup set or rules
designed by experts, among others, and (2) manual
filters, applied directly by experts and based on their
knowledge and experience.
Step 5 is based on the execution of the over-
lap function to combine all filtered subgroup sets
obtained previously to generate the rss. This
means that, given the collection of subgroup
sets { f ss
1
, f ss
2
, f ss
3
, . . . , f ss
n
}, then the function
o f ({ f ss
1
, f ss
2
, f ss
3
, . . . , f ss
n
}) is executed. Once the
rss is generated, it is also possible to reorder its sub-
groups by using another different quality measure.
Finally, Step 6 consists of filtering the rss from the
previous step to obtain the phenotype f rss. In both
Steps 4 and 6, either automatic or manual filters can
be applied and domain experts actively participate in
the confection of the phenotypes. These filtering pro-
cesses could be supported by visualization tools for
clinicians’ decision-making.
4 EXPERIMENTS AND RESULTS
The objective of the experiments carried out in this
work was to test our methodology regarding the de-
fined problem as well as its suitability to identify
patient phenotypes in the context of antibiotic resis-
tance. For that purpose, we used real clinical data
obtained from MIMIC-III, which is a public dataset
that contains health data related to more than 45,000
patients treated in ICUs (intensive care units) and
around 60,000 admissions between the years 2001
and 2012. This database contains data related to de-
mography, laboratory tests, vital sign measurements
or administered medications, among others. In addi-
tion, the experiments presented and described in this
section are driven by our 6-step methodology.
4.1 Step 1
First, we extracted data from the MIMIC-III public
database to compose a mining view in which each
instance was a strain of a population of a microor-
ganism obtained in a culture (laboratory test) of a
patient during one of their admissions. During this
process, we applied a preprocessing phase to delete
duplicate instances and attributes, delete empty at-
tributes or those with only one value, and discretize
numerical attributes since SD algorithms used only
accept this type of attributes. The mining view had
9,240 instances and 12 attributes, which are described
in Table 1. Finally, we used as a target the patients in-
fected by an Enteroccous Sp. bacterium resistant to
Vancomycin, i.e. Class = Yes, having therefore 2,126
positive instances and 7,114 negative instances.
4.2 Step 2
The next step was to split this mining view. In this
case, we generated 5 different stratified splits (with
no duplicates). For each split, we assigned the fol-
lowing algorithms and hyperparameters: for the split
1 (1,849 rows), the SD-Map algorithm with the Pi-
atetsky Shapiro quality measure and with no mini-
mum quality thresholds; for the split 2 (1,848 rows),
the VLSD algorithm with the WRAcc quality mea-
sure (defined between -1 and 1, both included) and a
minimum quality threshold of 0; for the split 3 (1,848
A Methodology Based on Subgroup Discovery to Generate Reduced Subgroup Sets for Patient Phenotyping
349
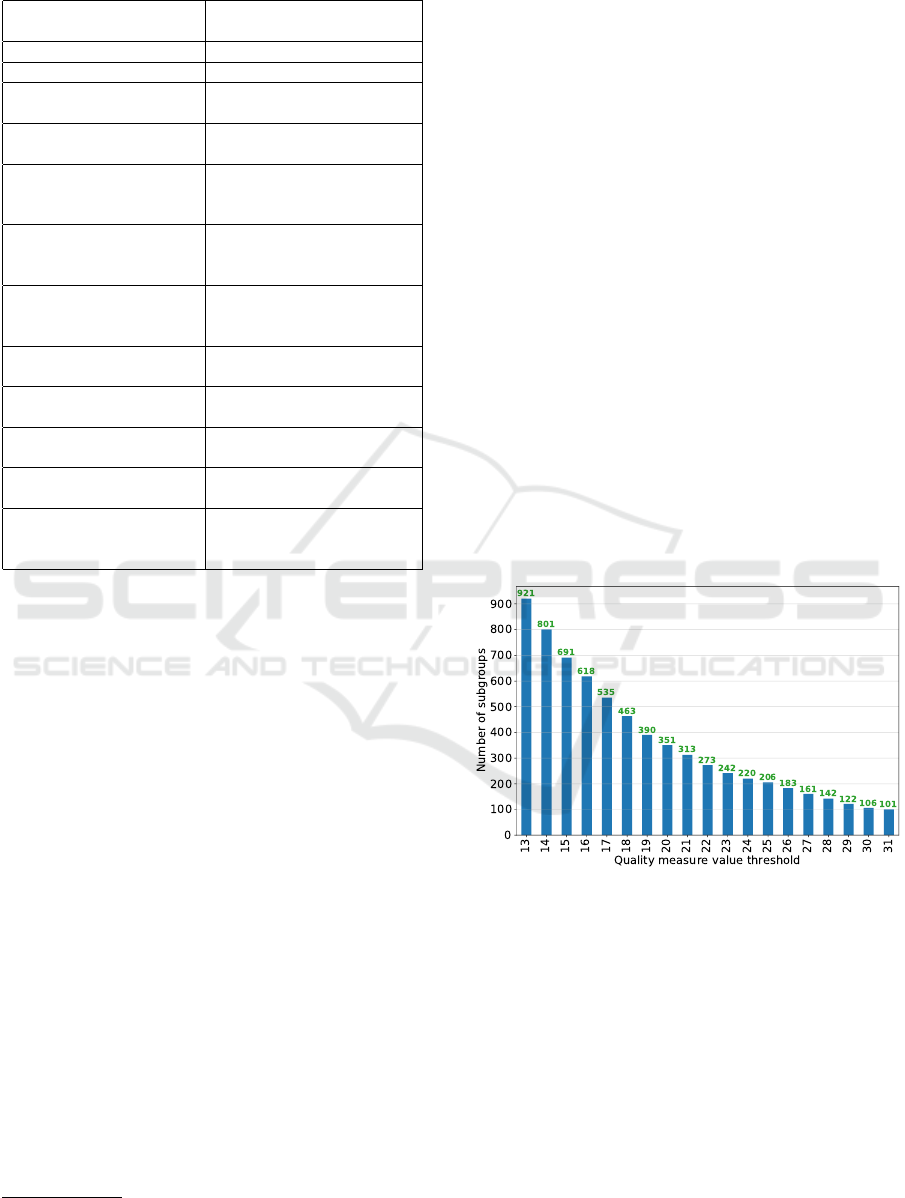
Table 1: Mining view details.
Attribute
name
Attribute
description
Patient gender Male or Female
Patient age Child, Adult or Elderly
Admission location
Patient’s location
before arriving
Dischage location
Patient’s location
after discharging
Culture
specimen type
Specimen which
was tested in the culture
for bacterial growth
Service when
culture
Service where the patient
resided when the culture
was done
ICU when
culture
ICU where the patient
resided when the culture
was done
Readmission
If the patient was in the
hospital in the past
Days between admission
and first ICU
Zero, or One or more
Previous Vancomycin
treatments
If the patient was treated
with vancomycon before
Culture month
Month when the culture
was done
Class
Enteroccous Sp. bacterium
resistant to Vancomycin
(Yes / No)
rows), the BSD algorithm with Piatetsky Shapiro
quality measure, with no minimum quality thresholds
and with a maximum of 1,000 subgroups (i.e., the best
1,000 subgroups); for the split 4 (1,848 rows), the
CBSD algorithm with WRAcc quality measure, with
no minimum quality thresholds and with a maximum
of 1,000 subgroups (i.e., the best 1,000 subgroups),
and for the split 5 (1,847 rows), the CPBSD algorithm
with Piatetsky Shapiro quality measure, with no mini-
mum quality thresholds and with a maximum of 1,000
subgroups (i.e., the best 1,000 subgroups). All these
algorithms and quality measures are implemented in
the subgroups python library, which is available on
PyPI or
1
.
4.3 Step 3
The next step was to actually run the algorithms.
After executing the SD-Map algorithm over split 1,
we obtained a subgroup set ss
1
with 1,315,110 sub-
groups. After running the VLSD algorithm over split
2, we generated a subgroup set ss
2
with 374,817 sub-
groups. After executing the BSD algorithm over split
3, we mined a subgroup set ss
3
with 1,000 subgroups.
After running the CBSD algorithm over split 4, we
obtained a subgroup set ss
4
with 1,000 subgroups. Fi-
1
https://github.com/antoniolopezmc/subgroups
nally, after executing the CPBSD algorithm over split
5, we mined a subgroup set ss
5
with 1,000 subgroups.
In this point, remember that we used different
algorithms with different quality measures and hy-
perparameters over different datasets (obtained after
splitting the initial mining view). The five subgroup
sets obtained are intermediate phenotypes that are
highly dependent on the five SD algorithms and hy-
perparameters used to generate them.
4.4 Step 4
After executing all the SD algorithms, we mined a to-
tal number of 1,692,927 subgroups, which would be
relatively high for direct human intervention in case
these were the final phenotypes to analyse. There-
fore, we applied an automatic filtering process based
on the quality measure of the subgroups from each
subgroup set obtained. For that, for each subgroup
set, we only selected those subgroups whose quality
measure value was greater than or equal to a certain
threshold. Figures 3, 4, 5, 6, and 7 shows the num-
ber of subgroups that we finally obtain in each SD
model when varying the quality measure threshold.
Note that these figures serve as visual support for the
clinical experts’ decision-making.
Figure 3: Step 4 - Subgroup set 1 (ss
1
).
For the subgroup set 1 (i.e., ss
1
), we established
a threshold value of 23, obtaining therefore a filtered
subgroup set f ss
1
with 242 subgroups. For the sub-
group set 2 (i.e., ss
2
), we set a threshold value of 0.02,
obtaining therefore a filtered subgroup set f ss
2
with
104 subgroups. For the subgroup set 3 (i.e., ss
3
), we
established a threshold value of 23, obtaining there-
fore a filtered subgroup set f ss
3
with 247 subgroups.
For the subgroup set 4 (i.e., ss
4
), we set a threshold
value of 0.01, obtaining therefore a filtered subgroup
set f ss
4
with 234 subgroups. Note that, in this case,
there is a higher concentration of subgroups at val-
ues close to 0. Finally, for the subgroup set 5 (i.e.,
HEALTHINF 2024 - 17th International Conference on Health Informatics
350
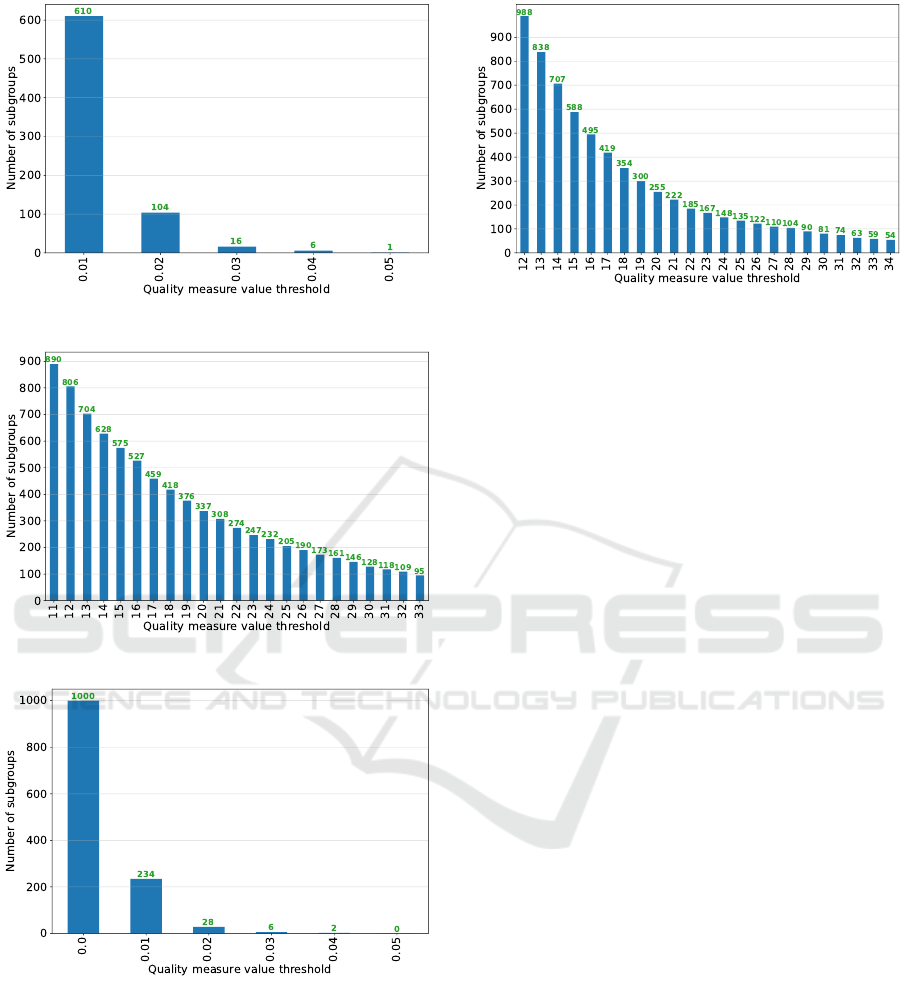
Figure 4: Step 4 - Subgroup set 2 (ss
2
).
Figure 5: Step 4 - Subgroup set 3 (ss
3
).
Figure 6: Step 4 - Subgroup set 4 (ss
4
).
ss
5
), we established a threshold value of 20, obtaining
therefore a filtered subgroup set f ss
5
with 255 sub-
groups.
After applying this filtering process, we had a to-
tal number of 1,082 subgroups, which would also be
relatively high for direct human intervention in case
these were the final phenotypes to analyse. For this
reason, these filtered phenotypes were combined in
Step 5.
Figure 7: Step 4 - Subgroup set 5 (ss
5
).
4.5 Step 5
This step consisted of applying the overlap function
in order to combine f ss
1
, f ss
2
, f ss
3
, f ss
4
and f ss
5
to
obtain rss. In these experiments, we used the over-
lap function o f defined in Section 2. Once apply-
ing the overlap function over all previous filtered sub-
group sets, i.e. o f ({ f ss
1
, f ss
2
, f ss
3
, f ss
4
, f ss
5
}), we
obtained a rss with 14 subgroups. After that, we re-
ordered the subgroups contained in the rss by using
the IRR quality measure, considering the mining view
completely.
4.6 Step 6
Finally, the last step of our methodology consisted of
filtering the rss to obtain the f rss, which was the fi-
nal phenotype generated by our methodology. In this
case, we applied an automatic filtering process based
on the deletion of subgroup refinements. For that pur-
pose, for each pair of distinct subgroups s
1
and s
2
from rss, we deleted the subgroup with lower qual-
ity if s
2
is a refinement of s
1
or s
1
is a refinement of
s
2
. An advantage of this filter is that it allows for a
reduction of the number of instances simultaneously
covered by different subgroups from f rss. After ap-
plying this filtering process, we finally obtained a f rss
with 7 subgroups, which are shown in Table 2.
At this point, it is necessary to remember that both
rss and f rss are two phenotypes with a reduced de-
pendency on the previous SD algorithms and hyper-
parameters used.
The obtained phenotype (Table 2) describes adult
male patients admitted to the surgical service (SURG)
and in the surgical ICU (SICU) who were readmitted
in the hospital and spent one day or more between
the hospital admission and the admission in the first
ICU, and in which the cultures were swab. Addition-
ally, the subgroup descriptions from f rss have either
two or three selectors. With respect to the phenotype
A Methodology Based on Subgroup Discovery to Generate Reduced Subgroup Sets for Patient Phenotyping
351
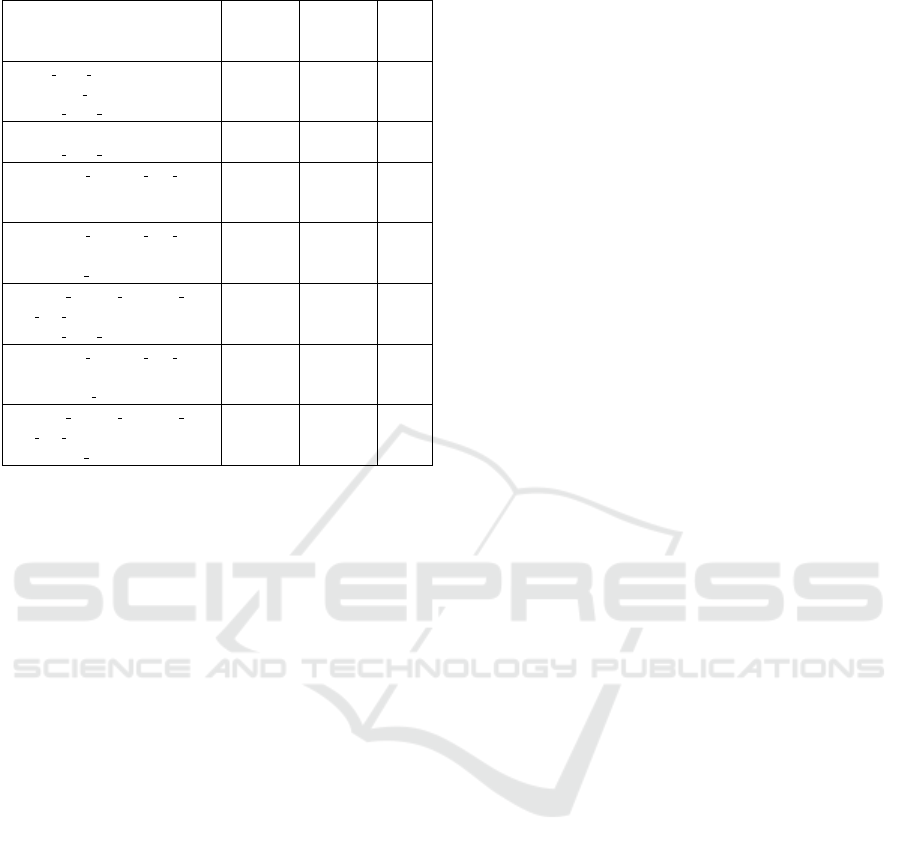
Table 2: Step 6 - Filtered reduced subgroup set f rss.
Subgroup
description
Positive
instances
(tp)
Negative
instances
(fp)
IRR
icu when culture = ’SICU’,
patient age = ’ADULT’,
service when culture = ’SURG’
250
(12%)
178
(3%)
0.559
readmission = ’yes’,
service when culture = ’SURG’
370
(17%)
384
(5%)
0.437
culture specimen type
description = ’SWAB’,
readmission = ’yes’
322
(15%)
372
(5%)
0.412
culture specimen type
description = ’SWAB’,
patient age = ’ADULT’
416
(20%)
481
(7%)
0.396
days between admission
and first ICU = ’OneDayOrMore’,
service when culture = ’SURG’
354
(17%)
460
(6%)
0.370
culture specimen type
description = ’SWAB’,
patient gender = ’M’
454
(21%)
600
(8%)
0.346
days between admission
and first ICU = ’OneDayOrMore’,
patient age = ’ADULT’
487
(23%)
673
(9%)
0.325
coverage, Table 2 also shows that the subgroups in-
dividually considered always cover less than 25% of
the positive instances and less than 10% of the nega-
tive instances.
4.7 Comparison of the Results
This section compares the f rss obtained by our
methodology with the model obtained by another
descriptive SD method in terms of coverage by
analysing the overlap between the dataset instances
covered by both models. More precisely, we fo-
cus on previous research (Lopez-Martinez-Carrasco
et al., 2023b) in which the DSLM algorithm along
with the mining view presented in Section 4.1 were
used to mine two patient phenotypes in the form of di-
verse top-2 subgroup lists. This comparison process
showed, according to the Dice coefficient, an over-
lap of 50% between f rss and the first subgroup list
and 62% between f rss and the second subgroup list.
This means that our methodology was able to mine
a patient phenotype in which, at least, half of the in-
stances were the same as the ones generated by a phe-
notyping SD method based on the Minimum Descrip-
tion Length (MDL) principle (Gr
¨
unwald, 2007) and a
compression gain metric.
5 DISCUSSION
In this section, we discuss our proposed 6-step
methodology and its application to the MIMIC-III
database in the context of patient phenotyping applied
to the antibiotic resistance problem.
With respect to Step 1, it is highly dependent on
the data that we have, the specific problem that we
are handling and the concrete clinical target to study.
In this work, we present a clinical database with real
data and, after a preprocessing, we obtain a mining
view with 9,240 instances and 12 attributes.
Concerning Step 2, there are two aspects to con-
sider. The first one is the number of splits, which de-
termines the quality of the final output of the method-
ology. If we have a lower number of splits, algorithms
and hyperparameters, then the rss will remain highly
dependent on those few splits, algorithms and hyper-
parameters used. However, if we have a higher num-
ber of splits, algorithms and hyperparameters, then
the reduced phenotype may be of poor quality since
there is no overlapping between the intermediate sub-
group sets. The second one is the quality measure
used in each SD algorithm. Each quality measure
is designed to focus on different dataset characteris-
tics and, therefore, obtain subgroups with these char-
acteristics (e.g., more general subgroups, more spe-
cific subgroups, etc.). For this reason, the utilization
of different quality measures allows us to mine a re-
duced phenotype containing subgroups that share all
these characteristics at the same time. Additionally,
this methodology offers the possibility of duplicating
the same split to apply different algorithms and/or hy-
perparameters to the same data. However, it is advis-
able not to abuse this duplication in certain cases since
we can produce that some instances and/or subgroups
have a greater weight than others.
Regarding Step 3, SD is a highly parallelisable
technique since, in general, all subgroups obtained by
a certain SD algorithm can be represented as a tree or
as a lattice. For this reason, each algorithm could be
executed in parallel to improve the methodology per-
formance. Focusing on the WRAcc quality measure,
it prioritises those subgroups that cover more positive
instances than negative ones. This means that all sub-
groups obtained with the mining view or the splits and
this quality measure had values close to 0 because the
number of negative instances is always higher than
the number of positive instances.
Concerning Step 4, this is a step in which the do-
main experts can participate. For this reason, different
visualization methods, apart from those used in this
work, can be defined and provided to help experts’
decision-making.
Regarding Step 5, this work defines and uses a
specific overlap function (see Section 2), although
other functions to obtain reduced subgroup sets could
be also explored and defined.
HEALTHINF 2024 - 17th International Conference on Health Informatics
352

With respect to Step 6, it is especially useful in
case the rss has such a large number of subgroups that
it is hardly readable and interpretable by experts. In
this work, we applied a filter based on the deletion of
subgroup refinements, obtaining therefore a f rss with
7 subgroups in which the shared instances between
different subgroups have been reduced. This is use-
ful to increase the diversity in terms of coverage, i.e.,
to have subgroups that explain as different dataset re-
gions as possible.
Finally, not only the third step can be executed in
parallel. It is also possible to parallelize steps 2 and 4
to enhance the methodology performance.
6 CONCLUSIONS
This research was developed to provide clinicians
with a new approach for obtaining patient phenotypes
with a reduced dependency on the specific SD algo-
rithm(s) and hyperparameters used. For that, we first
defined the problem of mining a patient phenotype in
the form of a reduced subgroup set and, after that,
we proposed a new 6-step methodology based on the
evaluation of the overlap between the output of differ-
ent SD algorithm executions.
The experiments carried out in this work were fo-
cused on the antibiotic resistance problem and were
driven by our methodology. Besides, we used the
MIMIC-III public database as a data source and we
established the patients infected by an Enteroccous
Sp. bacterium resistant to Vancomycin as a target. We
obtained a phenotype f rss with 7 subgroups which
described adult male patients admitted to the surgi-
cal service (SURG) and in the surgical ICU (SICU)
who were readmitted in the hospital and spent one
day or more between the hospital admission and the
admission in the first ICU, and in which the cultures
were swab. Moreover, each subgroup from the final
phenotype covered 25% of the positive instances and
10% of the negative instances as maximum. Addition-
ally, this phenotype was compared in terms of cover-
age with the diverse top-2 subgroup lists obtained by
the DSLM algorithm. We used the Dice coefficient
for this comparison, obtaining an overlap of 50% be-
tween f rss and the first subgroup list and 62% be-
tween f rss and the second subgroup list.
Finally, future work can focus, for example, on us-
ing other visual support techniques in the methodol-
ogy (apart from the already used in this work), explore
other overlap functions, or integrate other techniques
such as the MDL principle in the phenotype genera-
tion process.
ACKNOWLEDGEMENTS
This work was partially funded by the CON-
FAINCE project (Ref: PID2021-122194OB-I00) by
MCIN/AEI/10.13039/501100011033 and by “ERDF
A way of making Europe”, by the “European
Union”, and by the GRALENIA project (Ref:
2021/C005/00150055) supported by the Spanish Min-
istry of Economic Affairs and Digital Transformation,
the Spanish Secretariat of State for Digitization and
Artificial Intelligence, Red.es and by the NextGen-
erationEU funding. This research was also partially
funded by a national grant (Ref: FPU18/02220), of
the Spanish Ministry of Science, Innovation and Uni-
versities (MCIU).
REFERENCES
Atzmueller, M. (2015). Subgroup Discovery - Advanced
Review. WIREs: Data Mining and Knowledge Dis-
covery, 5(1):35–49.
Atzmueller, M. and Puppe, F. (2006). SD-Map - A Fast
Algorithm for Exhaustive Subgroup Discovery. In
Knowledge Discovery in Databases (PKDD 2006),
pages 6–17.
Garriga, G., Kralj Novak, P., and Lavrac, N. (2006). Closed
Sets for Labeled Data. volume 9, pages 163–174.
Gr
¨
unwald, P. D. (2007). The Minimum Description Length
Principle, volume 1. The MIT Press.
Lakkaraju, H., Bach, S. H., and Leskovec, J. (2016). In-
terpretable Decision Sets: A Joint Framework for De-
scription and Prediction. In Proceedings of the 22nd
ACM SIGKDD International Conference on Knowl-
edge Discovery and Data Mining, page 1675–1684.
Lemmerich, F., Rohlfs, M., and Atzm
¨
uller, M. (2010). Fast
Discovery of Relevant Subgroup Patterns. In The
Florida AI Research Society.
Lopez-Martinez-Carrasco, A., Juarez, J. M., Campos, M.,
and Canovas-Segura, B. (2021). A methodology
based on Trace-based clustering for patient phenotyp-
ing. Knowledge-Based Systems, 232:107469.
Lopez-Martinez-Carrasco, A., Juarez, J. M., Campos, M.,
and Canovas-Segura, B. (2023a). VLSD - An Efficient
Subgroup Discovery Algorithm Based on Equivalence
Classes and Optimistic Estimate. Algorithms, 16(6).
Lopez-Martinez-Carrasco, A., Proenc¸a, H. M., Juarez,
J. M., Leeuwen, M. v., and Campos, M. (2023b).
Novel approach for phenotyping based on diverse top-
k subgroup lists. In Artificial Intelligence in Medicine,
pages 45–50.
Wojczynski, M. K. and Tiwari, H. K. (2008). Definition of
Phenotype. In Genetic Dissection of Complex Traits,
volume 60, pages 75–105.
A Methodology Based on Subgroup Discovery to Generate Reduced Subgroup Sets for Patient Phenotyping
353
