
Simulation of Consumers Behavior Facing Discounts and Promotions
Jarod Vanderlynden
1,2
, Philippe Mathieu
1
and Romain Warlop
2
1
Univ. Lille, CNRS, Centrale Lille, UMR 9189 CRIStAL, F-59000 Lille, France
2
fifty-five company, 5-7 rue d’Ath
`
enes Paris, France
fi fi
Keywords:
Consumer’s Behavior, Agent-Based Model, Simulation, Marketing, Pricing Strategy.
Abstract:
Discounts in stores are a powerful tools companies can use to create brand loyalty for products or increase
sales during a short period of time. However, discounts are costly campaigns that result in complex effects
on consumers, yielding unpredictable results and returns on investment. To maintain competitiveness, stores
and brands have to use those campaigns and risk substantial investments. To gain a better understanding
of the impact of discounts on consumer behavior, we argue that it is necessary to complement aggregated
solutions with more granular, individually-centered approaches, such as agent-based modeling. In our study,
we propose a new model based on social and psychological findings capable of replicating important and well-
known emergent phenomena. This simulation model permits the study of behavioral responses to discounts
and price strategy and can help companies to gain a clearer understanding of the effects of their different
campaigns.
1 INTRODUCTION
In today’s highly competitive business landscape,
companies are well-aware of the indispensable role
marketing plays in driving growth and establishing
brand dominance. Companies have measured the
importance and benefits of promotional campaigns,
including discounts. One of the essential elements
of marketing is offering promotional discounts and
launching campaigns. These efforts not only attract
and retain customers but also position the brand ad-
vantageously in the consumer’s memory. To influence
behavior, companies design campaigns as effective
as possible by identifying the target population and
the optimal means of promotion. Unfortunately, such
campaigns are expensive and, if not executed cor-
rectly, can be of little use or even negatively influence
the image of a brand or product. As with many costly
and complex phenomena, measuring the impact of
conceived campaign strategies in a computational lab-
oratory prior to real-world deployment is preferable to
reduce costs and to better align with the potential de-
mand. The use of computational models to evaluate
marketing strategies is well acknowledged. (Negah-
ban and Yilmaz, 2014; Axtell and Farmer, 2022; Said
et al., 2002; Delre et al., 2007; Jager, 2007).
The effects of marketing campaign (marketing
mix (Borden, 1964)) are mainly analyzed by sta-
tistical methods (Tellis, 2006; Wigren and Cornell,
2019) and machine learning algorithms (Tellis, 2006;
Hung et al., 2019) to analyze customer segmen-
tation and to support decision-making. However,
these approaches are limited in understanding the
impact of fine-grained consumer behaviors or sup-
porting exploratory modeling analysis of campaign
strategies under various scenarios. We argue that
Multi-Agent Systems (MAS) perspective with its
individual-centered approach via Agent-Based Mod-
eling (ABM) facilitates the design and calibration of
behaviors at a level of detail that allows a better un-
derstanding of the factors facing a marketing cam-
paign. We also show that such an approach allows
easier adaptation to changes in the environment such
as the arrival or change of a product, thus providing
robust and exploitable results.
In this article, we consider the context of a super-
market with the objective of understanding the con-
sumers’ behaviors through their adaptive reactions
over time to changes in prices or packaging of prod-
ucts. To do so, we propose a model focused on in-
dividuals, allowing the deployment of promotional
campaigns at a chosen date and duration through sim-
ulation, and measuring its impact on various popula-
tions. The great diversity of customer behaviors and
promotional campaigns (price reduction, a percentage
discount, vouchers, purchased/offered lots) motivates
260
Vanderlynden, J., Mathieu, P. and Warlop, R.
Simulation of Consumers Behavior Facing Discounts and Promotions.
DOI: 10.5220/0012320300003636
Paper published under CC license (CC BY-NC-ND 4.0)
In Proceedings of the 16th International Conference on Agents and Artificial Intelligence (ICAART 2024) - Volume 3, pages 260-267
ISBN: 978-989-758-680-4; ISSN: 2184-433X
Proceedings Copyright © 2024 by SCITEPRESS – Science and Technology Publications, Lda.

using ABM.
The rest of the paper is structured as follows. In
the first part, we present the state of the art and high-
light the significance of exploring the link between
price evolution and consumer behavior. In the second
part, we present an ABM for testing discount cam-
paigns that rely on an individual utility function that
each agent uses to evaluate products. The third part
describes the design of computational experiments
performed along with the results in relation to loyalty
and sales volume evolution. Finally, the last part dis-
cusses the model’s advantages, potential extensions,
and future research avenues it affords, including con-
sidering social influence.
2 BACKGROUND: ABM IN
MARKETING RESEARCH
The study of marketing strategies through simula-
tion is not new. Prior research often relied on using
equation-based or statistical approaches. Research on
individual-centered ABM approaches highlighted the
significance of behavioral differentiation. (Negahban
and Yilmaz, 2014; Axtell and Farmer, 2022; Said
et al., 2002; Delre et al., 2007; Jager, 2007).
• In (Delre et al., 2007) the launch of a prod-
uct in a population is influenced by word-of-
mouth (WOM), and The interaction possibilities
are modeled via a ”small world” (Watts–Strogatz)
graph. In the model, when an agent adopts a new
product, it tries to convince its neighbors to do the
same. Word-of-mouth is a complex phenomenon
and the models that study it integrate graphs to
represent notions of social contacts, which agents
can influence. We consider word-of-mouth, or in
general social influence, is an area of study that
offers new avenues of research but is not the pri-
mary focus of our current research objective. The
confounding effects of the word-of-mouth mecha-
nism with price dynamics would reduce the inter-
pretability of the results, so we are primarily in-
terested in understanding the impact of prices on
different behaviors.
• There exist guidelines for modeling various mar-
keting aspects in ABMs In (Negahban and Yil-
maz, 2014), the authors propose an approach
based on evaluating products according to a util-
ity function. This allows model agents to evaluate
items differently according to their characteristics.
Thus, it becomes possible to create and modulate
the characteristics of the agents, to reproduce be-
haviors classically observed in marketing.
• The use of ABM with individual behavioral pa-
rameters that regulate the diffusion of products
is discussed in (Said et al., 2002). By exploring
the parameter space, the authors reproduce styl-
ized facts about consumers’ brand choices, such
as the emergence of an equilibrium between mar-
ket shares and a lock-in effect of the market shares
of a dominant brand or a cyclical competition be-
tween dominant brands.
• In (Jager, 2007), the authors apply marketing el-
ements, including product, price, place of dis-
tribution, and promotion, in a social simulation
model centered on individual behavior. In their
model, agents have both individual and social
preferences. Individual preferences are defined by
the characteristics of each agent and social prefer-
ences are determined by looking at the consump-
tion of socially connected individuals in a random
graph. These four characteristics are fundamental
in marketing and originate in (Borden, 1964).
However, it should be noted that the models pre-
sented in (Delre et al., 2007; Said et al., 2002) do not
explicitly integrate the price component, and that (Ne-
gahban and Yilmaz, 2014; Axtell and Farmer, 2022;
Jager, 2007) do integrate the price, but are mainly in-
terested in social influence without studying the price-
behavior link, which is the central point of our work.
Some properties are generally easier to model with
ABMs than equational models. This is notably the
case of social influence dynamics which requires ex-
plicit links between different individuals, as opposed
to the notion of advertising, which can be explored
with an equational model.
2.1 Modeling Individual Behavior
The modeling of a purchasing behavior process is
based on two fundamental aspects: internal influences
(characteristics specific to each individual that influ-
ence the desire to buy a given product) and exter-
nal influences (e.g., advertising, promotion, word of
mouth). In this work, we focus only on internal influ-
ences and price dynamics. It seems natural for most
authors to use the price and quality of each product
as an internal influence. (Hardie et al., 1993; Bawa,
1990; Seetharaman and Chintagunta, 1998; Cohen
et al., 2020) propose to add additional criteria: loss
aversion or inertia.
• loss aversion (prospect theory), is predicated on
the notion that losing 1$ has more impact on a
consumer than gaining 1$.
• inertia or brand loyalty, suggests that a consumer
will not necessarily take the ”best” product of-
Simulation of Consumers Behavior Facing Discounts and Promotions
261

fered, because it is also influenced by habitual be-
havior and brand loyalty.
(Hardie et al., 1993; Cohen et al., 2020) sug-
gest using a reference product to consider loss aver-
sion. This can be specific to each individual in a
MAS model. The inertia can be simply considered
by a reinforcement process or preferential attachment
(Bawa, 1990; Seetharaman and Chintagunta, 1998).
These aspects can be combined through a utility func-
tion used when evaluating a product ((Negahban and
Yilmaz, 2014)). To combine these different notions,
(Negahban and Yilmaz, 2014) suggests summing up
the behaviors taken into account with a utility func-
tion used when evaluating a product.
2.2 The Impact of Promotion
Promotions undeniably increase sales volume (Blat-
tberg et al., 1995) and induce asymmetrical impact on
other products, along with diminishing returns on re-
peated promotions. The confounding effects of these
different aspects motivate our work on evaluating a
promotional campaign model. To this end, our model
builds on an individual-centered modeling framework
(Negahban and Yilmaz, 2014; Axtell and Farmer,
2022; Said et al., 2002; Delre et al., 2007; Jager,
2007) and augments it with loss aversion and inertia
as (Hardie et al., 1993; Bawa, 1990; Seetharaman and
Chintagunta, 1998; Cohen et al., 2020) to exhibit the
classical impact properties of promotions described
by (Blattberg et al., 1995).
3 SPECIFICATION OF THE
MODEL
In this article, we focus on a model of a store by which
it is possible to simulate different discounts on dif-
ferent products. For example, a percentage reduction
in price or a ”by three get one free promotion”. The
model is also capable of reacting to price changes out-
side a temporary promotion, or to the arrival of new
products in the store. In this model, there is no spatial
representation, the agents are omniscient and know all
the products and their characteristics. We do not take
into account the geographical positioning of the store
and the products, nor the social influence, in order to
focus on the influence of price and promotions.
We start by presenting the packs (products) and
the agents that constitute the store’s customers, fol-
lowed by the specification of the environment that
characterizes the store and its products. The model
dynamics is based on a behavioral model, involving
the strategies and mechanisms used by agents to rea-
son and make decisions about product selection.
3.1 The Product Model
A ”pack” represents any product in a supermar-
ket. This product can be sold alone or in a pack.
This information is represented by the characteristic
quantity In our model, it is represented by a quadru-
ple, P(p, Qte,Qa, D):
• p represents the price,
• Qte is the quantity of product in one pack,
• Qa is the level quality,
• D represents a boolean variable indicating if there
is a discount.
For more realism, products are regrouped into dif-
ferent categories. Let C = c
1
, c
2
, ... be a set of product
categories. Let C
i
= P
1
, P
2
, ... be a set of products rep-
resenting a product category. Each pack belongs to a
category C
i
∈ C = C
1
,C
2
, ...
∀P
j
∃C
i
|P
j
∈ C
i
,C
i
∈ C (1)
The objective of the different agents is to choose,
at most, one product in each category.
3.2 Customer/Agent Settings
An agent, a(H
i
, λ
i
, P
re f
i
, (β
p
, β
q
, β
i
, β
l
)), represents an
entity (a person, a family or other) who shops regu-
larly in the store. Its behavior is based on its habits.
An agent is characterized by internal parameters that
differentiate it from its peers and individual history
and cognitive references for each category. Let:
• l
h
the length of the purchase history considered by
the agent. (sliding window)
• H
i,a
a list of packs for each category correspond-
ing to the purchase history.
P
i,a,t
The product purchased by agent a in category
C
i
at time t H
i,a,t
= P
i,a,t
,
at initialization H
i,a
=
{P
i,a,−l
h
, P
i,a,−l
h
+1
, ..., P
i,a,−1
}. At time t = l
h
,
H
i,a
= {P
i,a,1
, P
i,a,2
..., P
i,a,l
h
}.
• λ
i,a
the need for each category C
i
.
• P
re f ,i
a reference product by category C
i
as in
(Hardie et al., 1993)
• β
p
, β
q
, β
i
, β
l
Sensitivity to price, quality, inertia
(the strength of habits) and promotions.
ICAART 2024 - 16th International Conference on Agents and Artificial Intelligence
262

3.3 The Environment
The environment represents the store which includes
the agents and the products. The agents interact with
the environment by buying products. We use the envi-
ronment parameters to modulate the global function-
ing of the model, e.g., increasing the significance of
promotion or increasing the capacity of loss aversion.
The environment is therefore characterized by the fol-
lowing properties:
• β is the loss aversion parameter (identical for price
and quality), β > 1.
• C defines limit for the purchase quantity, C >= 1.
• α
sat
represents the saturation parameter.
• l
h
is the length of the purchase history.
• G
p
, G
q
, G
i
, G
d
represent the impact regulation pa-
rameters: price, quality, inertia, and promotion
(discount).
Figure 1: UML Conceptual Structure of the Model.
3.4 Hypothesis
We consider products as everyday consumer goods,
which allows us to hypothesize that purchases are fre-
quent and therefore that at each time step each agent
questions the purchase. We could consider that a time
step represents a week and that each customer arrives
at the store each week to shop. It is assumed that the
need (the λ
i,a
) is computed using the average history
of the quantities purchased: λ
i,a
= mean(H
i,a
(qte)).
We exclude purchases of different packs in the same
category to simplify the choice of agents. This is
equivalent to excluding the purchase of two similar
packs, but of different brands. Each agent chooses,
at each time step, at most one pack in each category.
This assumption does not prevent agents from buy-
ing the same pack multiple times or from not buying
anything.
3.5 The Strategy for Choosing Packs
The strategy for pack selection depends on the pref-
erences of agents. Agents can have distinct choices
depending on their valuations.
3.5.1 Agent Preferences
At each time step, agents determine if they need a
product of a specific category. An agent a evaluates
C
i
, by computing B(C
i
,t +1), the probability of need-
ing a product of this category at time t + 1. Finally,
N(C
i
,t,t − n) is the quantity of the product the agent
purchases in the last n steps.
sigmoid(x) =
1
1 + e
−x
(2)
B(C
i
,t + 1) = sigmoid(
λ
i,a
N(C
i
,t,t − n)
) (3)
Intuitively, this formula allows agent a to increase
the probability of being interested in category C
i
if it
has purchased a small amount over the last few steps
and inversely to reduce this probability if it has pur-
chased more than usual lately.
3.5.2 The Evaluation of Packs
When an agent is interested in a product category,
it evaluates all the packs, gives them a score, and
chooses one. A high score means that the product
matches the agent’s expectations and is more likely
to be chosen. The probability of purchase is propor-
tional to the scores of the packs. For example, if we
take 3 packs A, B and C with a score of 12, 6 and 2
respectively, the probability of purchase distribution
will be 0.6 for A, 0.3 for B and 0.1 for C. Let c a pack
category, P
c
a pack within c, Pr
P
c
the probability of
the pack P
c
to be chosen and score
P
c
the score of the
pack.
Pr
P
c
=
score
P
c
∑
i∈c
score
P
i
(4)
To give a score to the packs, the agent uses his
sensitivities and the parameters of the packs.
We define four utility functions U
1
,U
2
,U
3
,U
4
, one
for each evaluated characteristic, respectively: price,
quality, inertia, and promotion. The first two U
1
and
U
2
compare the pack being evaluated with the refer-
ence pack on price and quality. It’s in these formu-
las that loss aversion is taken into account. The third
one considers the inertia, similar to the specification
presented in (Bawa, 1990). Finally, the last func-
tion calculates the impact of a promotion. We then
weigh the results of the four previous functions by the
agent’s sensitivities. The aggregate utility determines
the score of the pack for this agent. The higher the
score, the more the agent is interested in the pack.
(x)
+
represents the maximum between 0 and x.
Simulation of Consumers Behavior Facing Discounts and Promotions
263

U
1
= G
p
× (β × (p − p
re f
)
+
+ (p
re f
− p)
+
) (5)
U
2
= G
q
× (β × (q − q
re f
)
+
+ (q
re f
− q)
+
) (6)
U
3
= G
i
× (10 × nb
bought
− nb
2
bought
) (7)
U
4
= G
d
× D (8)
We note that the impact of the price decrease is
calculated in U
1
and not U
4
. We model with U
4
only
the impact of the presence or not of a promotion.
U(P, a) =
n
∑
k=1
U
k
∗ β
a,k
(9)
3.5.3 The Purchase Quantity
Calculating the quantity purchased is independent of
the internal quantity of each product. This calculation
is used to decide the number of packs bought by the
agent for the chosen pack. If P(p, Qte, Qa, D) is the
chosen product, and Qte is 100g, then the agent will
use the formula 10 to calculate the desired quantity.
The agent then buys three times the same product. In
this formulation, N(C
i
,t) is the quantity purchased at
time t of C
i
.
Buy(P,t + 1) = max(1, λ
i,a
+ N) × S (10)
N =
T
∑
τ=0
λ
i,a
− N(C
i
,t − τ)
T + 1
) (11)
S = Sat(U(P) −U (P
re f
,t)) (12)
Sat(x) =
C
1 + e
−
X
α
sat
+log(C−1)
(13)
3.6 The Dynamics of the Model
The Choose method chooses a pack using a probabil-
ity distribution proportional to the pack score. The Qt
method uses equations 10 to 13 to compute the quan-
tity that the agent a buys.
A trace of the execution of this algorithm can be
found in the Jupyter sheet available at this address:
https://github.com/cristal-smac/retail
4 EXPERIMENTS
In this section we show the model is capable to re-
produce known marketing phenomena. All our ex-
periments are performed with the same environmen-
tal parameters. On the same experiment, the agents
and products have the same characteristics to allow
Data: A the sets of agents;
C the sets of packs category;
H
(i,a,t)
the history of what agent A bought on
category Ci at time t;
Result: Decision process used by each agent.
t ← time step t;
for all agents a ∈ A do
a go to the store;
for all category c
i
∈ C do
H
(i,a,t−l
h
)
← None (delete);
p ← B(c
i
,t + 1);
x ∼ U(0, 1);
if x > p then
H
(i,a,t)
← (None, 0)
else
for every product p ∈ c
i
do
score(p) ← U(p, a);
l append (score(p), p);
end
P
i,a,t
← Choose(l);
q ← Qt(Chos, re f );
H
(i,a,t)
← (Chos, q);
end
end
end
Algorithm 1: Decision process.
comparison. The procedure to generate the agents and
products are randomized procedures. The agents are
categorized according to their sensitivities. All ex-
periments are performed several times (20) for more
accuracy. We show that in the same situation (similar
agents and products), two identical promotions have
almost the same effect.
The model is able to reproduce classical macro-
scopic promotional phenomena in marketing such as:
• The increase in the volume of sales of a product on
promotion. This effect is fundamental according
to (Blattberg et al., 1995).
• Cannibalization, which corresponds to the de-
crease in sales of products competing with a prod-
uct discounted during a discount.
• Repeated promotions on the same product have a
lesser impact with each new promotion.
But above all, the model can reproduce phenom-
ena that are observable only at the level of the agents,
impossible to observe with an approach that would
not be centered on the individual, such as :
• Multiple successive promotions change the refer-
ence price of the agents.
• The price war is a phenomenon with macroscopic
impacts, but also microscopic impacts by chang-
ing the perceptions that consumers have of certain
ICAART 2024 - 16th International Conference on Agents and Artificial Intelligence
264
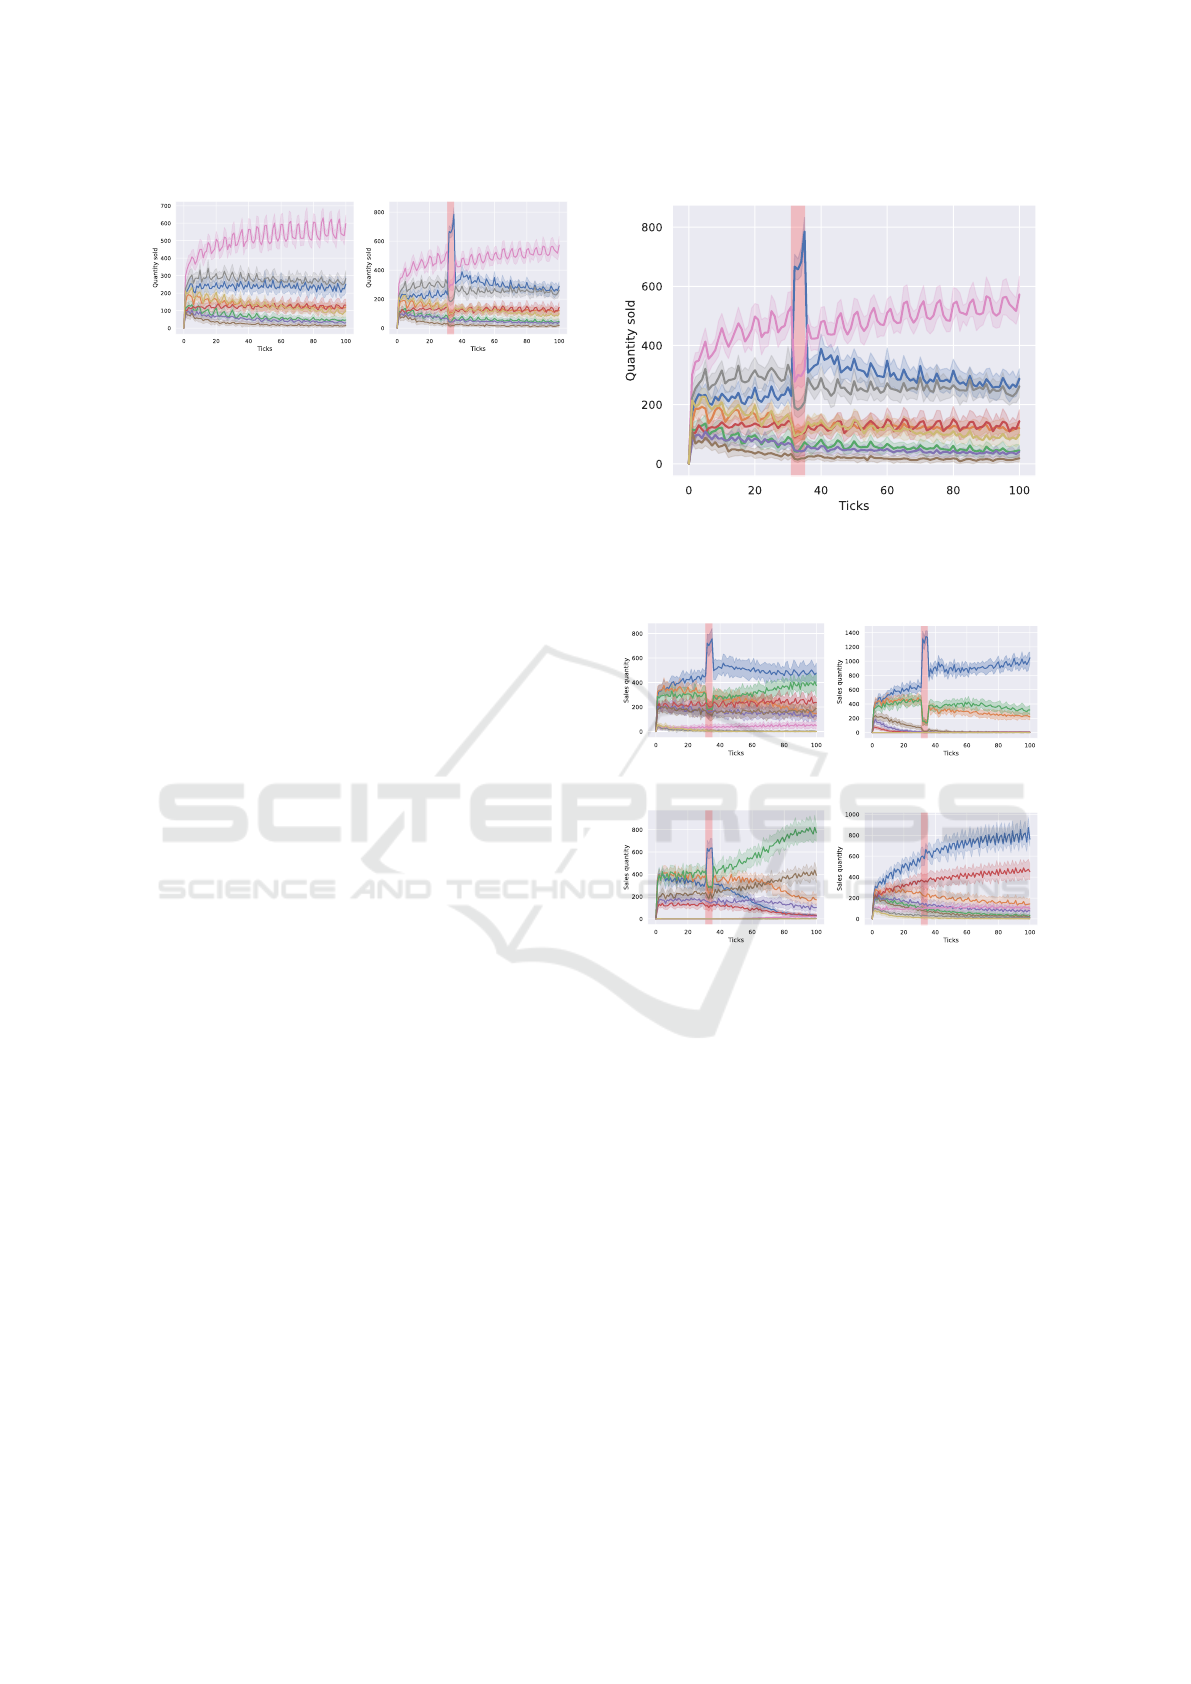
Figure 2: Quantity of sales as a function of time in a simu-
lation. On the left without a promotion, on the right with a
promotion of 40% between time steps 30 and 34.
brands. This influence also has effects on the loy-
alty of consumers to certain brands.
• How promotion impacts the acquisition and re-
tention of new consumers, especially according
to different profiles. For example, a promophile
consumer will regularly change products if they
are on promotion.
Within our experiments, it is discerned that the
model adeptly reproduces renowned effects with con-
siderable precision, thereby affirming the validity of
our methodology.
4.1 Decline in Sales Volume of Other
Products
The decline in sales of products that are not on pro-
motion is also a common phenomenon. It is said that
the promoted product ”cannibalizes” the sales of other
products of the same type. This effect can be seen in
Figure 3. The drop in sales of non-promoted prod-
ucts ranges from 2 to 20 percent on average and varies
by product and by similarity to the promoted product.
The drop varies by the number of product in the cate-
gory too. At least 1 product always has a sales decline
of more than 0 percent.
4.2 Impact of Repeated Promotions
The model also shows the frequency of promotions
wields a profound influence on their efficacy. A satu-
ration of promotions tends to attenuate the peak sales
they typically induce. This can be attributed to the
evolving consumer evaluation of products; as they
grow accustomed to incessant discounts, their propen-
sity to transition between products during a discount
diminishes. This effect can be seen in our model as
described by 3
4.3 Testing the Robustness of the Model
To test and show how the model can behave, and it’s
adaptation to different cases, we make 3 other test :
Figure 3: Quantity of sales as a function of time in a simu-
lation with a promotion of 40% on the Pack 0 between time
steps 30 and 34.
(a) Evenly distributed pro-
files.
(b) Only discount oriented
agents.
(c) Only price, quality ori-
ented agents.
(d) Only inertial/loyal
agents.
Figure 4: Simulations of 100 time steps, making a 40% dis-
count between time step 30 and 34 on all simulations. We
very the sensibilities of the agents in each simulation. In
4a a simulation with the 5 profiles presented earlier evenly
distributed. In 4b a simulation with only discount oriented
agents (promophile). In 4c a simulation with only price,
quality oriented agents and finally in 4d a simulation with
only inertial/loyal agents.
what happens when profiles of agents change, how the
duration of discount impact the results and we test the
difference between a temporary price reduction and a
discount.
4.3.1 What Happens when You Change the
Behavior/profiles of Agents
We vary the proportions of the different agent pro-
files and test new ones to observe the effects of these
agent’s parameters on the model.
On simulations in figure 4 we observe that the pro-
Simulation of Consumers Behavior Facing Discounts and Promotions
265

Figure 5: Simulations of 100 time steps, making a 20% dis-
count between time step 30 and 34 on the left and a 20%
discount between time step 30 and 50 on the right.
mophile profiles are very impacted by the promotion,
but are also more likely to be loyal. Indeed, on the
same promotion of 40% on the same time steps with
the same agents and the same packs, we observe a
short term increase in sales of 78% for the promotion
on classic profiles against 116% for the promotion on
only promophile profiles. Similarly, in the long term,
we see an increase from 28% for classic profiles to
79% for promophile profiles. Finally, if price and
quality agents’ sensibilities are exacerbated, we ob-
tain agents who are very oriented towards the qual-
ity/price ratio. This ratio is better during a promotion,
which means that we always see an increase in sales
during the promotion, but since the agents are very
oriented towards the quality/price ratio, they tend to
quickly turn to the pack with the best ratio. Finally,
the so-called inertial or loyal agents are not impacted
by the promotion. These simulations show that a vari-
ation of the agents’ sensitivities leads to different re-
sults, but always consistent with what we model.
4.3.2 The Impact of the Duration of a Discount
The duration of a discount corresponds to the number
of ticks the discount lasts. The simulations of figure
5 shows longer discounts have greater impact. The
long discount last 20 ticks compared to 4 ticks for the
other. However, it is important to note that we go from
a peak sale of 78% to a peak sale of 110% for the same
amount of discount. Finally, the length of the promo-
tion leads to a stronger loyalty. Indeed, the inertia has
time to set in, the customers have in a way made the
product part of their consumption habits.
4.3.3 The Difference Between a Temporary
Price Reduction and a Discount
Figure 6 shows the difference between a discount and
a temporary price reduction. A price reduction that is
not posted as a discount has less impact. The short-
term impact of the promotion is 76% additional sales
(during the promotion) versus 45% for the discount,
and the long-term impact is 28% additional sales for
the promotion (loyalty) versus 20% for the discount.
Indeed, promophile agents do not perceive this dis-
Figure 6: Simulations of 100 time steps, making a 20% dis-
count between time step 30 and 34 on the left and a 20%
price reduction between time step 30 and 50 on the right.
count as a promotion. Only price-oriented agents are
really sensitive to this kind of change.
5 MODEL CAPABILITIES
In this section, we explore the practical applica-
tions of our model and demonstrate its ability to
inform decision-making processes in pricing strate-
gies. Leveraging the power of computational simu-
lation, we uncover valuable insights into optimizing
discounts : when to apply them, how much to offer,
and the interplay of competitive products in the mar-
ket.
We propose an experiment involving 3 packs
of the same category, directly competing with each
other. It is noteworthy that the price-quality ratio is
the same for each of the packs to avoid a domination
of one pack in the simulation. The number of simu-
lation time steps, the number of agents, their parame-
ters, and the timings at which promotions for packs B
and C are carried out are fixed. The goal is to test var-
ious promotions for pack A, calculate the profits (the
selling price minus a lower value representing the cost
of the pack) for this pack, and determine the best pro-
motions to carry out.
To test different promotions, we initially con-
ducted a random search and then implemented a ge-
netic algorithm. We justify the use of a genetic al-
gorithm because the number of possible promotions
is very large and we cound’t find the optimal solu-
tion in a reasonable time. In this experiment, in each
simulation, we propose conducting up to 10 different
promotions for Pack A throughout the simulation at
variying time steps. Given the simulation duration of
100 time steps, there are up to C
100
20
possible promo-
tion moments and 100
10
possible promotion power (in
%). Even when excluding promotions at a loss, this
number remains substantial.
Firstly, it emerges from this experiment that in our
model under these experimental conditions, it is more
profitable for the profits generated by pack A if its
promotions do not coincide with the promotions of
packs B and C. Additionally, we observe that con-
ICAART 2024 - 16th International Conference on Agents and Artificial Intelligence
266

ducting a rather strong promotion (around 40%) at the
very beginning of the simulation, from time steps 0 to
10, increases the profits of Pack A. It is noteworthy
that there are no other promotions on packs B and C
at this specific moment. Finally, the model demon-
strates that it is necessary to conduct at least a second
promotion later in the simulation, often just after the
promotions of B and C, to prevent these promotions
from impacting the sales of A.
In conclusion, our experimental findings suggest
that, within the specified experimental conditions of
our model, it is more advantageous for the profits gen-
erated by pack A to schedule its promotions indepen-
dently of those for packs B and C and to use the pro-
motion sparingly.
6 DISCUSSION
In this paper, we show in section 4 that the agent-
based approach proposed in section 3 is able to repro-
duce emerging phenomena known in marketing such
as the increase in sales volume, the ”cannibalization”
linked to competition or the changes in customers be-
havior caused by the rapid repetition of promotions.
Moreover, the individual-centered approach allows us
to show phenomena that are only observable at the in-
dividual level, such as loyalty during a promotion or
the effects of price wars directly on consumers. We
show the model’s ability to reproduce general stylized
marketing facts and to adapt to different scenarios. In
this way, we propose a form of learning that allows
us to start from a known scenario, and run a complete
simulation of different scenarios that we would like to
explore. Scenario exploration is facilitated by access
to simulated data similar to real data (sales receipts).
In order to deepen the model, it is possible to add
a system of social influence similar to those described
in the section 2, which would allow agents to ex-
change and interact with each other in order to in-
fluence each other. Moreover, it is possible to give
the agents only a partial knowledge of the products,
so the agents would have to discover themselves the
products they do not know or be socially influenced.
Finally, it would be interesting to study the notion of
similarity between products and to see, according to
this similarity, the competition generated and the ef-
fects of promotions.
The proposed model has the possibility to easily
integrate real data (via history) which would improve
the realism, and apply the model to concrete scenar-
ios. We justify its adaptability to the data through the
global parameters built into the model.
REFERENCES
Axtell, R. L. and Farmer, J. D. (2022). Agent-based mod-
eling in economics and finance: Past, present, and fu-
ture. Journal of Economic Literature.
Bawa, K. (1990). Modeling inertia and variety seeking ten-
dencies in brand choice behavior. Marketing science,
9(3):263–278.
Blattberg, R. C., Briesch, R., and Fox, E. J. (1995).
How promotions work. Marketing science,
14(3 supplement):G122–G132.
Borden, N. H. (1964). The concept of the marketing mix.
Journal of advertising research, 4(2):2–7.
Cohen, M. C., Gupta, S., Kalas, J. J., and Perakis, G. (2020).
An efficient algorithm for dynamic pricing using a
graphical representation. Production and Operations
Management, 29(10):2326–2349.
Delre, S. A., Jager, W., Bijmolt, T. H., and Janssen, M. A.
(2007). Targeting and timing promotional activities:
An agent-based model for the takeoff of new products.
Journal of business research, 60(8):826–835.
Hardie, B. G., Johnson, E. J., and Fader, P. S. (1993). Mod-
eling loss aversion and reference dependence effects
on brand choice. Marketing science, 12(4):378–394.
Hung, P. D., Ngoc, N. D., and Hanh, T. D. (2019). K-means
clustering using ra case study of market segmentation.
In Proceedings of the 2019 5th International Confer-
ence on E-Business and Applications, pages 100–104.
Jager, W. (2007). The four p’s in social simulation, a per-
spective on how marketing could benefit from the use
of social simulation. Journal of Business Research,
60(8):868–875.
Negahban, A. and Yilmaz, L. (2014). Agent-based simula-
tion applications in marketing research: an integrated
review. Journal of Simulation, 8(2):129–142.
Said, L. B., Bouron, T., and Drogoul, A. (2002). Agent-
based interaction analysis of consumer behavior. In
Proceedings of the first international joint conference
on Autonomous agents and multiagent systems: part
1, pages 184–190.
Seetharaman, P. and Chintagunta, P. (1998). A model
of inertia and variety-seeking with marketing vari-
ables. International Journal of Research in Market-
ing, 15(1):1–17.
Tellis, G. J. (2006). Modeling marketing mix. Handbook of
marketing research, pages 506–522.
Wigren, R. and Cornell, F. (2019). Marketing mix mod-
elling: A comparative study of statistical models.
Simulation of Consumers Behavior Facing Discounts and Promotions
267
