
GENUINE: Genomic and Nucleus Information Embedding for Single
Cell Genetic Alteration Classification in Microscopic Images
Simon Gutwein
1,2 a
, Martin Kampel
2 b
Sabine Taschner-Mandl
1 c
and Roxane Licandro
3 d
1
St. Anna Children’s Cancer Research Institute, Zimmermannplatz 10, Vienna, Austria
2
TU Wien, Faculty of Informatics, Institute of Visual Computing & Human-Centered Technology, Computer Vision Lab,
Favoritenstr. 9/193-1, A-1040 Vienna, Austria
3
Medical University of Vienna, Department of Biomedical Imaging and Image-guided Therapy,
Computational Imaging Research Lab (CIR), Waehringer Guertel 18-20, A-1090 Vienna, Austria
Keywords:
Genetic Alteration, Cancer Diagnostics, Two-Stream Network, Fluorescence in Situ Hybridization,
Label Noise.
Abstract:
Fluorescence in situ hybridization (FISH) is an essential technique in cancer diagnostics, providing valuable
insights into the genetic aberrations typical of malignancies. However, the effectiveness of FISH analysis
is often impeded by the susceptibility of conventional classification algorithms to variations in image ap-
pearances, coupled with a reliance on manually crafted decision rule design, limiting their adaptability and
precision. To address these challenges, we introduce GENUINE, an innovative two-stream network that com-
bines whole image information through a convolutional neural network encoder and incorporates a single
FISH signal stream dedicated to the analysis of individual signals. Our results demonstrate that GENUINE
achieves remarkable accuracy not only on datasets resembling the training data distributions, but also on pre-
viously unseen data, underscoring its robustness and generalizability. Moreover, we present evidence that the
architecture of GENUINE inherently acts as a regularizer during training against label noise. This leads to the
extraction of meaningful features and thereby fosters a biological relevant organization of the feature space.
The development of GENUINE marks a significant advancement in the utilization of FISH for cancer diag-
nostics, providing a robust and versatile tool capable of navigating the complexities of genetic aberrations in
malignancies.
1 INTRODUCTION
Fluorescence in situ hybridization (FISH) stands as a
foundational tool in molecular cytogenetics, essential
for interrogating genetic aberrations in cells (Pinkel
et al., 1986). This technique has been instrumental in
various fields of cancer research, facilitating the de-
tection and localization of specific DNA sequences on
chromosomes. FISH allows for the identification of a
wide array of genetic aberrations, such as gene am-
plifications, deletions, translocations, and chromoso-
mal aneuploidies (Chrzanowska et al., 2020). These
insights play a crucial role in understanding disease
progression and tailoring therapeutic interventions.
Neuroblastoma, a malignant pediatric tumor of the
a
https://orcid.org/0009-0004-8406-0736
b
https://orcid.org/0000-0002-5217-2854
c
https://orcid.org/0000-0002-1439-5301
d
https://orcid.org/0000-0001-9066-4473
sympathetic nervous system, in which the amplifica-
tion of the MYCN gene correlates strongly with poor
prognosis, offers a unique lens into the challenges
posed by FISH imaging (Mathew et al., 2001; Huang
and Weiss, 2013; Otte et al., 2021). FISH images,
in the context of MYCN amplification detection, in-
corporate a RGB-color scheme: a red channel for the
NMI gene, a green channel for the MYCN gene, and a
blue channel for DAPI - a nuclear marker - linked to
the wavelength used to image the bound fluorophore
(see Figure 1, top left). The interpretation depends
on the signal count in these channels. For instance, if
the number of green signals (representing the MYCN
gene) is four times as high or higher as the red signals,
the nucleus is classified as MYCN amplified (MNA)
(Cohn et al., 2009). Any smaller ratio defines a non-
MNA classification (Cohn et al., 2009). While stan-
dardized guidelines exist for interpreting single signal
appearances, the classification becomes trickier with
Gutwein, S., Kampel, M., Taschner-Mandl, S. and Licandro, R.
GENUINE: Genomic and Nucleus Information Embedding for Single Cell Genetic Alteration Classification in Microscopic Images.
DOI: 10.5220/0012319700003654
Paper published under CC license (CC BY-NC-ND 4.0)
In Proceedings of the 13th International Conference on Pattern Recognition Applications and Methods (ICPRAM 2024), pages 27-36
ISBN: 978-989-758-684-2; ISSN: 2184-4313
Proceedings Copyright © 2024 by SCITEPRESS – Science and Technology Publications, Lda.
27

clustered signals, introducing ambiguity in diagnostic
outcomes. Clustered signals emerge primarily from
two sources. Firstly, nuclei with a strong MYCN am-
plification can lead to signal overlaps due to the den-
sity of the MYCN signals. Secondly, prolonged ex-
posure times during imaging can result in increased
brightness, which in turn causes signals to merge.
Conventional image analysis techniques, while
foundational, are frequently inadequate when con-
fronted with the multifaceted nuances of FISH sig-
nal patterns and overall image characteristics. These
techniques, are based on predefined thresholds and
deterministic algorithms, do not possess the flexibil-
ity needed to adapt to the variability in signal in-
tensity, spatial distribution, or overlapping signals
(Gudla et al., 2017; Sadr et al., 2018). These varia-
tions in appearance are not merely a cosmetic issue,
but pose genuine diagnostic challenges. Subtle differ-
ences in image attributes can translate to vastly dif-
ferent interpretations, especially when signals clus-
ter or disperse irregularly. The static nature of tra-
ditional methods can inadvertently neglect these nu-
ances, leading to a risk of potential misinterpretations
or misclassifications. Such inaccuracies do not only
impede accurate diagnosis, but also guide therapeutic
decisions down to sub-optimal paths.
The emergence of deep learning marks a signifi-
cant leap forward in medical image analysis (Litjens
et al., 2017). Harnessing the capabilities of these ad-
vanced technologies, our study presents a two-stream
network architecture tailored for the precise classifi-
cation of genetic aberrations in FISH images. This
paper delves into the detailed workings of this archi-
tecture, highlighting its standout performance and the
promise that it holds for the future of genetic aberra-
tion diagnostics. Moreover, as part of our approach,
we have implemented an automated labeling process,
crafting a uniquely labeled training dataset composed
of single nucleus patches. This dataset was created
by leveraging state-of-the-art single nucleus segmen-
tation techniques.
Related Work. Current approaches to evaluate
FISH images are limited to spot-like appearances
of signals such as the solutions from (Bahry et al.,
2021) and (Gudla et al., 2017). In both works,
spot-like features are accurately localized in FISH
images with (Bahry et al., 2021) using random
sampling consensus outlier detection on gradients of
Difference-of-Gaussian, reaching false positive and
false negative rates below 1% and (Gudla et al., 2017)
utilizing two networks, one with a random forest
algorithm and the other built from a Convolutional
Neural Network (CNN) architecture. In (Bouilhol
et al., 2021) an adapted CNN architecture is proposed
to detect spots in single molecule FISH, by enhancing
their appearance for conventional spot detection
algorithms without the need for manual parameter
tuning. However, a prerequisite is spot-like signal
appearances, which is not satisfied in our task. An
end-to-end workflow is presented in (Zakrzewski
et al., 2019) that automatically assesses the patient-
wide HER2 gene amplification status based on FISH
images. They train two Retina-Net architectures
(Lin et al., 2017) with ResNet-50 (He et al., 2015)
as backbone on the supervised nuclei segmentation
and spot detection task to evaluate whole nuclei and
spot-like or cluster signals in nuclei crops. Both
networks provide an independent prediction, based
on handcrafted classification rules increasing the
interpretability of their approach. However, the final
diagnostic statement must be made by an expert.
The contribution of this paper can be summarized as
follows:
Contributions
• Two-Stream Architecture GENUINE. We in-
troduce a novel two-stream architecture named
GENUINE, which synergistically combines an
encoder path utilizing a CNN with a stream ded-
icated to processing single FISH signal infor-
mation. This innovative approach enables the
model to efficiently integrate and learn from di-
verse sources of information, thereby enhancing
its predictive capabilities.
• Generalization and Self-Regularization.
Through extensive experiments and evaluations,
we showcase the remarkable generalization and
self-regularization capabilities of the GENUINE
network. The results showcase the network’s
capability in managing varying image appear-
ances and handling label noise during training.
This highlights its promising utility for diverse
applications within the medical diagnostics realm.
• Modeling of Label Noise. A detailed model of
label noise in the context of our automated train-
ing dataset creation for single nuclei is presented.
This descriptive modeling offers valuable insights
into the challenges and intricacies associated with
label noise, laying a foundation for the develop-
ment of robust models capable of handling such
complexities.
These contributions collectively advance the field of
deep learning in medical imaging, offering a promis-
ing avenue for the development of robust and efficient
models for single nuclei classification, with broader
implications for the diagnostics process.
ICPRAM 2024 - 13th International Conference on Pattern Recognition Applications and Methods
28

2 MATERIAL & METHODS
2.1 Network Architecture
Our two-stream network architecture has been de-
signed to extract the maximum information from
FISH images, particularly focusing on single nuclei
crops. A visual representation of the entire architec-
ture can be viewed in Figure 1. GENUINE
1
integrates
two synergistic streams: the encoder stream captures
general features of the image patch, like brightness
variations, noise and blur, while the second stream fo-
cuses on individual FISH signals, effectively isolating
them from the surrounding image context.
2.1.1 Input
The input to our architecture consists of single nuclei
crops sourced from FISH images (see Figure 1, top-
left). These cropped image patches are denoted as P,
with dimensions W × H × 3, where W and H denote
the width and height of the crops, respectively, and
the third dimension corresponds to the RGB channels.
Each nuclei is associated with a genetic label, repre-
senting its genetic aberration status, e.g. MNA (1) or
non-MNA (0).
2.1.2 Input Propagation Through the Network
Let E(·) represent the encoder stream such as ResNet-
50, B(·) represent the bounding box detection stream,
such as RetinaNet, and F(·) be the fully connected
layers of GENUINE. For a given input patch P, the
prediction ˆy is given by:
ˆy = F (Flatten(E(P, θ
E
)) ⊕ Flatten(B(P, θ
B
)), θ
F
)
where θ
E
are the parameters of the encoder stream
E(·), θ
B
are the parameters of the bounding box de-
tection stream B(·), and θ
F
are the parameters of
the fully connected layer F(·). The operator ⊕ de-
notes the concatenation of the flattened outputs from
the encoder and bounding box detection streams, and
the Flatten() function transforms its input into a one-
dimensional vector, preparing it for final classifica-
tion by the subsequent fully connected layers of GEN-
UINE.
2.2 Automated Dataset Labeling
Through Segmentation
In the realm of FISH image analysis, securing a high-
quality labeled dataset is challenging given the intri-
cacies inherent in these images. The labor-intensive
1
Implementation details can be found under:
https://github.com/SimonBon/GENUINE
nature of manual labeling, coupled with potential in-
consistencies due to human subjectivity, makes the
task even more challenging. Our aim to create an
automated dataset generation method stems from the
aspiration to offset these challenges, ensuring a more
scalable approach. However in the transition to auto-
mated labeling, the introduction of label noise is un-
avoidable in the given context.
Given a set of m FISH images, I = {I
1
, I
2
, ..., I
m
},
where each image I
i
can comprise multiple nuclei,
we aim to isolate each nucleus. This is achieved by
using a suitable segmentation technique, in our case
Cellpose, (Stringer et al., 2021) which we denote as
S(·). When applied to each image I
i
, the segmenta-
tion’s outcome, S(I
i
), yields a mask that demarcates
the nuclei.
The single nucleus masking operation is mathe-
matically denoted as:
M(I
i
) = I
i
× S(I
i
)
Here, × signifies element-wise multiplication, render-
ing the unmasked background to zero. Following this
step, we calculate the center of each nucleus based on
the segmentation mask, which enables the extraction
of individual nuclei. As a result, we obtain n individ-
ual nuclei crops. When leveraging images only con-
taining nuclei associated with a known genetic aberra-
tion status, we simultaneously generate a target label
set.
2.2.1 Introducing Label Noise
When constructing an automated labeling system, it is
inevitable that some degree of label noise will be in-
troduced due to various factors such as segmentation
inaccuracies or inherent image artifacts. This noise
can be modeled statistically.
Let L = {l
1
, l
2
, ..., l
n
} be the set of true labels for
the n single nuclei crops, where each label l
i
is binary
(representing the presence or absence of a specific ge-
netic aberration - in our case MYCN amplification).
Given that our automatic labeling method has an
associated error rate β ∈ [0; 1], where β represents the
probability of a label being flipped (i.e., mislabeled),
the noisy label l
′
i
for a given l
i
can be modeled as:
l
′
i
=
(
¬l
i
with probability β
l
i
with probability 1 − β
Thus, L
′
= {l
′
1
, l
′
2
, ..., l
′
n
} denotes the dataset labeled
with noise. In the scenario of classifying MYCN am-
plification status on individual nuclei, a higher value
of β implies that more patches with a non-MNA ap-
pearance will be labeled as MNA, and vice versa.
GENUINE: Genomic and Nucleus Information Embedding for Single Cell Genetic Alteration Classification in Microscopic Images
29
FULLY
CONNECTED
Predicted Class
Single Signal Detection
Whole Nucleus Encoding
RGB-FISH Image
Segmentation
MNAnon-MNA DAPIMYCNNMI
Bounding Boxes
GENUINE
flatten
flatten
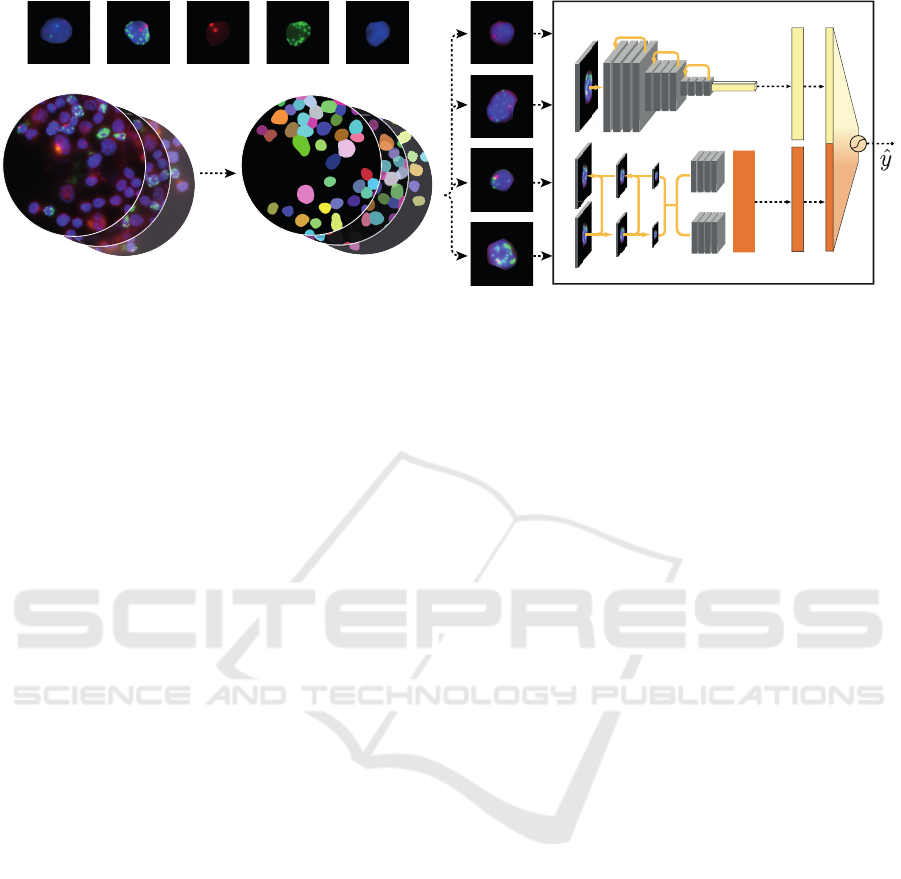
Figure 1: Visualization of the image processing pipeline. Top left: RGB image of a non-MNA and MNA patch followed by
separate image channels red: NMI, green: MYCN, blue: DAPI of the latter. Bottom Left: Illustration of the FISH image scan
and its respective segmentation into single nuclei, which are used as input into GENUINE. Right: GENUINE. The top portion
represents the encoder for the entire nucleus, while the bottom part focuses on single signal bounding box detection.
Even though the actual value of β might be un-
known, recognizing its existence and potential influ-
ence on the training of any machine learning model
is crucial. Being aware of this label noise enables the
implementation of strategies during model training to
alleviate its effects.
2.3 Synthetic Data Generation
Here, we describe the methodology employed to gen-
erate single nuclei crops, featuring various configu-
rations of MYCN signal number, sizes and positions,
which are further utilized in Section 4.3. To synthe-
size individual patches of dimensions W × H × 3, we
use original nuclei images extracting the DAPI chan-
nel (blue channel in the RGB image) from real FISH
stainings. We only use the DAPI channel which al-
lows us to manually define the number and position
of signals in the channels for NMI in red and MYCN
in green, along with their respective sizes.
Building on this foundation, potential positions
within the nucleus are identified to accommodate the
placement of signals, ensuring that the given size does
not extend over the nucleus boundary. The introduc-
tion of signals is achieved by applying a Gaussian dis-
tribution, with the standard deviation representing the
width, thereby modeling the signal size. To establish
distinct signal boundaries, all values below 0.8 of the
Gaussian maximum are set to zero.
For additional variation in appearance, an elastic
transformation controlled by parameters α and σ is
employed to dictate the level of distortion, followed
by Gaussian blurring. This approach enables the gen-
eration of diverse nuclei images with a wide range of
appearances and arbitrary signal configurations.
Detailed code for the generation can
be found in our GitHub repository under:
https://github.com/SimonBon/FISHcreation
3 EXPERIMENTAL SETUP
3.1 Training Data Generation
For our experiments, we leveraged the data genera-
tion procedure delineated in Section 2.2. From a col-
lection of FISH images taken from 2 MNA and 2 non-
MNA cell lines, we extracted a total of 50,000 nuclei
patches, ensuring an equal representation from all cell
lines. Each nucleus patch is represented by dimen-
sions P ∈ R
W ×H×3
, where W = 192, H = 192. The
assembled dataset was split into training (80%), vali-
dation (10%) and test (10%) split.
3.2 Benchmark Methods
In our experiments, we primarily focus on evaluating
the efficacy of our proposed method, GENUINE.
The GENUINE architecture leverages a ResNet50
encoder for comprehensive image content extraction
and a RetinaNet for precise single signal detection.
We compare the GENUINE architecture against two
baseline approaches:
1. A convolutional neural network approach solely
based on the ResNet50 architecture (in all tables
and figures indicated with ResNet).
2. A single signal detection approach solely using
the RetinaNet (in all tables and figures indicated
with RetinaNet), which uses only the bounding
boxes, the certainty score and the assigned classes
for classification.
ICPRAM 2024 - 13th International Conference on Pattern Recognition Applications and Methods
30

For the optimization of the RetinaNet, we employed a
manually labeled dataset consisting of 278 single nu-
clei patches. This dataset encapsulated 570 NMI (red)
signals, 1375 MYCN (green) signals, and 309 MYCN
clusters. Training was conducted using stochastic gra-
dient descent (SGD) with a learning rate of 10
−3
. The
training process was stopped early if there was no no-
ticeable reduction in validation loss over a span of 30
epochs. The weights of this trained RetinaNet were
subsequently frozen and incorporated into the GEN-
UINE architecture as its single signal detector.
Both the GENUINE model and the standalone
ResNet50 model were trained on the previously de-
tailed training and validation datasets. Their train-
ing parameters mirrored those of the RetinaNet: us-
ing SGD, a learning rate of 10
−3
, and a patience of
30 epochs for early stopping based on validation loss
improvements.
To enhance the model’s generalization capabili-
ties, we utilized data augmentations during the train-
ing of all models. The employed augmentations in-
clude random affine transformations, vertical and hor-
izontal flipping, random intensity scaling, random
channel skipping for red and blue channel, and ran-
dom noise addition.
3.3 Experiments
3.3.1 Test Split Performance
For our primary evaluation, we test our models on
the test split of our previously constructed training
dataset. This experiment aims to understand the mod-
els’ capabilities in recognizing and classifying nu-
clei patterns from the same distribution, even though
they’re unseen instances. We measure the perfor-
mance using True Negative Rate (TNR), True Positive
Rate (TPR), F1-score, and Accuracy.
3.3.2 Mixture Percentage Prediction
In a more challenging setup, we evaluate the mod-
els on entirely new and unlabeled data. The data was
extracted from images having varying percentages of
MNA nuclei: 0%, 25%, 50%, 75%, 90%, 95%, 99%,
and 100%. These percentages were created in a man-
ual manner diluting cell suspensions of MNA cells
with non-MNA cells. Each category provided 2048
patches, adhering to the same dimensions as the train-
ing dataset, i.e., 192 × 192 × 3. The images comprise
both MNA and non-MNA nuclei. While we are in-
formed of the theoretical percentage of positive nuclei
in these datasets, it’s crucial to note that there may be
a small margin of error aligning with segmentation
inaccuracies, preparation errors and label noise. This
setup is designed to test the robustness of our models
in real-world, less-controlled scenarios where single
nucleus ground truth labels might not be available.
4 RESULTS
4.1 Test Split Performance
To evaluate the performance of our model, we con-
ducted predictions on the test split (described in Sec-
tion 3.1). The measured metrics are presented in Ta-
ble 1, demonstrating the superior performance of the
ResNet approach when assessed on this test subset.
Please note that the labels in this set are automat-
ically generated based on the genetic status of the
cell line from which the cell being labeled originated,
as described in Section 2.2. The distribution statis-
tics and label noise are maintained. The metrics re-
veal nearly flawless scores across all aspects for the
ResNet, whereas the GENUINE approach exhibits a
lower true positive rate (TPR) at 88.77%. The Reti-
naNet method yields the lowest values across all met-
rics.
Table 1: Evaluation metrics for classification on the auto-
matically labeled test split. The table compares the perfor-
mance of three models: ResNet, GENUINE, and RetinaNet.
The highest values for each metric are highlighted in bold.
Metric ResNet GENUINE RetinaNet
TPR 99.10 88.77 88.47
TNR 99.65 98.98 84.96
F1-Score 99.27 93.26 83.47
Accuracy 99.44 94.99 86.33
Intrigued by these findings, we initiated a com-
prehensive visual examination, with a particular fo-
cus on the false negatives produced by the GENUINE
network. To facilitate this analysis, we delved into
the embedding space of GENUINE and its organi-
zational structure. In Figure 2, we present a visual-
ization of the GENUINE feature space encompass-
ing all samples labeled as positive by the automated
process. To reduce the dimensionality, we employed
the Uniform Manifold Approximation and Projection
(UMAP) technique (McInnes et al., 2020). We de-
cided to use UMAP, because it offers benefits over
other dimensionality reduction methods by efficiently
preserving both local and global structures of the data,
enabling faster computation, and allowing flexibil-
ity in embedding dimension and applicability to di-
verse data types. In Figure 2, GENUINE’s predic-
tions are represented through color-coding: red sig-
nifies predictions of MNA, while blue indicates non-
GENUINE: Genomic and Nucleus Information Embedding for Single Cell Genetic Alteration Classification in Microscopic Images
31
0 1 2 3
4 5 6 7
8 9 10 11
12 13 14 15
UMAP_2
UMAP_1
Positive Prediction
Negative Prediction
Selected for Panel (right)
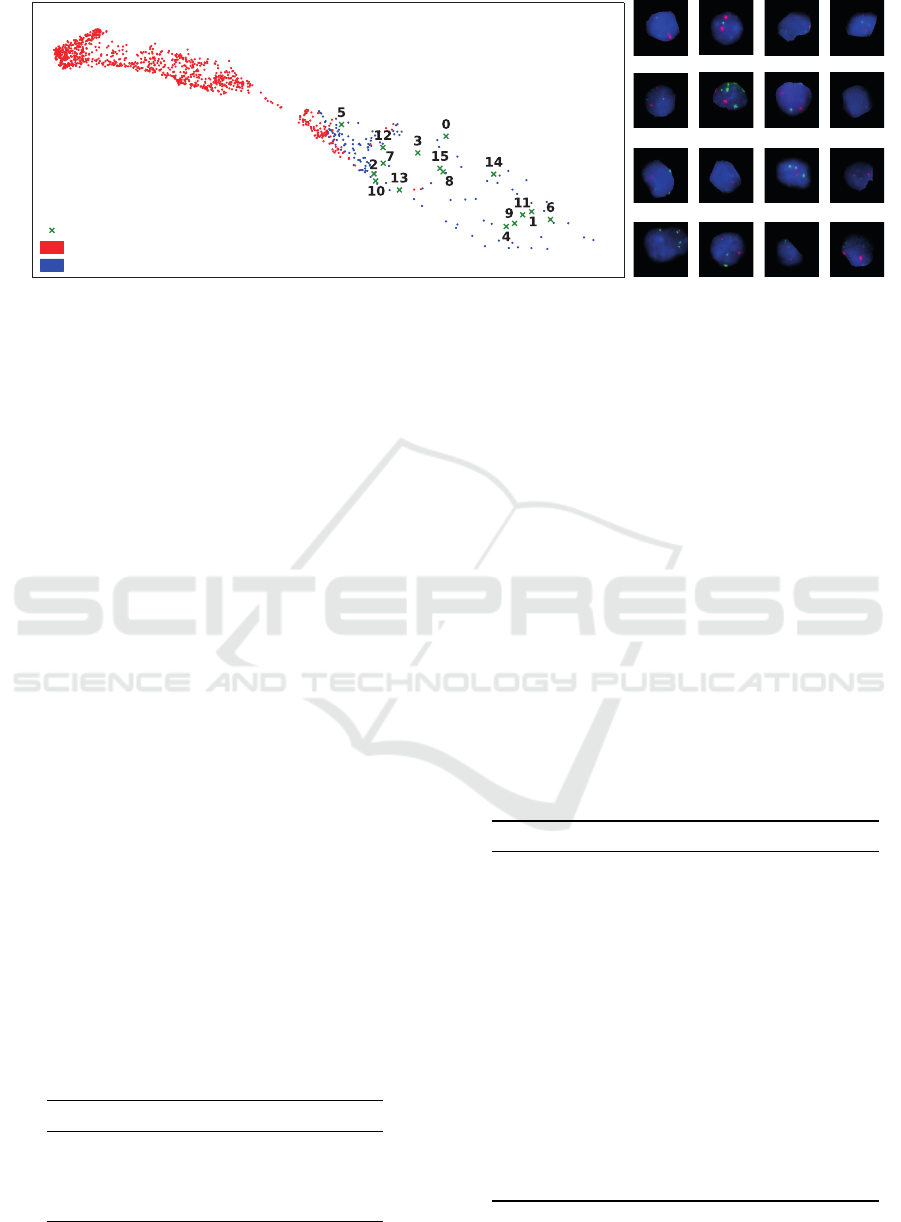
Figure 2: Visualization of single nucleus patch embeddings by the GENUINE network. On the left, the dimensionality-
reduced UMAP embedding of all positive nuclei in the automatically labeled test dataset. Corresponding patches for selected
points are displayed on the right, showcasing instances, where the automatically generated label does not match the visual
appearance, specifically MNA patches exhibiting non-MNA characteristics.
MNA predictions. This visualization underscores a
noteworthy observation: GENUINE frequently mis-
classifies nuclei that were automatically labeled MNA
as non-MNA. Nevertheless, upon closer examination
of individual nuclei patches (refer to patches 0-15
in Figure 2), it becomes evident that the GENUINE
network exhibits commendable resilience against the
label noise inherent in the automatically generated
training dataset. These patches have an MNA label,
but visually appear as non-MNA nuclei. This means,
their assigned label does not match their visual char-
acteristics. GENUINE accurately recognizes these
nuclei as non-MNA, consistent with their visual ap-
pearance, despite their noisy labels.
To obtain a more representative performance as-
sessment, we selected a subset of the test split for
manual annotations and recalculated the evaluation
metrics. Initially, when tested on the automatically
labeled nuclei, the ResNet showed the highest per-
formance across all evaluation metrics, as presented
in Table 1. However, when the evaluation was con-
ducted on a test split derived from manually annotated
nuclei, significant discrepancies emerged and GEN-
UINE shows superior performance. These revised re-
sults are presented in Table 2.
Table 2: Evaluation metrics for classification on a manu-
ally annotated subset of the test split. The table compares
the performance of three models: ResNet, GENUINE, and
RetinaNet. The highest values for each metric are high-
lighted in bold.
Metric ResNet GENUINE BB
TPR 84.07 91.01 92.59
TNR 100.00 99.56 91.25
F1-Score 91.35 95.06 91.65
Accuracy 92.35 95.45 91.89
4.2 Mixture Percentage Prediction
To assess each model’s robustness against varying im-
age scans with statistics that deviate from the train-
ing dataset, we predicted mixture ratios from multi-
ple scans. The results presented in Table 3 reveal key
differences in the performance of the ResNet model
compared to GENUINE and the RetinaNet model.
Specifically, the deviation from the target values for
mixture cell images is significantly greater for the
ResNet model, especially for samples S2 (0%), S4
(25%), and S5 (25%).
Table 3: Comparison of prediction differences for three
models: ResNet, GENUINE, and RetinaNet. The table
presents the deviation in percentages from the target value
for mixture cell images. Samples are accompanied by their
respective percentage of MNA cells. Deviations within the
range of ±10% are highlighted in bold.
Sample ResNet GENUINE RetinaNet
S1 (0%) 3.32 0.63 8.59
S2 (0%) 64.60 8.11 27.98
S3 (0%) 8.30 2.98 25.29
S4 (25%) 37.70 -0.98 -4.49
S5 (25%) 24.71 -1.12 7.42
S6 (50%) 20.61 -5.32 -1.42
S7 (50%) 21.24 -7.62 -6.25
S8 (75%) 11.28 -7.91 -7.52
S9 (75%) 20.70 -1.03 -37.65
S10 (90%) 8.10 -4.45 -50.01
S11 (90%) 0.92 -15.98 -23.59
S12 (95%) 1.53 -11.75 -15.02
S13 (95%) 2.31 -7.70 -31.87
S14 (99%) -0.12 -17.46 -24.88
S15 (99%) -0.07 -16.29 -56.76
S16 (100%) -0.10 -7.37 -46.68
S17 (100%) -0.44 -9.67 -12.06
ICPRAM 2024 - 13th International Conference on Pattern Recognition Applications and Methods
32
GENUINE
ResNet
UMAP_2
UMAP_1
UMAP_2
UMAP_1
Training Samples
Mixture Samples
Training Samples
Mixture Samples
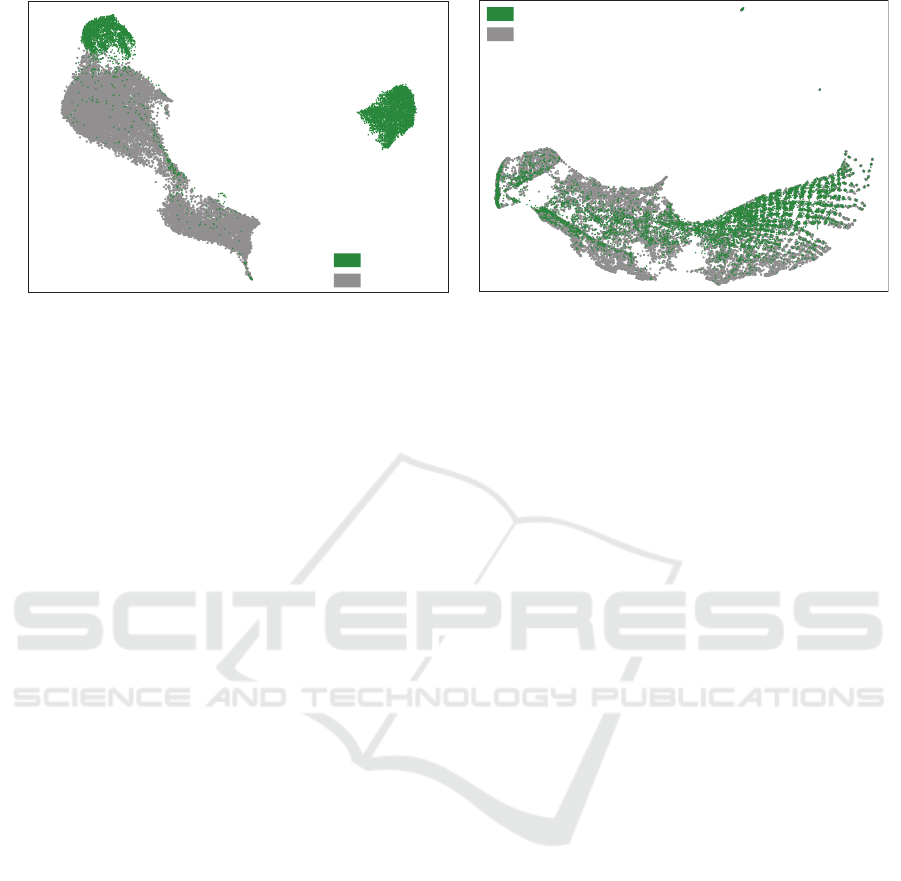
Figure 3: UMAP dimensionality-reduced embeddings of the ResNet (left) and GENUINE (right) networks from the training
data (in green) and the patches from mixture images (in grey). This visualization provides a comparative insight into the
feature spaces learned by both networks across different data sources.
The ResNet model consistently exhibits a ten-
dency to overestimate the proportions of MNA nuclei,
suggesting a bias. This observation raises concerns
about its ability to generalize effectively. In Figure 3,
we present a combined plot illustrating the embed-
dings of all nuclei crops from the training data (de-
picted in green) and those from the mixtures (depicted
in grey).
Although most of the training samples in the
ResNet embeddings are clearly distinguished, sug-
gesting potential overfitting to the training data, the
embeddings of the mixture samples do not align
closely with the training data, further supporting our
suspicion of overfitting. The mixture samples occupy
a less densely populated region within the embedding
space. This suggests that the mixture samples may
be considered as out-of-distribution data. As a result
of this misalignment, it appears that the classification
boundary in these regions is poorly calibrated, which
likely contributes to the ResNet model’s poor perfor-
mance in predicting the mixture samples and its bias
towards MNA predictions. This issue highlights a sig-
nificant limitation of the ResNet approach: its inabil-
ity to identify and adapt to label noise. This shortcom-
ing exacerbates its generalization problems, causing it
to overfit to the training data and potentially deviating
from meaningful features while striving to minimize
loss during training.
In contrast, the GENUINE model demonstrates
a more consistent performance. Notably, for sam-
ples with higher percentage of MNA nuclei percent-
ages, GENUINE seems to underpredict, likely due to
the presence of segmentation errors, containing no or
only parts of a nucleus, wherein the presence of these
patches reduce the actual percentage of MNA patches
in the sample. The embeddings of the training and
mixture data generated by the GENUINE model also
align well and occupy the same regions, suggesting
that they can be considered as in-distribution data.
This is a positive indicator of the model’s robustness
to label noise and its superior ability to generalize ef-
fectively across data variations, even in the face of
challenges such as segmentation-induced label noise.
To conclude, while the ResNet model exhibited
good performance during its training phase, its con-
sistent overestimations, inability to recognize label
noise, and poor generalization to the mixture test data
highlight its limitations. In contrast, the GENUINE
model stands out for its ability to navigate diverse data
distributions and noisy labels, underlining the impor-
tance of such resilience in real-world applications.
4.3 Analysis of the Embedding Space
Organization
Given the insights and revelations uncovered in the
previous experiments, we explore the inherent struc-
ture and organization of the embedding space more
deeply to understand the representations of individ-
ual nuclei by the network. We do this by generat-
ing artificial nuclei images, by extracting the nucleus
background from real nuclei and manually editing the
green (MYCN) and red (NMI) signal channels as de-
scribed in Section 2.3. This technique enables the ma-
nipulation of the number, spatial distribution and size
of MYCN and reference NMI signals. By controlling
these variables, we aim to dissect the intricate rela-
tionships and dependencies that exist within the em-
bedding space, thereby gaining a clearer comprehen-
sion of how the network represents individual nuclei.
This approach not only grants a granular view of the
representation, but also empowers us to simulate vari-
ous scenarios and conditions to observe the network’s
GENUINE: Genomic and Nucleus Information Embedding for Single Cell Genetic Alteration Classification in Microscopic Images
33

adaptability and response to different configurations
of MYCN and NMI signals.
In the initial experiment, the count of both MYCN
and NMI signals was fixed at two. Subsequent varia-
tions were introduced to the size of the MYCN signals,
in addition to modifications in their appearance facil-
itated through elastic transformations. In contrast, the
subsequent experiment maintained a constant signal
size, while the quantity of MYCN signals per nucleus
was varied, ranging from 0 to 35. Each experimental
condition generated 50 nuclei, in the following ref-
ered to as a batch, for every distinct signal size and
numerical configuration, with the location of the sig-
nals inside the nucleus being randomized potentially
leading to signal overlap.
Subsequent to these delineated configurations, ev-
ery batch of 50 nuclei was embedded via the GEN-
UINE network, followed by dimensionality reduction
through UMAP. This approach facilitated the compu-
tation of a mean position, of each batch, in both the
UMAP 1 and UMAP 2 axes, concurrently determin-
ing the associated standard deviation and calculating
GENUINE’s mean prediction. The term ”mean pre-
diction” in this context denotes the average predicted
label. For binary classification, wherein ˆy = 0 sig-
nifies non-MNA and ˆy = 1 denotes MNA prediction,
the mean prediction is mathematically represented as
¯y =
1
N
∑
N
n=0
ˆy
n
, with the range of ¯y lying within [0, 1]
and N equating to 50 in our specific scenario. The
results of both experiments are shown in Figure 4,
with panel A showing the results for varying signal
size and panel B showing the results for varying sig-
nal number.
The analysis of the given plots indicates a near lin-
ear organization within the feature space, with dis-
tinct areas correlating to specific signal number or
size configurations. This organization showcases the
GENUINE network’s potential for interpreting and
categorizing nuclei variations, enhancing its inter-
pretability. Essentially, GENUINE demonstrates the
ability to recognize subtle differences in input and
strategically position similar features closer in the em-
bedding space, thereby showcasing strong nuclei rep-
resentations. This characteristic strengthens the use-
fulness of the model, especially in real-world contexts
characterized by a large data variations and the need
for interpretable predictions.
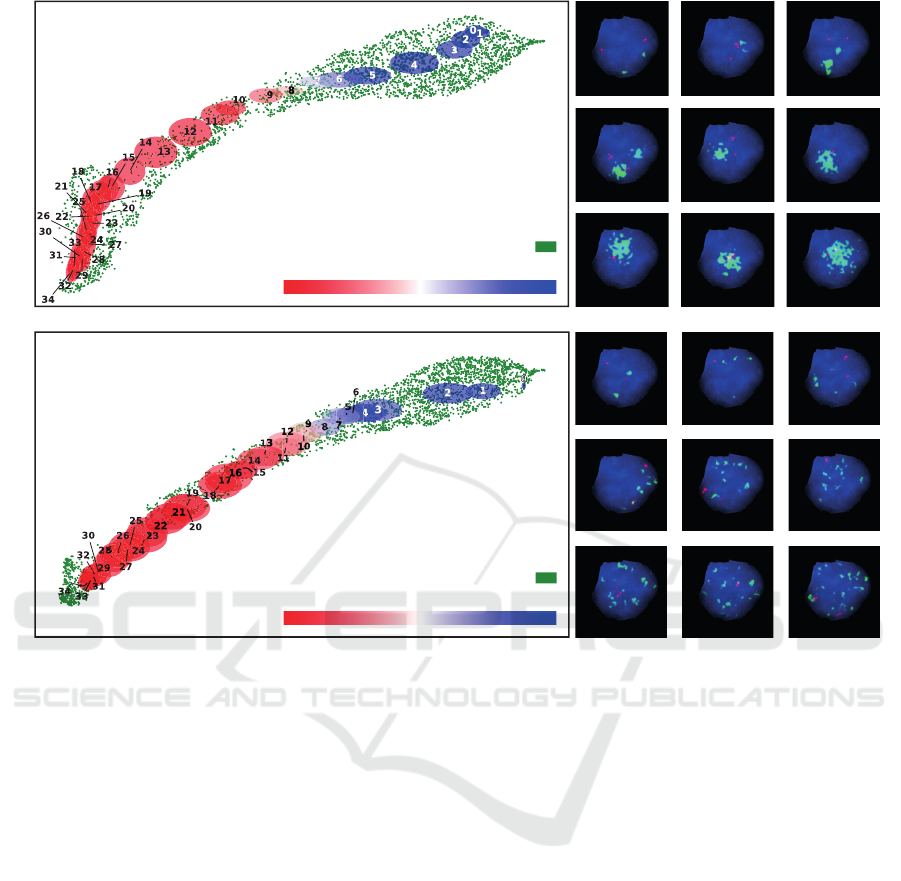
In Panel A of Figure 4, it is evident that GEN-
UINE classifies patches with larger signal sizes as
MNA, inferring that it perceives larger signals as clus-
tered MYCN signals. Notably, for signal sizes 7 and 8,
the network’s predictions average around 0.5, high-
lighting the ambiguity and difficulty in interpretation
for these instances, as they could be interpreted as sin-
gle or clustered signals.
Panel B in Figure 4 underscores how GENUINE
can seamlessly integrate a conventional classification
guideline into its predictive framework, all without
requiring explicit prior instructions about this crite-
rion. The criteria defines that a nucleus is classified
as MNA when the number of MYCN signal equals
or exceeds four times the NMI signals (Cohn et al.,
2009). Since we preset the number of NMI signals
to 2, we can expect the transition from non-MNA to
occur as the MYCN signal number increases from 7
to 8. This transition becomes quite evident as we ob-
serve a distinct shift from predominantly non-MNA
predictions to predominantly MNA predictions. This
shift is visually represented by the transition in colors
from blue to red in Figure 4, especially as the num-
ber of MYCN signals changes from 7 or 8 to 9. This
illustrates GENUINE’s proficiency in intuitively rec-
ognizing and applying complex classification param-
eters.
5 DISCUSSION AND OUTLOOK
Our study brought forth several insightful aspects of
the models evaluated. Firstly, the ResNet demon-
strated the ability to almost perfectly separate the
training dataset, even in the presence of label noise,
as indicated by (Graf et al., 2021). This ability show-
cased its capabilities in dealing with intrinsic com-
plexities and variations, but it also raised questions
about potential overfitting. In contrast, the GENUINE
model could not separate the training dataset as ef-
fectively as the CNN, but this seemingly less perfect
separation resulted in better generalization due to its
architecture and method design.
An important highlight of our approach is that
it requires minimal annotations for the single signal
detection model in the second stream. Future work
should consider exploring automated annotation tech-
niques or unsupervised learning methods for the sig-
nal detection that can harness the vast amounts of un-
labeled data. Leveraging this diversity of data could
potentially lead to an even more robust single signal
detection and therefore more robust diagnostic classi-
fication.
Furthermore, GENUINE’s generalization abilities
extend beyond MNA detection, offering a promising
path for its application in other FISH tasks like iden-
tifying gains, deletions, or translocations. This adapt-
ability can significantly aid the diagnostic process by
offering a versatile tool that requires minimal inter-
vention, thus enhancing the overall efficiency and ef-
ficacy of diagnostics.
ICPRAM 2024 - 13th International Conference on Pattern Recognition Applications and Methods
34
A
B
Lorem ipsum
2 6 10
14 18 22
26 30
34
2 4 6
8 10 16
22 28 34
1 00.5
1 00.5
mean prediction
mean prediction
UMAP_1
UMAP_2
UMAP_1
UMAP_2
Training Samples
Training Samples
Figure 4: Visualization of the embedding space for synthetically generated nuclei patches in GENUINE, employing UMAP
for dimensionality reduction. Each point displayed in green resembles the embedding of a patch from the training dataset.
A Depicts the embedding of nuclei patches as the signal size increases. Annotated ellipses group together nuclei patches
exhibiting same signal size. Adjacent to this visualization, representative samples of the synthetic nuclei are showcased, with
accompanying numbers denoting the size of the green signals. B Illustrates the embedding of nuclei patches, showcasing
variations in the number of signals. The number within each ellipse and the adjacent panel specifies the count of green signals
in the synthesized nucleus patch. The ellipse color corresponds to GENUINEs mean prediction across all 50 patches under
the same condition, as indicated by the colorbar.
Lastly, an avenue for further studies could be the
investigation of uncertainty estimation. The classifi-
cation of FISH images is not always straightforward
and objectively solvable, given the inherent variabil-
ity and complexity of biological samples. Incorpo-
rating uncertainty could provide a more nuanced and
adaptable approach, allowing for more informed and
reliable classifications and diagnostic conclusions.
In conclusion, this study serves as a foundational
exploration into the capabilities and potential of dif-
ferent models in the classification of FISH images.
The insights gained offer promising directions for fu-
ture research, emphasizing the need for adaptability,
robustness, and versatility in model design, with the
overarching aim of advancing the reliability and ac-
curacy of diagnostic processes through computational
models.
6 CONCLUSION
This comprehensive study set out to evaluate the per-
formance of various models, with a particular empha-
sis on the CNN-based ResNet and GENUINE mod-
els, in the context of nucleus classification tasks. A
series of intricate experiments and analyses yielded
nuanced insights into the strengths and limitations of
each model, underscoring the vital considerations for
practical deployment in real-world applications.
The initial results, obtained from the automati-
cally labeled test split, showcased the ResNet model’s
superior performance. However, a deeper dive and a
subsequent evaluation on a manually annotated subset
of the test split unveiled the limitations of the ResNet
model. It exhibited a pronounced inability to recog-
nize and adapt to label noise, along with challenges
GENUINE: Genomic and Nucleus Information Embedding for Single Cell Genetic Alteration Classification in Microscopic Images
35

in generalizing to unseen data. These shortcomings
manifested in consistent overestimations and skewed
predictions, highlighting potential pitfalls for its ap-
plication in complex real-world settings.
In contrast, the GENUINE model emerged as
more versatile and resilient. Its commendable ro-
bustness against label noise and consistent perfor-
mance across diverse data distributions were partic-
ularly noteworthy. The model demonstrated its abil-
ity to tackle the challenges posed by induced label
noise and showcased its ability to underpin even in
the presence of varied and complex data inputs. The
GENUINE model’s adaptability was further affirmed
by its organized representation of artificially created
nuclei in the feature space, elucidating its capabilities
in robust representation learning and interpretability.
Moreover, the visual analyses and the exploration
of the embedding space organization provided invalu-
able insights into the inner workings of the GEN-
UINE network. The observed organization in the fea-
ture space, indicative of the model’s ability to discern
subtle differences in input and map similar features
closely, reinforced GENUINE’s potential as a power-
ful tool in FISH classification tasks. The clear and
consistent mapping of features, even under variations
in singal size and number, confirmed the model’s ca-
pacity to build meaningful and robust representations,
highlighting its utility in complex scenarios.
In the future, deepening the development of
leveraging unlabeled data and uncertainty assess-
ment methods will help improve the reliability and
adaptability of the model in diagnostic environments,
thereby promoting more harmonious and effective in-
tegration with human interventions in medical diag-
noses.
REFERENCES
Bahry, E., Breimann, L., Zouinkhi, M., Epstein, L., Koly-
vanov, K., Long, X., Harrington, K. I. S., Lionnet, T.,
and Preibisch, S. (2021). Rs-fish: Precise, interactive,
fast, and scalable fish spot detection. bioRxiv, page
2021.03.09.434205.
Bouilhol, E., Lefevre, E., Dartigues, B., Brackin, R.,
Savulescu, A. F., and Nikolski, M. (2021). Deepspot:
a deep neural network for rna spot enhancement in sm-
fish microscopy images.
Chrzanowska, N. M., Kowalewski, J., and Lewandowska,
M. A. (2020). Use of fluorescence in situ hybridiza-
tion (fish) in diagnosis and tailored therapies in solid
tumors.
Cohn, S. L., Pearson, A. D. J., London, W. B., Monclair, T.,
Ambros, P. F., Brodeur, G. M., Faldum, A., Hero, B.,
Iehara, T., Machin, D., Mosseri, V., Simon, T., Gar-
aventa, A., Castel, V., and Matthay, K. K. (2009). The
international neuroblastoma risk group (inrg) classifi-
cation system: An inrg task force report. Journal of
Clinical Oncology.
Graf, F., Hofer, C. D., Niethammer, M., and Kwitt, R.
(2021). Dissecting supervised contrastive learning.
Gudla, P. R., Nakayama, K., Pegoraro, G., and Misteli,
T. (2017). Spotlearn: Convolutional neural network
for detection of fluorescence in situ hybridization
(fish) signals in high-throughput imaging approaches.
Cold Spring Harbor symposia on quantitative biol-
ogy, 82:57–70.
He, K., Zhang, X., Ren, S., and Sun, J. (2015). Deep resid-
ual learning for image recognition. Proceedings of the
IEEE Computer Society Conference on Computer Vi-
sion and Pattern Recognition, 2016-December:770–
778.
Huang, M. and Weiss, W. A. (2013). Neuroblastoma and
mycn. Cold Spring Harbor Perspectives in Medicine,
3.
Lin, T. Y., Goyal, P., Girshick, R., He, K., and Dollar, P.
(2017). Focal loss for dense object detection. IEEE
Transactions on Pattern Analysis and Machine Intel-
ligence, 42:318–327.
Litjens, G., Kooi, T., Bejnordi, B. E., Setio, A. A. A.,
Ciompi, F., Ghafoorian, M., van der Laak, J. A., van
Ginneken, B., and S
´
anchez, C. I. (2017). A survey
on deep learning in medical image analysis. Medical
Image Analysis, 42:60–88.
Mathew, P., Valentine, M. B., Bowman, L. C., Rowe, S. T.,
Nash, M. B., Valentine, V. A., Cohn, S. L., Castle-
berry, R. P., Brodeur, G. M., and Look, A. T. (2001).
Detection of mycn gene amplification in neuroblas-
toma by fluorescence in situ hybridization: a pediatric
oncology group study. Neoplasia (New York, N.Y.),
3:105–109.
McInnes, L., Healy, J., and Melville, J. (2020). Umap:
Uniform manifold approximation and projection for
dimension reduction. arXiv:1802.03426 [cs, stat].
Comment: Reference implementation available at
http://github.com/lmcinnes/umap.
Otte, J., Dyberg, C., Pepich, A., and Johnsen, J. I. (2021).
Mycn function in neuroblastoma development.
Pinkel, D., Straume, T., and Gray, J. W. (1986). Cytogenetic
analysis using quantitative, high-sensitivity, fluores-
cence hybridization (in situ hybridization/biotin label-
ing/hybrid cells/chromosome-specific staining).
Sadr, A. V., Vos, E. E., Bassett, B. A., Hosenie, Z., Oozeer,
N., and Lochner, M. (2018). Deepsource: Point source
detection using deep learning.
Stringer, C., Michaelos, M., and Pachitariu, M. (2021).
Cellpose: a generalist algorithm for cellular segmen-
tation. page 17.
Zakrzewski, F., de Back, W., Weigert, M., Wenke, T.,
Zeugner, S., Roeder, I., Aust, D., Baretton, G., and
H
¨
onscheid, P. (2019). Automated detection of the
her2 gene amplification status in fluorescence in situ
hybridization images for the diagnostics of cancer tis-
sues. Scientific Reports, 9.
ICPRAM 2024 - 13th International Conference on Pattern Recognition Applications and Methods
36
