
Evaluating Blink Rate as a Dynamic Indicator of Mental Workload in
a Flight Simulator
Simon Schwerd
a
and Axel Schulte
b
Institute of Flight Systems, University of the Bundeswehr Munich, Germany
Keywords: Blink Rate, Mental Workload, Flight Simulato.
Abstract: This study assesses blink rate as a potential indicator for mental workload (MWL) in a dual task scenario in
a flight simulator. Prior research indicated that blink rate decreases as mental workload increases across
various tasks and domains. In our study, we aimed to determine if these findings are consistent in a dual task
environment within a fast jet simulator. Furthermore, we evaluated blink rate fluctuations caused by the
dynamic shifts in MWL as tasks are executed, switched, or completed. To investigate this, we executed a
flight simulator experiment involving ten participants. They were tasked with two distinct activities: first,
classifying air and ground targets, and second, maintaining a specific flight altitude. The results validated that
blink rate decreases with increasing task difficulty. However, when a secondary task imposes significant
workload, blink rates did not reliably indicate the primary task's difficulty. We also found that the timing of
spontaneous blinks was influenced by task completion and switches. Specifically, blink rates surged
immediately after decision-making points and during transitions between tasks.
1 INTRODUCTION
In recent years, there has been growing interest in
measuring cognitive states, especially when humans
control dynamic systems. Accurate assessment of
these states not only provides insights into human-
machine performance but also offers new possibilities
for enhancing human-machine interface (Feigh et al.,
2012). For example, displays or assistance systems
that adjust to their users’ cognitive state could
improve interaction and promote a cooperative
relationship between users and machines.
A central focus of this research is the concept of
mental workload (MWL). It can be described as the
extent to which a limited set of cognitive resources
are engaged over time while processing a task (for a
full explanation, see Longo et al. (2022)).
Understanding MWL is crucial because it directly
affects human performance, especially in tasks that
require continuous attention. In the context of
adaptive systems, MWL measurements were
successfully applied in assisting users based on their
workload level (Brand & Schulte, 2021; Hajek et al.,
2013).
a
https://orcid.org/0000-0001-6950-2226
b
https://orcid.org/0000-0001-9445-6911
Rather than relying on user feedback, MWL can
be objectively gauged using physiological sensors.
This subject has been extensively researched using
various metrics, including heart rate, pupil dilation,
and EEG alpha waves (Ayres et al., 2021; Charles &
Nixon, 2019). Of these metrics, blink rate (BR) has
emerged as an effective measure due to its balance
between simplicity of measurement and sensitivity to
MWL, as reported by several studies (Da Tao et al.,
2019). Compared to more complex sensors such (e.g.,
fNIRS, EEG), BR can be easily obtained with a basic
camera and image processing. In the following
section, we review relevant studies dealing with the
relationship between BR and MWL.
1.1 Blink Rate and MWL
In an early study, Holland and Tarlow (1972)
demonstrated in a memory and mental arithmetic test
that blink rate decreased with increasing task
difficulty. Interestingly, they observed that BR
increased before participants made mistakes.
Boehm-Davis et al. (2000) showed in a simulated
radar track classification task that blink rate decreased
362
Schwerd, S. and Schulte, A.
Evaluating Blink Rate as a Dynamic Indicator of Mental Workload in a Flight Simulator.
DOI: 10.5220/0012319100003660
Paper published under CC license (CC BY-NC-ND 4.0)
In Proceedings of the 19th International Joint Conference on Computer Vision, Imaging and Computer Graphics Theory and Applications (VISIGRAPP 2024) - Volume 1: GRAPP, HUCAPP
and IVAPP, pages 362-368
ISBN: 978-989-758-679-8; ISSN: 2184-4321
Proceedings Copyright © 2024 by SCITEPRESS – Science and Technology Publications, Lda.

in a time frame of 1.5s before a classification event
compared to a baseline. This suggested that blink rate
rebounds after high MWL situations and could also
be an indicator of task progress.
Faure et al. (2016) reported in a driving task
experiment that blink frequency decreased with
increasing task load of the primary driving task but
within a fixed driving task difficulty, the addition of
auditory secondary tasks increased blink frequency.
Therefore, it is not clear if blink frequency is only
sensitive to tasks with visual demands.
In addition, there are some challenges when using
blink rate as an indicator for MWL. First, blinks are
not continuous signals, which complicates processing
(Cho, 2021; Siegle et al., 2008). Second, blink rate
was also reported as an indicator of fatigue and time
on task, which could be a confounding factor for
MWL measurement (Maffei & Angrilli, 2018; Stern
et al., 1994). However, it could also be argued that
blink rate does not measure MWL but rather
activation and engagement in a visual task which
happens to correlate well with performance and
reported MWL in visual tasks.
1.2 Contributions
In this study, we aimed to evaluate if blink rate for
MWL measurement is applicable to adaptive systems
in a cockpit environment. This entails the following
research questions:
What is the general relationship between BR
and MWL in single and dual visual task settings?
Based on the results of other studies, we expect
BR to be sensitive to MWL in a cockpit task
environment. However, no reviewed study has tested
the relationship between MWL and blink rate in a
dual task setting with two visual tasks. Since most
cockpit tasks are visual, we aim to evaluate (1) the
sensitivity of BR as a MWL measurement and (2) if
the BR-MWL correlation still holds in single
compared to a dual task setting.
Can blink rate be associated with changing
MWL due to task progress? We evaluate if the
timing of spontaneous blinks is related to the
dynamics of the task environment and associated
changes in MWL. Boehm-Davis et al. (2000) reported
that, in a single-task experiment, blink rate rebounds
after a task has been completed. Therefore, we would
expect to observe a fluctuating BR during task
execution, such as rebounds after task completion or
at switching between two tasks. If there is a valid
relationship, this could be used to improve the timing
of adaptations in adaptive systems, which is difficult
to determine. Adaptations at the wrong moment can
heavily disrupt the workflow of the user. Also,
physiological measures with high time constants
(measures that react slowly to changes in the task
environment, e.g., heart rate) can not provide
cognitive state estimation in a timely manner.
To address these questions, we conducted a flight
simulator study. In the following, we describe the
experimental design and subsequently discuss our
results.
2 EXPERIMENT
The experiment was conducted in a research fighter
jet simulator at the HuMiCS Lab (“Humans,
Missions, and Cognitive Systems Laboratory”) of the
University of the Bundeswehr in Munich (see Figure
1). The experimental design was inspired by an early
study by Boehm-Davis et al. (2000) and transferred
into a military aviation domain. Furthermore, we
added a secondary task condition to evaluate our
research questions.
Figure 1: Jet simulator cockpit at the HuMiCS Lab. Setup
consists of a throttle, stick, three touch display and a
projected outside view with a head-up display overlay.
2.1 Design
We created a 2x2x2 design with the following
conditions:
Primary Task Type. In the first task type (T1),
participants classified air tracks based on altitude and
velocity as hostile versus not hostile (see Figure 2).
Participants had a decision matrix that indicated high
speed and high altitude to be hostile, while all other
combinations should be classified as not hostile. The
second task type (T2) was the classification of ground
targets based on incoming sensor images. Images of
military vehicles should be classified as hostile as
Evaluating Blink Rate as a Dynamic Indicator of Mental Workload in a Flight Simulator
363
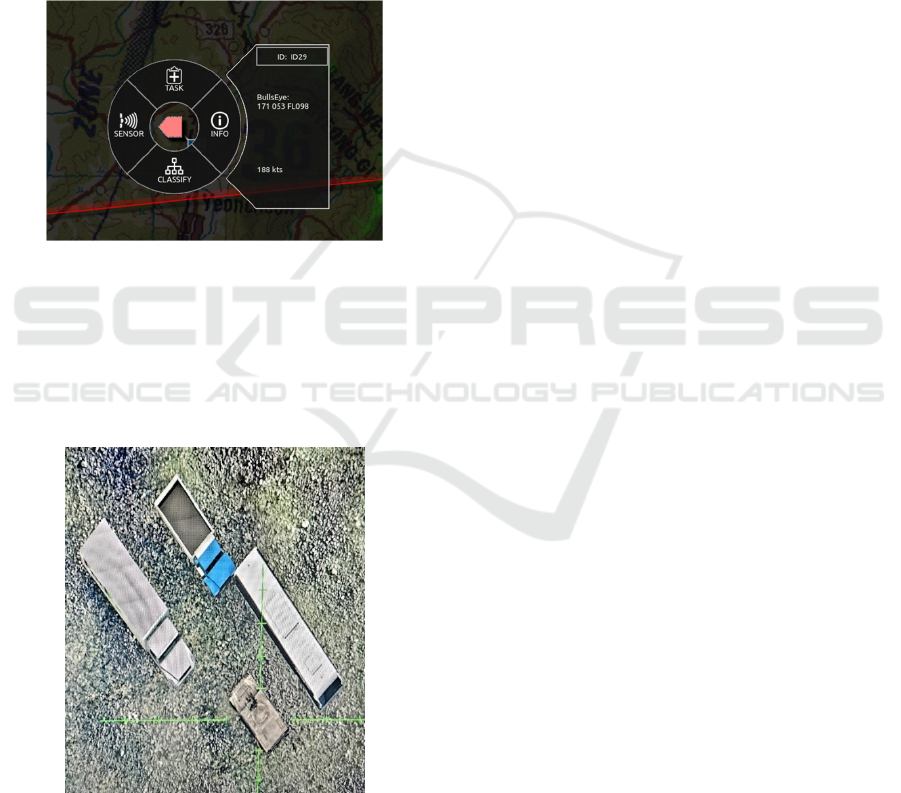
opposed to civilian vehicles (see Figure 3 for an
example).
Primary Task Difficulty. Difficulty was varied
by the ambiguity of the targets. At low difficulty
(Low), target classes could be easily identified, e.g., a
single tank on the sensor image in T1 or instant high
speed and high altitude in T2. At high difficulty
(High), target classes were ambiguous, and sensor
data were cluttered by distractors, e.g., multiple
different vehicles on the sensor data and accelerating
air targets in speed and altitude. Note that the
difficulty was only varied by how easily a target could
be classified and not by a higher number of targets.
Figure 2: Display for air track classification in T1.
Secondary Task Present. As a secondary task,
participants were asked to fly a fighter jet at a
specified altitude of 4000ft MSL. The primary task
was briefed to be more important than the secondary
task. There were two conditions: Secondary task
present (Dual-Task, DT) or absent (Single-Task, ST).
Figure 3: Sensor Picture for T2 with high difficulty
containing several different vehicles.
2.2 Participants & Procedure
Ten participants took part in the study (1 female,
mean age=24.5y). All participants were students of
aerospace-related studies at the University of the
Bundeswehr in Munich but had no prior experience
in flying with the used research simulator. At the
beginning, participants were briefed about the
experimental procedure and provided their consent
with data collection in written form.
After that, eye-tracking cameras for blink
detection were adjusted and calibrated using a
standard point calibration procedure. Then, the
participants conducted two training missions
encountering task types T1 and T2 at both levels of
difficulty. In the third training mission, the secondary
task was trained without any other task present.
Participants were encouraged to ask questions during
training since no questions were allowed in the
subsequent experimental tasks. In total, each training
mission lasted 15 minutes.
After training, the experimental tasks were
conducted in sequence. After each mission,
participants were asked to fill out a NASA-TLX
questionnaire. Order of conditions was randomized
and different for each participant to compensate both
effects of training and fatigue influence. The Total
duration of the experiment was approximately 2
hours.
2.3 Data Analysis
During the missions, we logged the following data:
Gaze Tracking. We measured gaze with a
commercial camera-based eye-tracking system
(SmartEye 4-camera system, 0.3 MP). The system
measures at a frequency of 60 Hz and classifies gaze
samples into either fixation, saccade, or blink. For this
study, blinks were analyzed in post-processing.
Saccades were used to measure gaze switches
between cockpit displays and outside windows.
Subjective Workload. Participants answered a
simplified NASA-TLX to report subjective workload.
In the simplified NASA-TLX, no weights are
assigned to the different dimensions.
Task Progress. Time points of classification
were logged when participants pressed the
corresponding button in the cockpit. Time points of
task switches were logged in the DT condition when
participants gaze switched from inside the cockpit to
outside.
The data were analyzed using Python Pandas. The
plots were generated using the Seaborn library and
HUCAPP 2024 - 8th International Conference on Human Computer Interaction Theory and Applications
364
error bars always indicate the standard deviation
divided by the square root of the sample size
3
.
3 RESULTS
We first evaluate the general relationship between
blink rate and MWL and proceed to compare ST to
DT conditions. Then, we present the results on the
relationship between blink rate and task situations.
3.1 Blink Rate, Task Difficulty and
Mental Workload
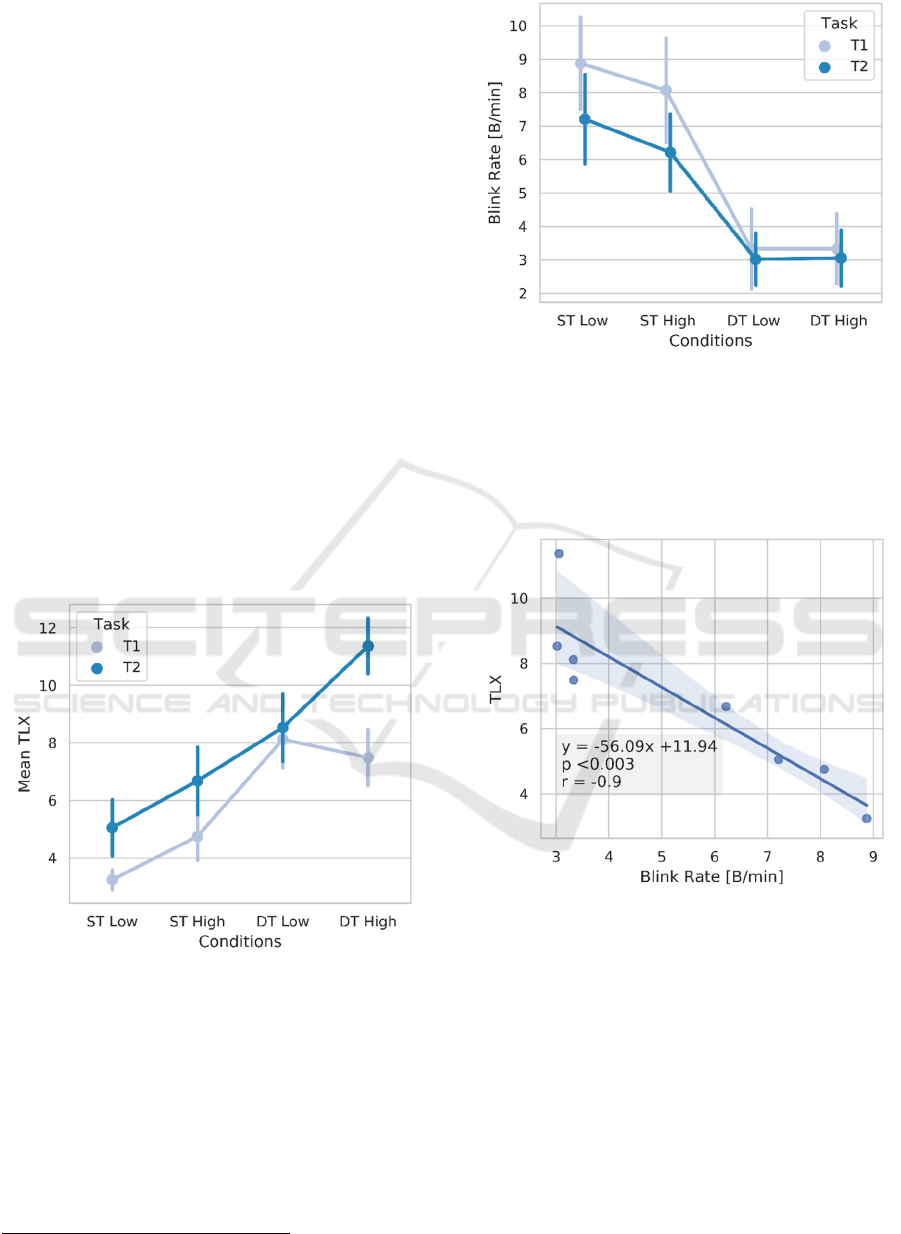
Figure 4 shows the participants’ subjective rating of
MWL via the NASA-TLX questionnaire across all
experimental conditions. The figure displays the non-
weighted mean values of all TLX dimensions for each
participant, with error bars. In general, the task
difficulty aligns well with the experimental design,
with exception from the “DT High” condition for the
air track classification task (T1), which was rated as
causing a lower workload than the “DT Low”
condition. Generally, participants reported lower
MWL in the air track task T1.
Figure 4: Mean NASA-TLX results over all conditions.
Figure 5 shows the mean BR (average blink rate
per mission) across all conditions (n=10 per
condition). The mean blink rate dropped considerably
when comparing ST to DT conditions in both task
types, T1 and T2. The primary task difficulty slightly
reduced mean BR within ST (T1: -0.8, T2: -0.99), but
there was no change within DT conditions.
3
https://seaborn.pydata.org/tutorial/error_bars.html
Figure 5: Mean BR over experimental conditions.
The correlation between reported MWL and blink
rate is displayed in Figure 6, and shows a strong
negative correlation (r = -0.9, p < 0.003) between
mean NASA-TLX scores and mean blink rate in each
experimental condition.
Figure 6: Regression plot of mean subjective MWL rating
versus blink rate. Data points refer to the mean of one
experimental condition over all participants.
These results indicate that there is a negative
correlation between mean BR and workload. Since
the study only had 10 participants, we also analyzed
the BR for each participant across the experimental
conditions, which is shown in Figure 7 containing the
individual mean BR per trial.
Evaluating Blink Rate as a Dynamic Indicator of Mental Workload in a Flight Simulator
365
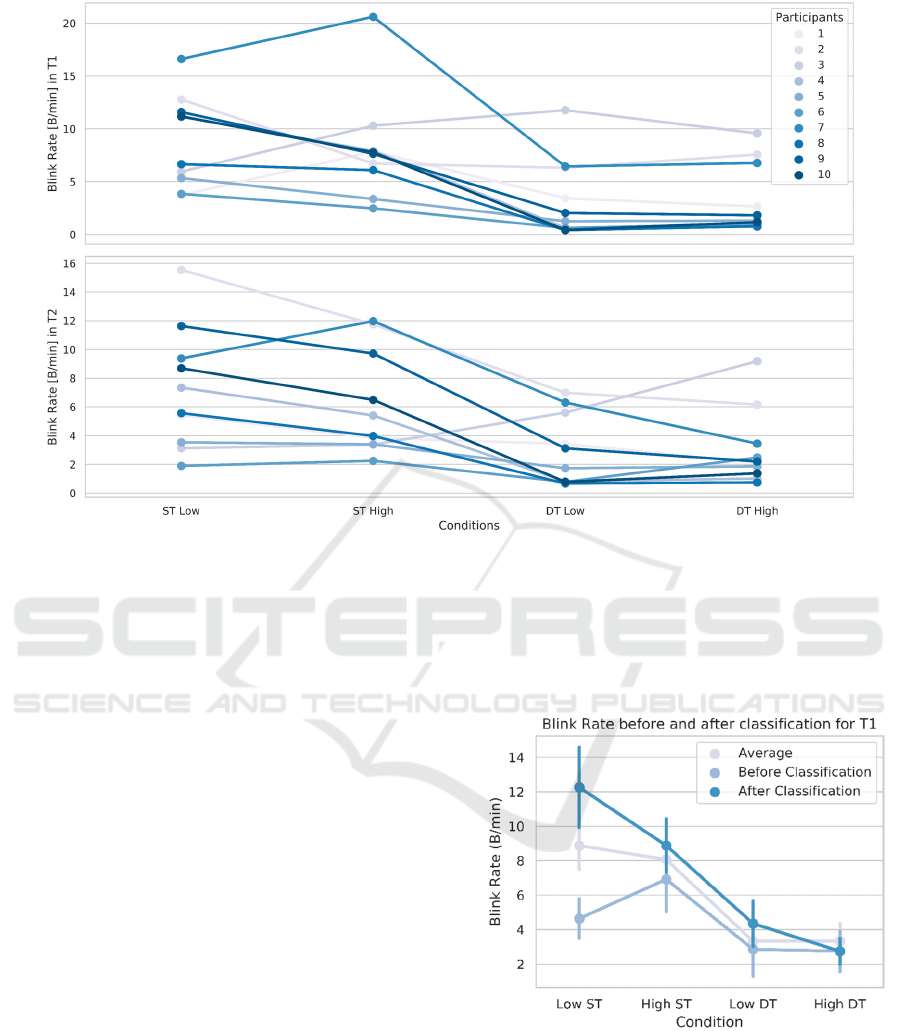
Figure 7: Individual BR in T1 and T2 of all participants.
The mean BR values in the low difficulty
conditions vary greatly among individuals from 2 to
almost 16 blinks per minute. This variance is
decreasing with increasing difficulty. A second
observation is that the change in BR is not consistent
for each participant. There is one outlier (P3) who has
an inverse relationship between BR and task
difficulty in T2. Another outlier is P7, whose BR
change “Low” and “High” difficulty in the ST
condition is also inverse compared with the expected
trend. Although, the data of these two participants is
not clear, all other participants show the expected
relationship between the mean values of BR and
MWL.
3.2 Dynamic Changes of MWL
Our second investigation focused on how BR and
changing MWL due to task progress (e.g., task
completion) are associated. For this, we chose to
analyze two distinct time points. We start with
classification events, during which participants
assigned an ID to targets by pressing a button on the
cockpit interface.
Figure 8 and Figure 9 show a comparison of
different blink rates for each condition in both tasks.
“Average” represents the mean overall BR, which
was already discussed in the previous section. As a
relevant event, we chose the moment of classifying a
target as hostile or not-hostile. Based on this, we
computed blink rate for the following time frames: 5
seconds preceding classification (“Before
Classification”) and 5 seconds post-classification
(“After Classification”).
Figure 8: Comparison of average BR to BR in timeframes
near classification (t±5s) in the air track task T1.
The results in the Low ST condition for Task T1
(see Figure 8) indicate that there is a large difference
in blink rate before and after classification, which
confirms the results from Boehm-Davis et al. (2000).
However, the BR in the other three conditions shows
that this difference decreases as overall task difficulty
HUCAPP 2024 - 8th International Conference on Human Computer Interaction Theory and Applications
366
increases. In the High DT condition, there is no
difference in BR before and after classification.
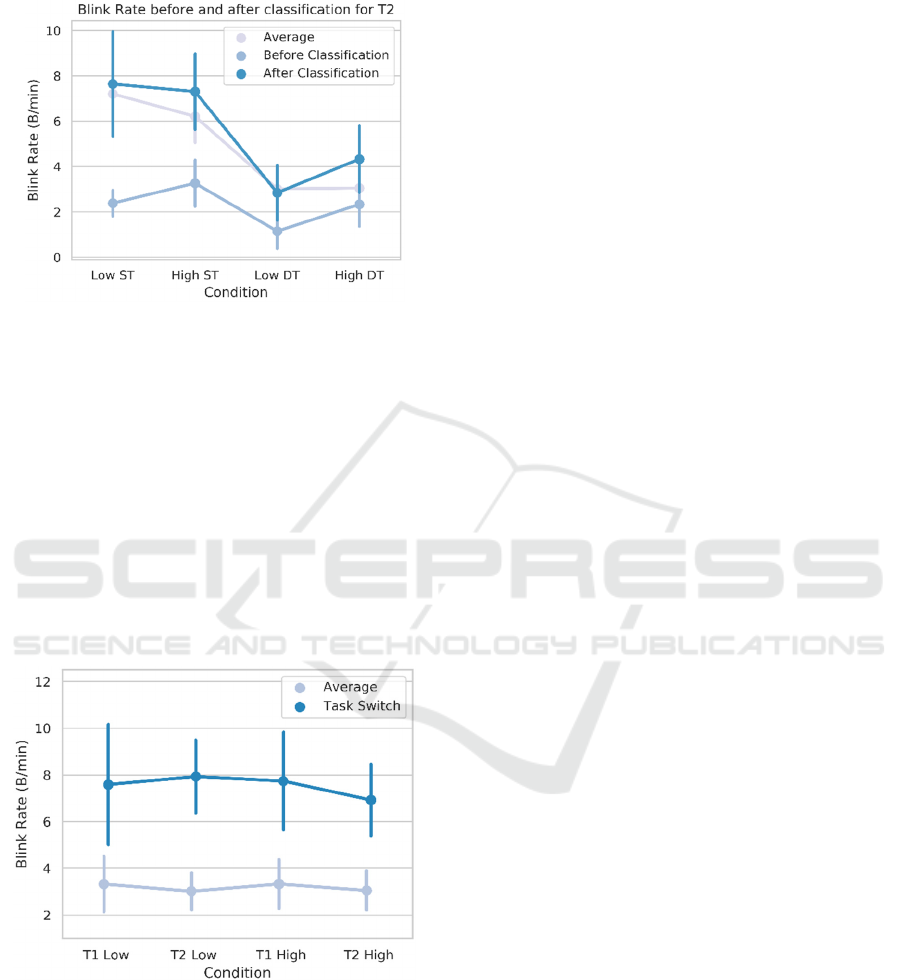
Figure 9: Comparison of average BR to BR in timeframes
near classification (t±5s) in the ground track task T2.
In task T2 (see Figure 9), the difference in time
before and after a classification exists in all
conditions, but it also decreases with increasing task
difficulty and the presence of a secondary task.
Secondly, we conducted an analysis for task
switches in the dual task scenario. The time of a task
switch 𝑡
was defined as the moment the
participants’ saccades between cockpit screen and the
outside view. We used this switch of focus to identify
the current task. Outside view was associated with the
altitude tracking task while focus on the cockpit
screen was linked to the primary task.
Figure 10: Comparison of average BR to BR in timeframes
near task switch (𝑡1𝑠) in all DT conditions.
Figure 10 shows the average blink rate in the
vicinity of a task switch (time frame 1𝑠, compared
to the cumulative average blink rate throughout each
trial. The data underscore that blinks are frequent
during task transitions, supporting the notion that
blinks predominantly occur post-task completion or
during switches.
3.3 Discussion
In the following, we discuss our general findings and
the limitations of our experiment.
3.3.1 General Findings
The results from the experiment confirmed the
findings of the reviewed studies: blink rate decreases
with increasing task load. The strongest effects were
observed when comparing ST and DT scenarios.
Within the DT settings, BR did not reflect the
changing difficulty of the primary task. This suggests
that there is a limit to the sensitivity in cases where
the visual task load is high and participants’ blink rate
does not decrease further. It remains an open question
whether this corresponds to a MWL limit in visual
tasks. Individual BR data also showed that baseline
BR is different among participants. Therefore,
individual calibration should be considered for the
design of robust measurement systems.
BR also showed effects regarding the dynamic
changes of MWL due to task progress. In the low
difficulty ST conditions of T1 and T2, there was a
large difference between average blink rate before
and after a classification event. Similarly, BR was
significantly higher within a short time frame at task
switches, also indicating that spontaneous blinks are
inhibited during task execution and rebound in the
moments between tasks. This relationship could be
utilized in adaptive systems to identify opportune
moments to interrupt a user. The moment a user
finishes a task might be an optimal point to disrupt
them, since they are not committed to another task in
the cockpit yet.
3.3.2 Limitations
Our experimental design did not perfectly align with
the subjective MWL reports. The air track task T1 at
high difficulty was regarded as almost equally
workload-inducing as at the easy difficulty level.
Another confounding factor of the experimental
design was that the DT conditions took significantly
longer than the ST conditions. This could be
problematic as BR increases with time-on-task and
fatigue. In addition, we were not able to design a
completely counterbalanced study with the low
number of participants. Individual BR results showed
that the correlation between BR and difficulty was not
present for some participants. A possible explanation
is the different order of experimental conditions or
Evaluating Blink Rate as a Dynamic Indicator of Mental Workload in a Flight Simulator
367

individual capabilities. In conclusion, future
experimental design should therefore focus on equal
time-on-task and a higher number of participants as
well as a sufficient training before the experimental
trials.
4 CONCLUSIONS
This study demonstrated that blink rate is indeed a
sensitive measure for MWL and should be considered
as a reliable measure in visual task settings. Using BR
has the great advantage, that blinks can be robustly
detected with low-tech equipment, presenting a good
trade-off between effort and sensitivity for MWL
estimation in real-world applications. Apart from
mean MWL measurement, our results also indicated
that the moments of blinking are not necessarily
random but rather indicate task progress, which could
be valuable for the application in adaptive systems.
Future research should focus on integrating BR
estimation into an adaptive policy by evaluating
strategies that act upon both MWL estimation and
dynamic changes of user BR. For this, the main
challenge is two-fold: First, we must show that the
BR measurement is robust enough to allow for a
reliable classification of MWL across a broad
spectrum of situations and users. Second, we must
evaluate, if adapting a system based on this measure
is useful to the user.
REFERENCES
Ayres, P., Lee, J. Y., Paas, F., & van Merriënboer, J. J. G.
(2021). The Validity of Physiological Measures to
Identify Differences in Intrinsic Cognitive Load.
Frontiers in Psychology, 12, 702538.
https://doi.org/10.3389/fpsyg.2021.702538
Boehm-Davis, D. A., Gray, W. D., & Schoelles, M. J.
(2000). The Eye Blink as a Physiological Indicator of
Cognitive Workload. Proceedings of the Human
Factors and Ergonomics Society Annual Meeting,
44(33), 6-116-6-119. https://doi.org/10.1177/
154193120004403309
Brand, Y., & Schulte, A. (2021). Workload-adaptive and
task-specific support for cockpit crews: design and
evaluation of an adaptive associate system. Human-
Intelligent Systems Integration, 3(2), 187–199.
https://doi.org/10.1007/s42454-020-00018-8
Charles, R. L., & Nixon, J. (2019). Measuring mental
workload using physiological measures: A systematic
review. Applied Ergonomics, 74, 221–232.
https://doi.org/10.1016/j.apergo.2018.08.028
Cho, Y. (2021). Rethinking Eye-blink: Assessing Task
Difficulty through Physiological Representation of
Spontaneous Blinking. In Y. Kitamura, A. Quigley, K.
Isbister, T. Igarashi, P. Bjørn, & S. Drucker (Eds.),
Proceedings of the 2021 CHI Conference on Human
Factors in Computing Systems (pp. 1–12). ACM.
https://doi.org/10.1145/3411764.3445577
Da Tao, Tan, H., Wang, H., Zhang, X., Qu, X., & Zhang, T.
(2019). A Systematic Review of Physiological
Measures of Mental Workload. International Journal of
Environmental Research and Public Health, 16(15).
https://doi.org/10.3390/ijerph16152716
Faure, V., Lobjois, R., & Benguigui, N. (2016). The effects
of driving environment complexity and dual tasking on
drivers’ mental workload and eye blink behavior.
Transportation Research Part F: Traffic Psychology
and Behaviour, 40, 78–90. https://doi.org/
10.1016/j.trf.2016.04.007
Feigh, K. M., Dorneich, M. C., & Hayes, C. C. (2012).
Toward a characterization of adaptive systems: A
framework for researchers and system designers.
Human Factors, 54(6), 1008–1024. https://doi.
org/10.1177/0018720812443983
Hajek, W., Gaponova, I., Fleischer, K. H., & Krems, J.
(2013). Workload-adaptive cruise control – A new
generation of advanced driver assistance systems.
Transportation Research Part F: Traffic Psychology
and Behaviour, 20, 108–120. https://doi.org/
10.1016/j.trf.2013.06.001
Holland, M. K., & Tarlow, G. (1972). Blinking and mental
load. Psychological Reports, 31(1), 119–127.
https://doi.org/10.2466/pr0.1972.31.1.119
Longo, L., Wickens, C. D., Hancock, G., & Hancock, P. A.
(2022). Human Mental Workload: A Survey and a
Novel Inclusive Definition. Frontiers in Psychology, 13,
883321. https://doi.org/10.3389/fpsyg.2022.883321/
Maffei, A., & Angrilli, A. (2018). Spontaneous eye blink
rate: An index of dopaminergic component of sustained
attention and fatigue. International Journal of
Psychophysiology : Official Journal of the
International Organization of Psychophysiology, 123,
58–63. https://doi.org/10.1016/j.ijpsycho.2017.11.009
Siegle, G. J., Ichikawa, N., & Steinhauer, S. (2008). Blink
before and after you think: Blinks occur prior to and
following cognitive load indexed by pupillary
responses. Psychophysiology, 45(5), 679–687.
https://doi.org/10.1111/j.1469-8986.2008.00681.x
Stern, J. A., Boyer, D., & Schroeder, D. (1994). Blink rate: A
possible measure of fatigue. Human Factors, 36(2), 285–
297. https://doi.org/10.1177/001872089403600209.
HUCAPP 2024 - 8th International Conference on Human Computer Interaction Theory and Applications
368
