
GAN-Based Data Augmentation for Improving Biometric Authentication
Using CWT Images of Blood Flow Sounds
Natasha Sahare
1,2
, Patricio Fuentealba
3 a
, Rutuja Salvi
4
, Anja Burmann
1 b
and Jasmin Henze
1 c
1
Fraunhofer Institute for Software and Systems Engineering ISST, Dortmund, Germany
2
Technical University of Dortmund, Dortmund, Germany
3
Instituto de Electricidad y Electr
´
onica, Facultad de Ciencias de la Ingenier
´
ıa,
Universidad Austral de Chile, Valdivia, Chile
4
IDTM GmbH, Recklinghausen, Germany
Keywords:
Data Augmentation, Generative Adversarial Networks, Continuous Wavelet Transform, Convolutional Neural
Networks, Blood Flow Sounds, Biometry.
Abstract:
Biometric identification allows to secure sensitive information. Since existing biometric traits, such as finger-
prings, voice, etc. are associated with different limitations, we exemplified the potential of blood flow sounds
for biometric authentication in previous work. Therefore, we used measurements from seven different users
acquired with a custom-built auscultation device to calculate the spectrograms of these signals for each cardiac
cycle using continuous wavelet transform (CWT). The resulting spectral images were then used for training of
a convolutional neural network (CNN). In this work, we repeated the same experiment with data from twelve
users by adding more data from the original seven users and data from five more users. This lead to an im-
balanced dataset, where the amount of available data for the new users was much smaller, e.g., U1 had more
than 900 samples per side whereas the new user U9 had less than 100 samples per side. We experienced a
lower performance for the new users, i.e. their sensitivity was 18-21% lower than the overall accuracy. Thus,
we examined whether the augmentation of data leads to better results. This analysis was performed using
generative adversarial networks (GANs). The newly generated data was then used for training of a CNN with
several different settings, revealing the potential of GAN-based data augmentation for increasing the accuracy
of biometric authentication using blood flow sounds.
1 INTRODUCTION
Biometric identification systems are used to provide
security to data, as biometric data of an individual
is unique (Babiker et al., 2017). Existing biomet-
ric traits, such as fingerprints, voice, face, iris, gait,
signature and handwriting are associated with several
limitations and drawbacks including susceptibility to
forgery, lifelong persistence issues and sensitivity to
external environmental conditions. The search for al-
ternative biometric characteristics led to the discovery
of electrocardiogram (ECG) signals and heart sounds,
which offer novel biometric information. While ECG
signals present unique advantages such as resistance
a
https://orcid.org/0000-0002-7119-0580
b
https://orcid.org/0000-0002-6989-1230
c
https://orcid.org/0000-0001-7180-2578
to tampering and forging, they require a complex
setup with electrodes and are relied on electronic
stethoscope for heart sound recordings. The explo-
ration of these biological characteristics aims to over-
come the shortcomings of traditional biometric meth-
ods and enhance the reliability of biometric sensing
tools. (Salvi and et al., 2021b)
In previous works, we demonstrated the potential
of blood flow sounds from the carotid arteries, ac-
quired by a custom-built auscultation device, for per-
son identification (Salvi and et al., 2021b), (Henze
and et al., 2022). Therefore, we analysed the sound
signals in the frequency domain using continuous
wavelet transform (CWT), assuming that the spectral
energies in the blood flow sound contain significant
information for the identification of an individual. We
then trained two simple Convolutional Neural Net-
works (CNN) on the CWT images from those mea-
340
Sahare, N., Fuentealba, P., Salvi, R., Burmann, A. and Henze, J.
GAN-Based Data Augmentation for Improving Biometric Authentication Using CWT Images of Blood Flow Sounds.
DOI: 10.5220/0012318100003657
Paper published under CC license (CC BY-NC-ND 4.0)
In Proceedings of the 17th International Joint Conference on Biomedical Engineering Systems and Technologies (BIOSTEC 2024) - Volume 2, pages 340-345
ISBN: 978-989-758-688-0; ISSN: 2184-4305
Proceedings Copyright © 2024 by SCITEPRESS – Science and Technology Publications, Lda.
surements, separately for measurements from each
side. Therefore, we chose each heart cycle within the
measurements as a single sample for training and test-
ing. Irrespective of the side on which the measure-
ments were taken, this approach achieved an over-
all accuracy of over 95% for identifying 881 samples
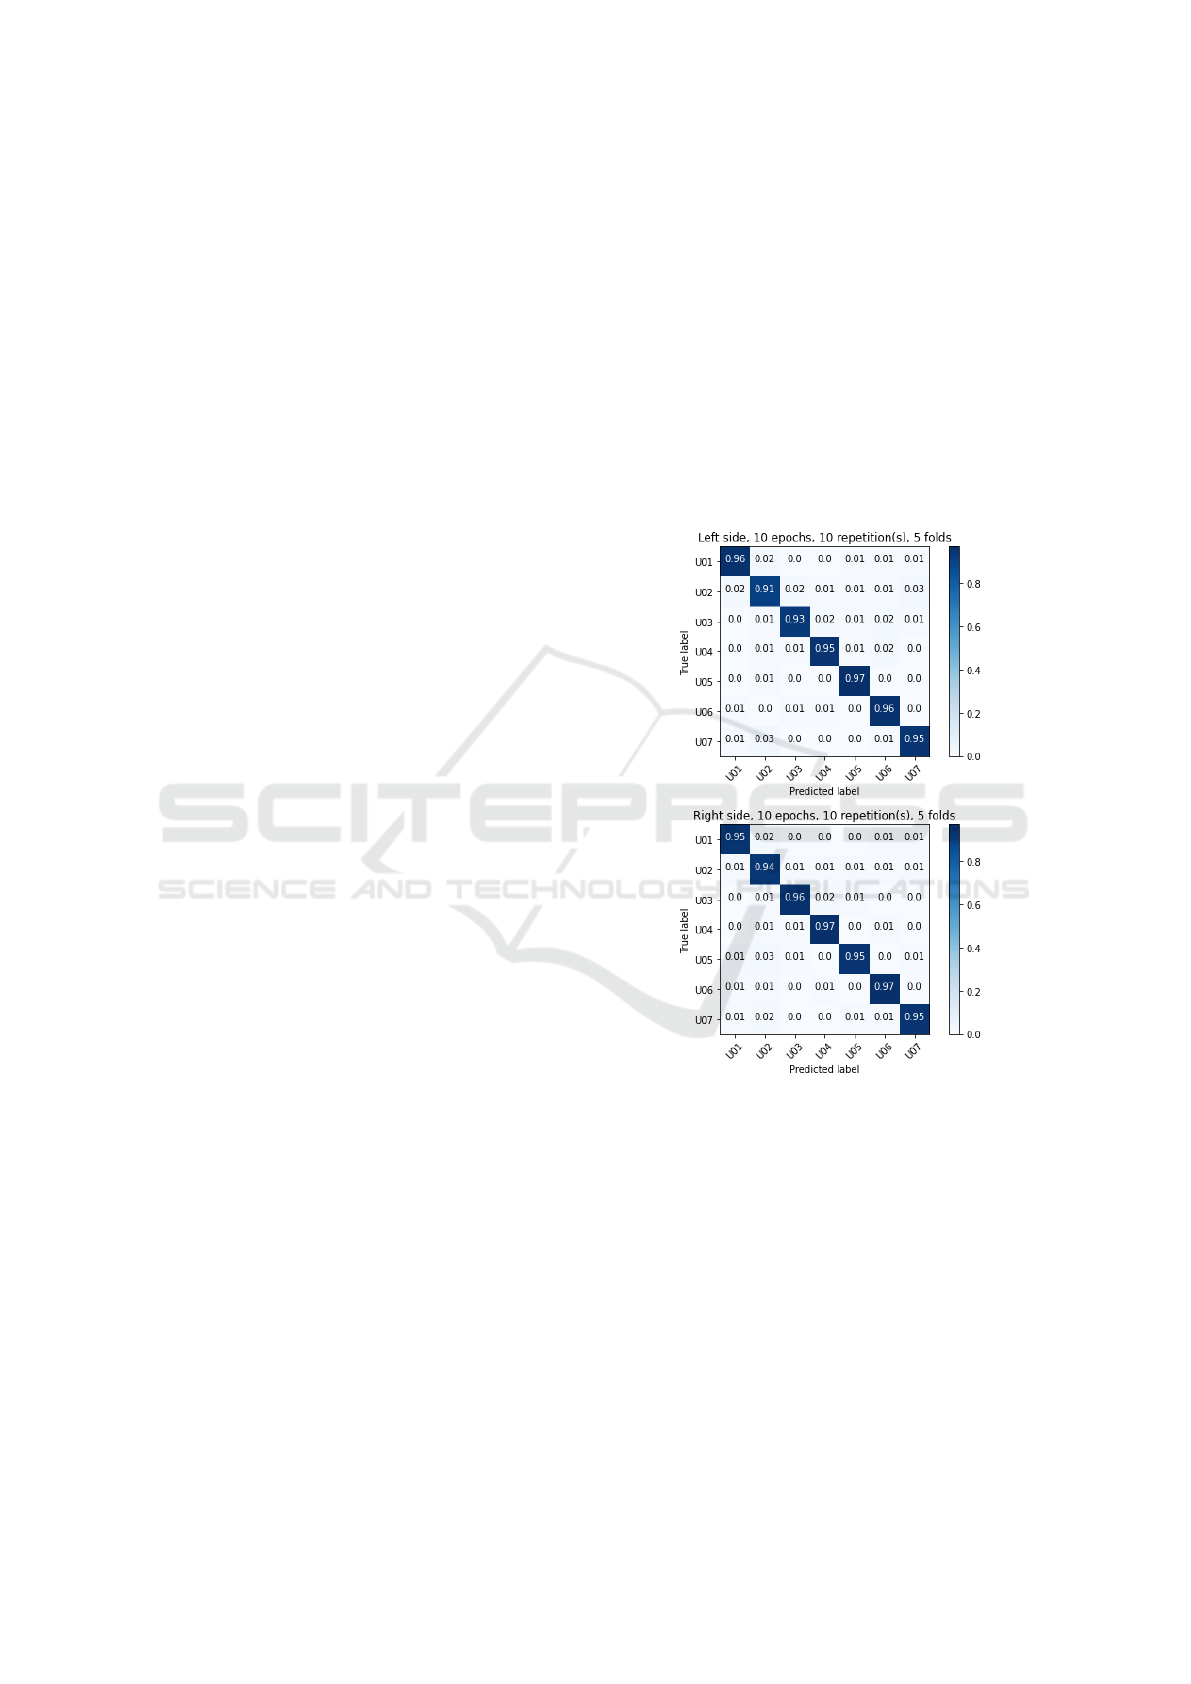
from seven users. The confusion matrices for the ex-
periments on both sides are shown in Figure 1. As can
be seen, the sensitivities for each single user (marked
in dark blue) vary between 0.91 and 0.97 for the ex-
periment on the left side data and between 0.94 and
0.97 on the right side data.
In this work, we add more measurements from the
same seven users but also from five additional users to
further investigate the potential of blood flow sounds
for biometric authentication, leading to a dataset of
1,765 samples in total. With retraining the CNN on
the new dataset, it achieves an overall accuracy of
over 87% with sensitivity values of over 90% for most
users. However, it clearly drops for users that con-
tributed with fewer samples to the dataset. Thus, we
investigate data augmentation techniques such as gen-
erative adversarial networks (GANs) and conditional
adversarial networks (CGANs) to research whether
the model’s accuracy enhances by adding synthetic
data to the real data.
As a first step, we generate synthetic images us-
ing both approaches and compare the results on a
small subset of three users. An investigation using the
Fr
´
echet inception distances (FID) shows that the im-
ages generated by the GANs are more similar to the
original images and have smaller FID than the ones
generated by the CGAN. Matching that, the classifi-
cation results using the GANs-generated samples are
slightly better than those using the CGAN-generated
samples. However, training of a separate GAN for
each of the labels takes significantly longer than train-
ing one CGAN for all labels. Since the improvement
in classification is very small, we therefore continue
the experiments on the whole dataset with the CGAN.
Strategic use of 30% CGAN-generated data and 70%
real data yields the best results, improving sensitivity
for all users and specific labels by 6-10%. This study
highlights the trade-off between reliability and train-
ing time for GANs and CGANs and shows the poten-
tial benefits of synthetic data augmentation in limited
data domains.
2 MATERIAL AND METHODS
2.1 Data
The employed data includes 1,765 carotid sound
recordings sampled at 16 kHz acquired by a custom-
built audio auscultation device (Salvi and et al.,
2021a), (S
¨
uhn and et al., 2020). Each recording con-
sists of 11 s in length and was collected between De-
cember 2020 and April 2022 from twelve users (U1-
U12). As shown in Table 1, the number of signals
acquired from the left and right carotid arteries are
overall balanced. They are analysed independently
for each side.
Figure 1: Confusion matrices from previous experiments
showing the results from CNNs trained on blood flow
sounds from seven people for differentiation between the
individuals. Separately trained on data from the left side
(top) and right side (bottom). Sensitivities for each single
user are shown on the diagonal.
All signals were recorded under controlled cessa-
tion of breathing (apnea) to avoid potential noise gen-
erated from breathing episodes. To evaluate the sig-
nal quality, we visually examined the presence of S1
and S2 episodes, the main sounds produced from the
mechanical contraction (systole) and relaxation (dias-
tole) of the ventricles. As a result of this evaluation,
we included 1,674 signals considered as good quality
into further processing.
GAN-Based Data Augmentation for Improving Biometric Authentication Using CWT Images of Blood Flow Sounds
341
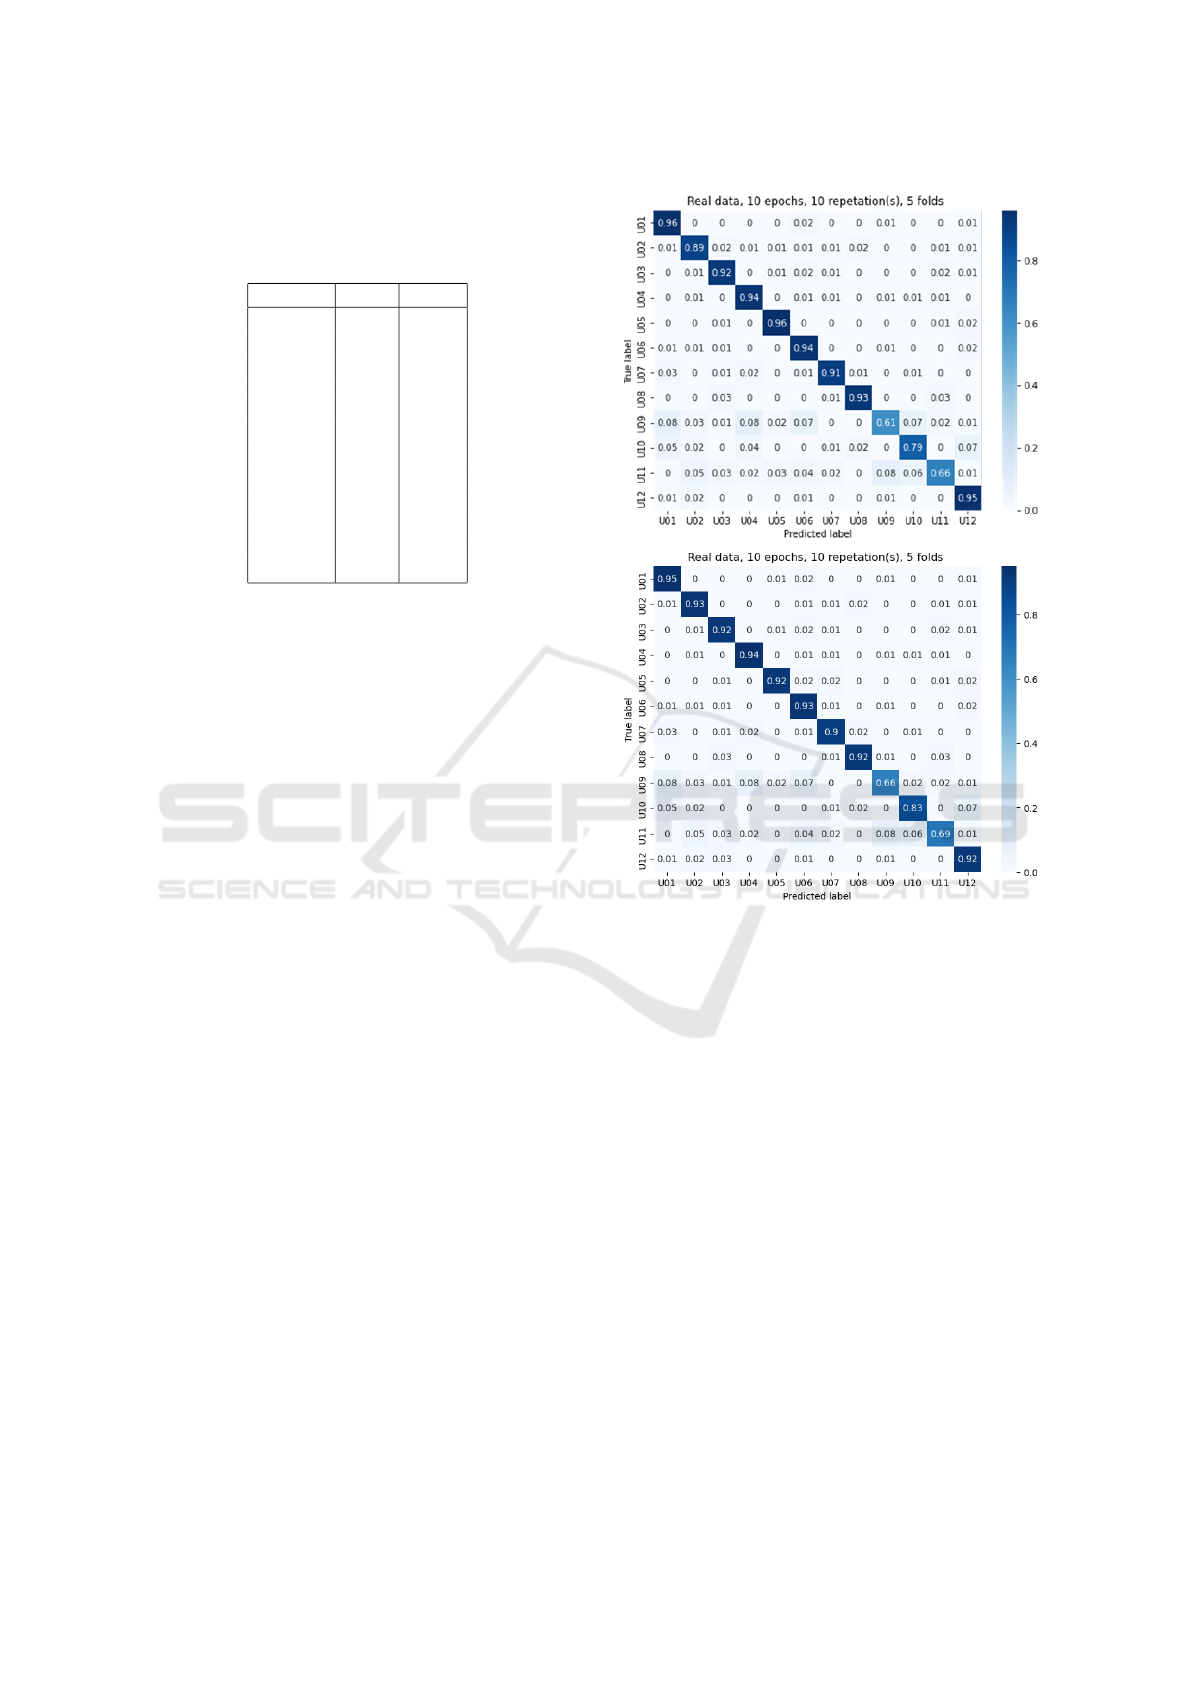
Table 1: Number of CWT images for each user in the
dataset. Includes more data for users U1-U7 that were al-
ready part of previous work and additional data for U7-U12
that were not included in previous work.
User ID Left Right
U1 907 921
U2 852 855
U3 965 1015
U4 1139 1149
U5 1150 1121
U6 1023 1011
U7 337 330
U8 270 270
U9 96 80
U10 181 192
U11 138 143
U12 1103 1086
2.2 Data Preparation and Classification
After gathering all the signals, we used a discrete
wavelet transform to automatically detect swallowing
and coughing artifacts within the signal, as presented
in (Fuentealba and et al., 2021). Next, we performed a
spectral analysis to look at the signal properties based
on CWT. The spectral dynamics for each cardiac cy-
cle were then independently examined using the seg-
mentation function for phonocardiogram recordings
proposed by (Springer et al., 2016). This tool uses a
duration-dependent logistic regression-based Hidden
Markov model to pinpoint S1, systole, S2, and dias-
tole episodes. Following the time domain segmenta-
tion of the signal, the associated CWT spectrum was
segmented in accordance. Note that the completed
spectral analysis included the frequency range from 0
to fs/2 = 8 kHz.
We created a CNN with three convolutional lay-
ers with max pooling followed by two fully connected
layers for the categorization of the prepared CWT im-
ages. Rectified linear activation functions are applied
to all levels. The CNN determines a score for each
of the available classes for each input sample, and it
outputs the class with the highest score in a stratified
5-fold cross-validation with 10 repetitions. The hy-
perparameters in this setting were: a learning rate of
0.001, a batch size of 32 and 10 training epochs. This
CNN attained an overall accuracy of over 87% for all
the 12 users. The same neural network has been used
from the previous study with seven users (Salvi and
et al., 2021b) by updating the output layer, this time
with more units, as it has to return scores for 12 in-
stead of seven users.
Figure 2: Confusion matrices from this work’s experi-
ments showing the results from CNNs trained on blood flow
sounds from twelve people (including seven from previous
work) for differentiation between the individuals. Sepa-
rately trained on data from the left side (top) and right side
(bottom). Sensitivities for each single user are shown on
the diagonal. Baseline result, does not include any synthetic
data.
2.3 Data Augmentation
We experienced a worse performance of our classi-
fication model for twelve users, particularly for the
new users who have comparatively less data than oth-
ers, as shown in Table 1. The confusion matrices for
the experiments on both sides are shown in Figure 2.
As can be seen, the sensitivities for each single user
(marked in dark blue) vary between 0.61 and 0.96 for
the experiment on the left side data and between 0.66
and 0.95 on the right side data. For some of the new
users, such as U9 and U11, the sensitivity is 18-21%
less than the overall accuracy. These results make us
conclude that the amount of data plays an important
role in the accuracy of the model prediction. Rather
HEALTHINF 2024 - 17th International Conference on Health Informatics
342

than asking the users to record more data, we investi-
gated data augmentation techniques.
Popular data augmentation techniques include
scaling, cropping, flipping, rotating, etc. (Shorten and
Khoshgoftaar, 2019). As the CWT plots the spectro-
grams on the time and frequency domain, the x-axis
represents time, and the y-axis gives the frequency
(Addison, 2018). So, flipping or rotating would com-
pletely change the values of the spectrogram. There-
fore, we used generative models, which can be used to
generate new examples that plausibly could have been
drawn from the original dataset. Generative adversar-
ial networks (GANs) are widely used for producing
clear and discrete synthetic outputs (Goodfellow and
et al., 2014).
A Generative Adversarial Network (GAN) is com-
prised of two key components: the generator model
and the discriminator model. The generator is tasked
with creating new synthetic data, while the discrim-
inator focuses on distinguishing between actual and
generated synthetic data. The efficacy of a GAN
hinges on training both models concurrently. Ini-
tially, the generator produces lower-quality data, but
with ongoing training, it progressively enhances its
capacity to craft more realistic data. Conversely,
the discriminator begins by effortlessly discerning
real and synthetic data apart. As it undergoes
training, it eventually reaches a point where distin-
guishing between real and synthetic data becomes a
formidable challenge, exemplifying the intricate equi-
librium achieved within the GAN framework. (Good-
fellow and et al., 2014). See Figure 3 for an example
of a GAN-generated sample CWT image in compari-
son to a real CWT image from user U2.
GANs can only generate a single labelled output
at once, i.e., we have no control over which specific
label will be produced by the generator. There is
no mechanism for how to request a particular label
from the GANs (Mirza and Osindero, 2014). To train
twelve different labels of our dataset would be quite
time consuming as we would have to train GANs 12
times for 12 different users. A variation of GAN
called Conditional GAN (CGAN) can address this
problem. It consists of an additional input layer with
values of one-hot-encoded image labels. CGANS
generate multilabel output at once and are much more
efficient (Mirza and Osindero, 2014).
2.4 Evaluation of Augmented Data
We employed the standard assessment metric known
as the Fr
´
echet Inception Distance (FID) to gauge the
quality of the generated images in comparison to the
authentic image set. Similar to the inception score,
Figure 3: Example of a real image from user U2 from our
dataset (left) and a synthetic image generated by the GAN
trained on data from U2 (right).
this evaluation utilizes the inception v3 model (Borji,
2018). Specifically, the coding layer of the model, sit-
uated just before the output classification of images,
captures pertinent computer vision-oriented features
from input images. These activations are computed
for both real and synthetic images, their mean and co-
variance evaluated to render a multivariate Gaussian
representation. These computed values then encapsu-
late the activations across the real and synthetic image
samples. A perfect FID score would stand at 0.0, sig-
nifying a likeness between the two image sets (Borji,
2018).
Additionally, we assessed the practicality of
GANs and CGANs in our context by comparing the
classification performance attained using synthetic
images from both methodologies. This evaluation
was conducted on a subset comprising just three users
(U1, U2, and U3). Following the outcomes outlined
in Section 3, we opted to proceed with CGANs for
subsequent experiments.
To ascertain the optimal ratio for harnessing syn-
thetic generated data to increase the size of training
set and consequently enhance the accuracy of biomet-
ric property analysis in blood flow sounds, we trained
Convolutional Neural Networks (CNNs) under var-
ied real-to-synthetic data proportions: 1:9 (10% syn-
thetic to 90% augmented data), 5:5, and 3:7. Ad-
ditionally, we explored an approach involving aug-
menting the labels with fewer data instances using
GAN-generated synthetic data while keeping others
constant, thereby achieving a balanced image count.
Refer to Section 3 and Tables 2 and 3 for detailed in-
sights into the outcomes of these experiments.
3 RESULTS
Referring to Table 4, we can see that the FID values
for CGANs (considering only the left side of users’
data) are roughly twice as large as those for the cor-
responding GANs across the three users. This shows
that the images generated by the GANs are more sim-
GAN-Based Data Augmentation for Improving Biometric Authentication Using CWT Images of Blood Flow Sounds
343
Table 2: Sensitivities for experiments with different combi-
nations of real and augmented data for the left side. Col-
umn ”Real” contains the results from the baseline with only
real data. The columns ”10%”, ”30%” and ”50%” contain
the results from experiments with the corresponding amount
of augmented data. ”Gap” refers to the approach of only
adding as much augmented data as needed to balance the
data set for those users with smaller amounts of data.
User ID Real 10% 30% 50% Gap
U1 0.96 0.96 0.96 0.94 0.96
U2 0.88 0.89 0.89 0.86 0.91
U3 0.91 0.93 0.94 0.90 0.91
U4 0.93 0.93 0.94 0.91 0.93
U5 0.96 0.97 0.97 0.96 0.97
U6 0.94 0.96 0.96 0.93 0.94
U7 0.90 0.91 0.93 0.91 0.93
U8 0.92 0.93 0.93 0.91 0.95
U9 0.69 0.69 0.70 0.70 0.74
U10 0.81 0.82 0.85 0.82 0.86
U11 0.66 0.67 0.69 0.67 0.76
U12 0.93 0.93 0.94 0.90 0.95
Table 3: Sensitivities for experiments with different combi-
nations of real and augmented data for the right side. Col-
umn ”Real” contains the results from the baseline with only
real data. The columns ”10%”, ”30%” and ”50%” contain
the results from experiments with the corresponding amount
of augmented data. ”Gap” refers to the approach of only
adding as much augmented data as needed to balance the
data set for those users with smaller amounts of data.
User ID Real 10% 30% 50% Gap
U1 0.95 0.95 0.95 0.93 0.96
U2 0.93 0.94 0.94 0.89 0.95
U3 0.92 0.92 0.93 0.90 0.94
U4 0.94 0.94 0.94 0.91 0.94
U5 0.92 0.93 0.94 0.91 0.94
U6 0.93 0.94 0.95 0.90 0.96
U7 0.90 0.91 0.91 0.90 0.93
U8 0.92 0.93 0.93 0.91 0.95
U9 0.66 0.69 0.70 0.64 0.74
U10 0.83 0.83 0.85 0.82 0.86
U11 0.69 0.70 0.72 0.67 0.76
U12 0.92 0.93 0.94 0.90 0.95
ilar to the original images. Interestingly, when we an-
alyze the two resulting confusion matrices from the
second evaluation method (one using GANs and the
other using CGANs with augmented real data in a
3:7 ratio), we notice minor differences. Despite us-
ing GANs to augment the dataset, the performance
improvement of the CNN is just slightly better, about
0-1%, compared to using CGANs. This is intriguing
given that GANs require about 8 hours of training per
label, whereas CGANs can train across all labels si-
multaneously in the same time frame. This small per-
Table 4: Results from the pre-experiments investigating the
difference in synthetic images generated by the GANs vs.
the CGAN based on a subset of three users (U1-U3). Shows
the Fr
´
echet inception distance for each user and both kinds
of generated data.
User ID GANS CGANS
U1 11 23
U2 10 18
U3 12 29
formance gap prompts us to consider the efficiency of
these two training approaches.
For the experimentation conducted on the com-
plete dataset enriched with CGAN-generated sam-
ples, our approach began with the integration of 10%
augmented data alongside the authentic images. The
outcomes demonstrated an initial marginal enhance-
ment of 1-2% across at least 8 out of the 12 users.
To provide further insight, we present the sensitivities
pertaining to various blends of real and augmented
data in Table 2 and 3. However, as the augmenta-
tion escalated to encompass 50% augmented data and
50% real data, a decline in results became evident,
indicative of overfitting. This phenomenon was illus-
trated by user U1, where the sensitivity dropped from
96% with only real data to 94% upon introducing 50%
augmented data. This pattern was echoed across nu-
merous labels, reflecting a decrease in accuracy by
3-4%.
Interestingly, a turning point was observed when
we employed 30% augmented data and 70% real
data. This configuration yielded promising outcomes,
showcasing a consistent rise in sensitivity across all
12 users. Optimal results materialized when we
strategically utilized CGAN-generated synthetic data
to bridge gaps in labels that required additional in-
stances to achieve a balanced dataset of 1,000 images
per user. Notably, some users, like U4, U5, U6, and
U12, already possessed over 1,000 images, render-
ing augmentation unnecessary. However, users such
as U1, U2, and U3, who required a modest influx
of CGAN-generated images to attain the 1,000-image
threshold, experienced modest performance improve-
ments ranging from 0-3%.
Employing this methodology yielded a general
augmentation in sensitivity for all users. Particu-
larly remarkable were the advancements in sensitiv-
ity achieved for labels U9, U10, and U11, which ex-
hibited increases of 6-10% using this approach, as
meticulously illustrated in Table 2 and 3. This under-
scores the efficacy of judiciously introducing CGAN-
generated data to enrich datasets, resulting in substan-
tial improvements across diverse users and labels.
HEALTHINF 2024 - 17th International Conference on Health Informatics
344

4 CONCLUSIONS
This work has presented a data augmentation ap-
proach to increase the size of training data for bet-
ter accuracy in investigating biometric properties in
blood flow sounds using GANs and CNN. Previously,
the CNN model had given less sensitivity per class,
where some users have comparatively less data. So,
we tried adding data generated by GANs and CGANs
to evaluate if this leads to an improvement. When
comparing results from GANs and CGANs in a pre-
test on data from three users, it turns out that GAN
generates samples that are more similar (represented
by a lower FID) to the original samples than those
generated by CGANs. On the other hand, the train-
ing of a GAN for one label from the presented dataset
takes 8 hours, whereas a CGAN is trained for all 12
labels at the same time. So, the GAN’s output is
slightly more reliable but time consuming, whereas
the CGAN has the advantage of producing multi-
labelled output and therefore taking much less train-
ing time.
Synthetically increasing the size of data using
these presented methods can be beneficial in a lim-
ited data domain. This study was mainly focused on
its application on CWT images of audio data, but the
concept can be expanded to other data domains. For
future work, it would be interesting to also differenti-
ate between correctly and incorrectly classified gener-
ated synthetic data. For GAN and CGANs to perform
better, more measurements from the users should be
included in the analysis.
ACKNOWLEDGEMENTS
Research funding: The authors acknowledge the
financial support from the State of North Rhine-
Westphalia and the European Union (EU EFRE [LS-
2-2-038a]).
REFERENCES
Addison, P. S. (2018). Introduction to redundancy rules:
the continuous wavelet transform comes of age.
Philos. Trans. R. Soc. A Math. Phys. Eng. Sci.,
376(2126):20170258.
Babiker, A., Hassan, A., and Mustafa, H. (2017). Heart
sounds biometric system. J. Biomed. Eng. Med. De-
vices, 2(2).
Borji, A. (2018). Pros and cons of GAN evaluation mea-
sures.
Fuentealba, P. and et al. (2021). Carotid sound signal arti-
fact detection based on discrete wavelet transform de-
composition. Curr. Dir. Biomed. Eng., 7(2):299–302.
Goodfellow, I. J. and et al. (2014). Generative adversarial
networks.
Henze, J. and et al. (2022). Towards identification of bio-
metric properties in blood flow sounds using neural
networks and saliency maps. Curr. Dir. Biomed. Eng.,
8(2):540–543.
Mirza, M. and Osindero, S. (2014). Conditional generative
adversarial nets.
Salvi, R. and et al. (2021a). Bodytune: Multi auscultation
device-personal health parameter monitoring at home.
Curr. Dir. Biomed. Eng., 7(2):5–8.
Salvi, R. and et al. (2021b). Vascular auscultation of carotid
artery: Towards biometric identification and verifica-
tion of individuals. Sensors, 21(19).
Shorten, C. and Khoshgoftaar, T. M. (2019). A survey on
image data augmentation for deep learning. J. Big
Data, 6(1):60.
Springer, D. B., Tarassenko, L., and Clifford, G. D. (2016).
Logistic regression-hsmm-based heart sound segmen-
tation. IEEE Trans. Biomed. Eng., 63(4):822–832.
S
¨
uhn, T. and et al. (2020). Auscultation system for acquisi-
tion of vascular sounds – towards sound-based moni-
toring of the carotid artery. Med. Devices Evid. Res.,
13:349–364.
GAN-Based Data Augmentation for Improving Biometric Authentication Using CWT Images of Blood Flow Sounds
345
