
Performance Review of Retraining and Transfer Learning of DeLTA2 for
Image Segmentation for Pseudomonas Fluorescens SBW25
Beate Gericke
1 a
, Finn Degner
2
, Tom H
¨
uttmann
2
, S
¨
oren Werth
3 b
and Carsten Fortmann-Grote
1 c
1
Max Planck Institute for Evolutionary Biology, Pl
¨
on, Germany
2
Technische Hochschule L
¨
ubeck, L
¨
ubeck, Germany
3
Berliner Hochschule f
¨
ur Technik, Berlin, Germany
fi
Keywords:
Deep Neural Networks, Image Analysis, Supervised Learning, Cell Size, Jaccard Index, Intersection Over
Union, Balanced Accuracy.
Abstract:
High throughput microscopy imaging yields vast amount of image data, e.g. in microbiology, cell biology,
and medical diagnostics calling for automated analysis methods. Despite recent progress in employing deep
neural networks to image segmentation in a supervised learning setting, these models often do not meet the
performance requirement when used without model refinement in particular when cells accumulate and overlap
in the image plane. Here, we analyse segmentation performance gains obtained through retraining and through
transfer learning using a curated dataset of phase contrast microscopy images taken of individual cells and cell
accumulations of Pseudomonas fluorescens SBW25. Both methods yield significant improvement over the
baseline model DeLTA2 (O’Conner et al. PLOS Comp. Biol 18, e1009797 (2022)) in intersection–over–union
and balanced accuracy test metrics. We demonstrate that (computationally cheaper) transfer learning of only
25% of neural network layers yields the same improvement over the baseline as a complete retraining run.
Furthermore, we achieve highest performance boosts when the training data contains only well separated cells
even though the test split may contain cell accumulations. This opens up the possibility for a semi–automated
segmentation workflow combining feature extraction techniques for ground truth mask generation from low
complexity images and supervised learning for the more complex data.
1 INTRODUCTION
Advances in technology allow modern biology to
gather increasing amounts of data (Stephens et al.,
2015). Since manual analysis cannot keep up with
the increase of gathered data, automated data analysis
methods become more and more important. Besides
genomic and proteomic sequence data, microscopy
imaging is among the major data sources (Peng, 2008)
in various areas such as microbiology, cell biology or
neurobiology.
Here we are interested in applications in the do-
main of evolutionary microbiology. Pseudomonas
fluorescens is an important model organism in this
field. Interest in our strain SBW25 (Rainey and Trav-
isano, 1998; Silby et al., 2009) originates from its
a
https://orcid.org/0009-0003-5777-7945
b
https://orcid.org/0009-0001-7936-2391
c
https://orcid.org/0000-0002-2579-5546
potential benefits for host plants, e.g. in an agricul-
tural context (Thompson et al., 1993). Evolution-
ary research on SBW25 aims at characterizing genet-
ically modified derivatives in terms of cell size and
shape, metabolism, growth dynamics, evolutionary
fitness, and ecology. Complementing genotyping via
targeted and whole genome sequencing, timelapse–
microscopy of growing cell colonies provides cell
phenotype data such as cell size and shape, as well
as growth rates as a function of time. To this end, mi-
croscopy images are segmented to identify individual
cells followed by cell counting, size and shape analy-
sis, classification and tracking.
Convolutional Neural Networks (CNNs) have
been demonstrated to be a viable solution for com-
puter vision tasks (LeCun et al., 2015), such as
segmentation, object recognition and classification.
Here, our focus is on image segmentation, i.e. the
task to identify if a pixel belongs to a cell or not. Seg-
mentation is usually the first task in a image analysis
Gericke, B., Degner, F., Hüttmann, T., Werth, S. and Fortmann-Grote, C.
Performance Review of Retraining and Transfer Learning of DeLTA2 for Image Segmentation for Pseudomonas Fluorescens SBW25.
DOI: 10.5220/0012316300003657
Paper published under CC license (CC BY-NC-ND 4.0)
In Proceedings of the 17th International Joint Conference on Biomedical Engineering Systems and Technologies (BIOSTEC 2024) - Volume 1, pages 273-280
ISBN: 978-989-758-688-0; ISSN: 2184-4305
Proceedings Copyright © 2024 by SCITEPRESS – Science and Technology Publications, Lda.
273

workflow. Errors in segmentation will propagate and
potentially amplify in later workflow stages, such as
tracking or cell counting.
For biological and medical image segmenta-
tion, various implementations have been devel-
oped, such as Cellpose (Stringer et al., 2021),
DeLTA2 (O’Connor et al., 2022), MiSiC (Panigrahi
et al., 2021), and more recently Omnipose (Cutler
et al., 2022). Despite promising results in their re-
spective realm of application and with respect to their
training and test data, we found their accuracy suf-
fered when applied to image data from our model or-
ganism Pseudomonas fluorescens SBW25.
Generic models achieving suboptimal results
when applied to special datasets is a known phe-
nomenon and was discussed e.g. in (Vaswani et al.,
2017; Campello et al., 2021; Brown et al., 2020).
The main reason for the failure of generic models is
the under–representation of the special dataset in the
training data of the model (Ma et al., 2023). This
in turn is mainly caused by the data generation and
training process being inherently difficult and costly
in time and human resources, if automated ground
truth labeling is not available. This process often im-
plies manual editing of individual images to create an
accurate ground truth. In the case of bacteria, label-
ing of cell boundaries becomes ambiguous to a certain
degree if cells touch or overlap, increasing the human
work load.
Transfer Learning (TL) is a proven method to
adapt generic models to specialized datasets (Weiss
et al., 2016; Kim et al., 2022; Yu et al., 2022; Iman
et al., 2023). In the case of CNNs this can be un-
derstood intuitively realizing that a CNN effectively
acts as a series of filters. While early layers (filters)
are mostly sensitive to specific aspects of the image
(e.g. edges) later layers are sensitive to generic and
abstract features (Chollet, 2018). Hence, retraining
only the early layers transfers a model’s ability to seg-
ment images of one class of objects to another class
in the case where these classes (such as bacteria of
different species or strains) share certain generic fea-
tures (such as their overall shape), but differ in more
subtle features (e.g. length or curvature). In the limit
of retraining all layers, transfer learning and complete
retraining coincide. TL becomes especially useful if
not much data for a retraining is available or if com-
pute time for complete retraining is limited.
In the following, we describe how we performed
and evaluated complete retraining and TL on a cu-
rated dataset of microscopy images taken from Pseu-
domonas fluorescens SBW25 cells. We quantify the
model’s ability to segment our images in terms of
performance metrics Balanced Accuracy (BA) and
Intersection–over–Union (IoU). As a baseline model
for comparison, we employ the trained segmentation
model from the DeLTA2 software (O’Connor et al.,
2022). DeLTA2 is also the base model for our TL
experiments. We demonstrate that both complete re-
training and TL yield a significant improvement over
the baseline. Moreover, we find that transfer learning
of only the top 25% of layers of the DeLTA2 model
gives the same quantitative improvement over the un-
modified DeLTA2 model as complete retraining, un-
derlining the effectiveness of this method.
Secondly, we found that transfer learning yields
accurate segmentation even for rather complex and
dense cell accumulations although the training data
contains only images with few and well separated
cells. This result is remarkable insofar as the label-
ing of such low complexity images can be done in
an automatized way using classical feature based seg-
mentation techniques (e.g. thresholding or edge de-
tection). This finding opens the possibility of largely
automated (unsupervised) segmentation, where man-
ual labeling of the training data becomes unnecessary.
2 DATASET CREATION
2.1 Microscopy
Our dataset consists of 34 time series of phase con-
trast microscopy images from growing Pseudomonas
fluorescens cultures growing in different media. Data
was taken on a Zeiss Axio Imager Z2 with 100x mag-
nification. Each time series consists of 10-20 images
taken at fixed time intervals. All series start shortly af-
ter the moment of inoculation with a single cell. The
series end at different timepoints, usually when one or
multiple communities of closely adjacent cells have
emerged. In total, 412 images of 2048x2048 pixels
have been included in this study. We refer to these
images as the MPB dataset. They are available from
(Fortmann-Grote and other, 2023).
2.2 Manual Masking
Manual creation of masks (i.e. black–white im-
ages with white denoting pixels that belong to a
cell and black pixels belonging to the background)
was performed using Adobe Photoshop version 23.5.1
(Adobe) and Affinity Photo version 1.10.6 (SerifLtd)
using a touchscreen device and a graphics tablet (Wa-
com), respectively. Before masking, images were in-
dividually adjusted in brightness and contrast to en-
hance visibility of cell regions to the human eye. Ad-
justed images were disposed afterwards and not used
BIOIMAGING 2024 - 11th International Conference on Bioimaging
274
for training. We marked the outline of cells with a
tablet pen. Touching or overlapping cells were artifi-
cially separated by a one pixel thick boundary. The
set of 412 images and 412 masks will be referred to
as complete dataset henceforth.
Additionally, we generated masks for a subset of
226 images representing the first 5 time steps in our
series. In this early times of the growth experiment,
cell numbers are low and the few cells are isolated.
Ground truth labeling could hence be carried out by
intensity thresholding. We used the “modified Iso-
Data thresholding method” implemented in MicrobeJ
version 5.13n (8) – beta (Ducret et al., 2016) with off-
set threshold 180, stack histogram thresholding and
bicubic resampling (p = 0.5). The set of early time
images and masks is termed the partial dataset.
2.3 Training Validation Test Split
For training with the complete MPB dataset one time
series with 16 images was set aside, the remaining 33
time series were split into 7 time series (88 images)
for validation and 26 time series (308 images) for neu-
ral network training using backpropagation. For train-
ing with the partial MPB dataset 88 images were used
for training and 49 images for validation. These 49
validation images are taken from the complete dataset
to prevent leaky validation.
3 THE DeLTA2 BASELINE
MODEL
DeLTA2 is a deep learning segmentation and track-
ing pipeline for two–dimensional time-lapse mi-
croscopy (O’Connor et al., 2022). The DeLTA2 seg-
mentation model was trained on phase contrast im-
ages of Escherichia coli cells and achieves impressive
segmentation accuracy of the order 99%. Since E.
coli bacteria are similar to Pseudomonas fluorescens
SBW25 cells in shape and size, we chose the DeLTA2
segmentation model as our baseline and as the start-
ing point for retraining and TL. DeLTA2 has a U–Net
architecture (Ronneberger et al., 2015) featuring two
symmetric legs: Input images are fed into the con-
traction leg with 5 sets of alternating convolution and
max–pooling layers. The expansion leg consists of 4
levels of alternating upsampling and convolution lay-
ers with additional concatenation of output from the
corresponding level on the contraction leg. In total,
the DeLTA2 model has 36 layers.
When evaluated on the complete MPB dataset,
we found two major issues with the DeLTA2 model.
(a) (b) (c)
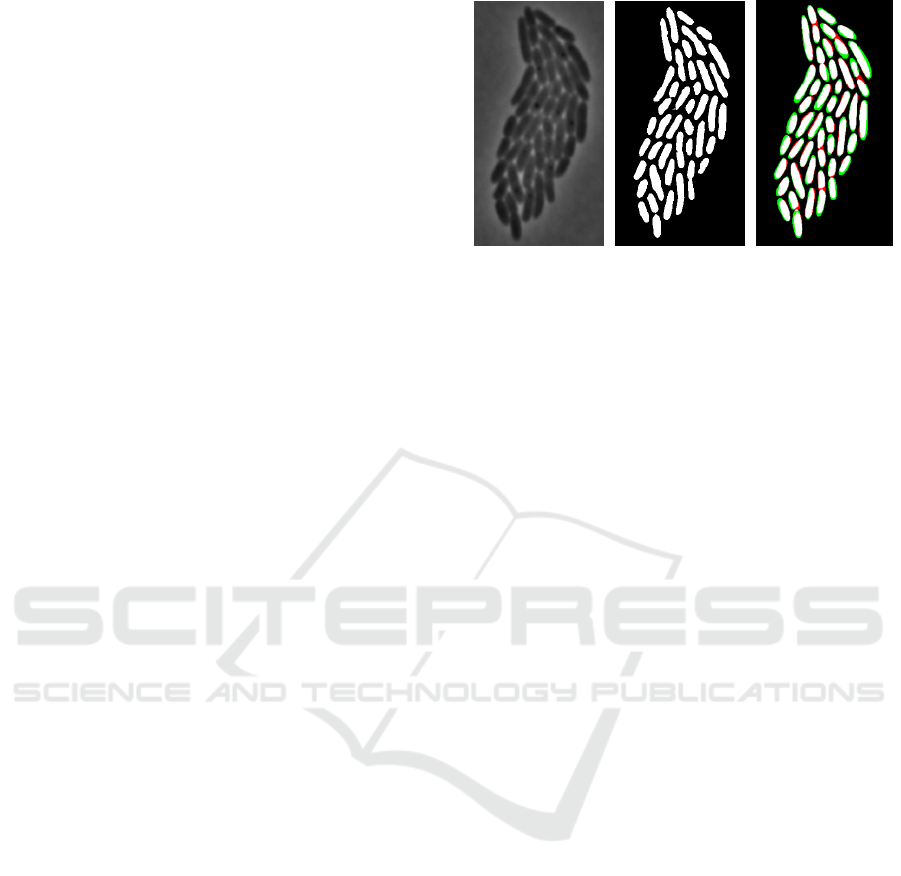
Figure 1: Raw image data (a), manually created ground
truth binary mask (b), and (c) segmentation with DeLTA2
for a cell colony in an example image from our MPB train-
ing dataset. Colored areas in (c) indicate true positive
(white), false positive (green), false negative (red) and true
negative (black) pixel segmentation.
These are is illustrated in Fig. 1 showing a phase con-
trast image (1a) of Pseudomonas fluorescens SBW25
zoomed in on a cell cluster of 48 closely neighbor-
ing cells, the ground truth mask (1b) and the DeLTA2
segmentation result (1c). The colored areas mark the
DeLTA2 segmentation. The first issue is that long
cells are often split into two by the model, adding
a narrow intercellular space (red pixels, false posi-
tive predictions). Secondly, the model wrongly clas-
sifies pixels outsite the true cell perimeter as being
part of the cell (green pixels, false positives) in nu-
merous cases of smaller and isolated cells. In quan-
titative terms, DeLTA2 achieves only ≈ 90% BA and
≈ 65% IoU for our data (see Sec. 4.2), far below the
reported values for the original DeLTA2 test evalua-
tions. This finding is clearly unsatisfactory for our use
case, hence the motivation for retraining DeLTA2 on
our data.
4 RETRAINING EXPERIMENTS
We consider how the DeLTA2 model performs on
phase contrast images of Pseudomonas fluorescens
SBW25 with and without retraining. The combina-
tion of our two curated training datasets (complete
and partial and the two considered training methods
(complete retraining and transfer learning with only a
subset of neural network layers) defines four experi-
ments:
1. Complete retraining with complete dataset
2. Transfer learning with complete dataset
3. Complete retraining with partial dataset
4. Transfer learning with partial dataset
Performance Review of Retraining and Transfer Learning of DeLTA2 for Image Segmentation for Pseudomonas Fluorescens SBW25
275

In all cases, the DeLTA2 segmentation model is the
starting point. In the case of complete retraining, all
network weights are initialized with random values,
while in the case of TL, the network was initialized
with the published pre–trained DeLTA2 model. After
training, all four cases are evaluated by calculating
BA and IoU on the respective test split.
4.1 Training Parameters
DeLTA2 uses weight maps to emphasize important
parts of an image. These were regenerated for all
training data using a utility function from the DeLTA2
repository. An example weight map is included in the
supplementary material (Fortmann-Grote and other,
2023). The complete retraining of the DeLTA2 neu-
ral network was performed over 600 epochs with 300
steps in each epoch. Early stopping with a patience
of 50 epochs was applied to mitigate overfitting. The
Adam optimizer was employed with with a learning
rate of 0.0001. Backpropagation used the pixel wise
weighted binary cross entropy (part of the DeLTA2
software) as loss function.
Transfer learning was run over 10 epochs with 300
steps and otherwise unchanged parameters. Training
started from DeLTA2 pre-trained model. Retraining
2, 9, 18, 27, or 36 layers results in 5 distinct TL mod-
els in total.
4.2 Metrics
In order to compare the performance of our differ-
ent models, we employ two performance metrics,
BA (Minaee et al., 2020) and IoU. These are defined
in terms of the number of true positive, true negative,
false positive, and false negative pixel classifications
per image, TP, TN, FP, and FN,
TP =
|
A ∩ B
|
FP =
|
A ∩ ¬B
|
(1)
FN =
|
¬A ∩ B
|
TN =
|
¬A ∩ ¬B
|
, (2)
with A and B being the set of pixels labeled as belong-
ing to a cell in the model prediction and in the ground
truth, respectively.
Then, BA is defined as
Balanced Accuracy =
Recall + Specificity
2
(3)
with:
Recall =
TP
TP + FN
Specificity =
TN
TN + FP
(4)
BA was suggested as a suitable metric for skewed
(imbalanced) datasets(Garc
´
ıa et al., 2009).
IoU is the ratio of the number of pixels correctly
predicted as “cell” (intersection between prediction
and ground truth) and the number of pixels being la-
beled as “cell” in either prediction or ground truth or
both (union of prediction and ground truth):
IoU =
| A ∩ B |
| A ∪ B |
=
TP
TP + FN + FP
(5)
IoU is considered a very robust test metric (Minaee
et al., 2020) and can be shown to be the strictest eval-
uation metric for reasonably well performing classifi-
cation tasks.
5 RESULTS
5.1 Retraining
The model resulting from a complete retraining with
the complete MPB dataset achieves a mean BA(IoU)
of 0.91(0.75). Compared to 0.85(0.65) achieved by
the DeLTA2 pretrained model, this is a significant im-
provement. In Fig. 2 we show a color coded compar-
ison between model predicted masks from test data
and the ground truth. Mask pixels correctly identi-
fied as belonging to a cell are highlighted in white
(true positives), false positives are colored in green,
false negatives are colored red and true negatives in
black. While the baseline model DeLTA2 (Fig. 2a)
yields a high false–positive rate (indicated by green
areas), retraining on either the complete (Fig. 2b) or
the partial (Fig. 2c) MPB dataset significantly reduces
the false–positive rate. On the other hand, the false–
negative rate slightly increases compared to the base-
line (indicated by red areas) but a net improvement in
overall BA and IoU remains. Remarkably, both vari-
ants of completely retrained model (using the com-
plete dataset and using the partial dataset) yield sim-
ilar segmentations; the respective masks are indistin-
guishable by eye.
5.2 Transfer Learning
Table 1 tabulates the averaged balanced accuracy and
IoU values obtained from various TL models differing
in the numbers of retrained layers. The confidence
intervals are taken as the twofold standard deviation
over three independently trained models and over all
images in the timeseries. All TL models improve the
segmentation performance compared to the baseline
model DeLTA2 (corresponding to 0 retrained layers).
Within the two sigma error margins all retrained mod-
els achieve the same performance gain. Looking at
the average values only, we find a slight improvement
when retraining nine or more layers compared to the
two layer case, but the difference is not significant.
BIOIMAGING 2024 - 11th International Conference on Bioimaging
276
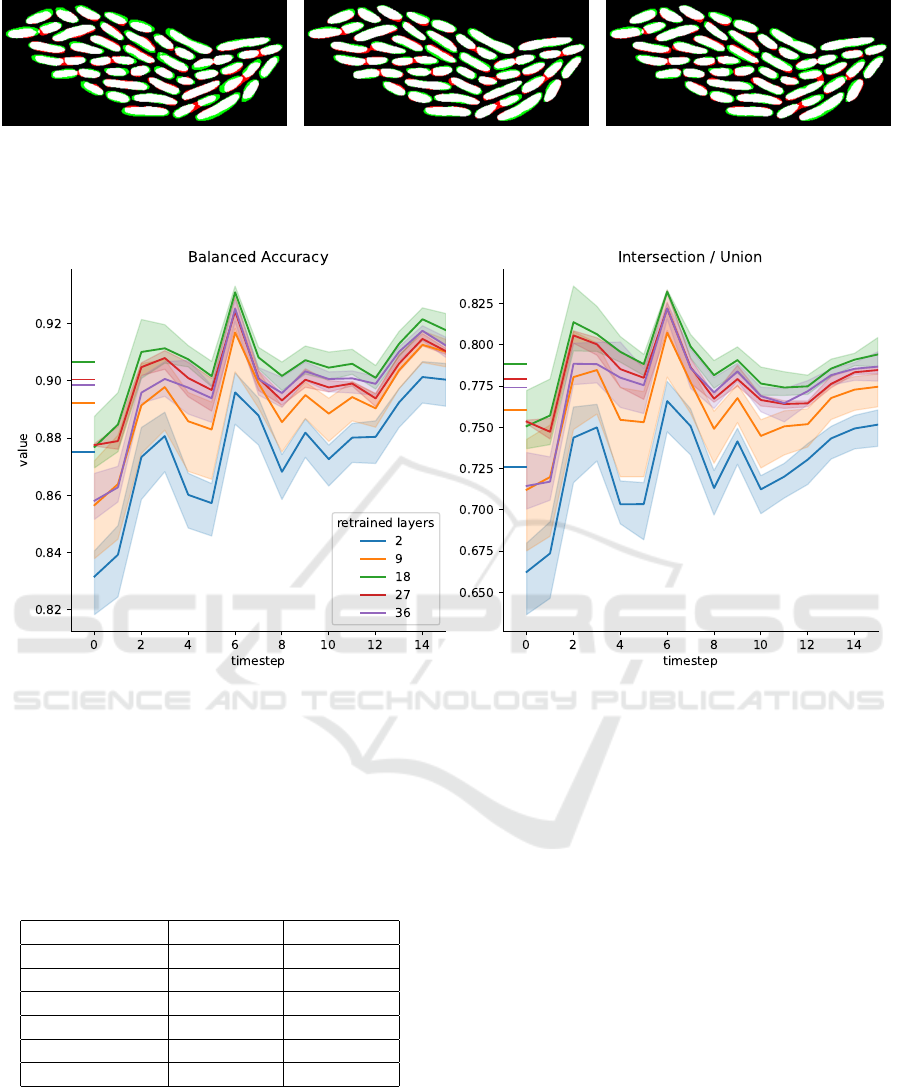
(a) DeLTA2 model evaluated on MPB
test dataset
(b) MPB model completely retrained on
complete MPB dataset
(c) MPB model completely retrained on
partial MPB dataset
Figure 2: Color coded pixel map of true positive (white), false positive (green), false negative (red), and true negative (black)
segmentation masks for a selected image of the MPB test dataset.
Figure 3: Balanced accuracy (left) and IoU (right) vs. image timestamp for transfer learning with varying number of retrained
layers for the complete MPB timeseries dataset. The shaded areas denote the min/max range over three independently trained
models. Horizontal lines next to y-axis indicate total mean values over the timeseries according to Tab. 1.
Table 1: Mean balanced accuracy and mean IoU for transfer
learning models trained on the complete MPB dataset and
with varying number of retrained layers. 0 retrained layers
corresponds to the original DeLTA2 model. Error margins
are computed as 2 times the standard deviation over all test
images and over three independently trained model repli-
cates.
retrained layers mean BA mean IoU
0 0.85 0.65
2 0.88 ± 0.04 0.73 ±0.06
9 0.89 ± 0.04 0.76 ±0.06
18 0.91 ± 0.03 0.79 ±0.04
27 0.90 ± 0.02 0.78 ±0.04
36 0.90 ± 0.03 0.77 ±0.05
We find the same pattern when we group the test im-
ages according to their timestamp in the microscopy
timeseries and calculate the various TL models’ per-
formance metrics for each group separately. This is
shown in Fig. 3 for TL with the complete dataset. BA
and IoU are plotted against the timestamp of the re-
spective group of images. The measured performance
metrics values vary over the entire timeseries, with
the tendency of decreasing performance towards later
timepoints where cells are more abundant and start
to accumulate and to overlap. Within error margins,
given as shaded areas in Fig. 3, TL models with nine
or more retrained layers yield the same performance
metrics while the two layer model performs slightly
worse.
Finally, we performed the same set of model train-
ing and evaluations for TL models trained on the par-
tial dataset. Note however, that the test split is iden-
tical to the complete dataset, i.e. it contains data
from one entire timeseries, including cell accumula-
tions and overlapping cells.
Table Tab. 2 lists the mean values for BA and IoU
over the timeseries for the models trained on the par-
tial training dataset. We observe the same trend as
in the case of training with the complete dataset: All
models yield the same average performance (within
the two sigma confidence interval) with the model
Performance Review of Retraining and Transfer Learning of DeLTA2 for Image Segmentation for Pseudomonas Fluorescens SBW25
277
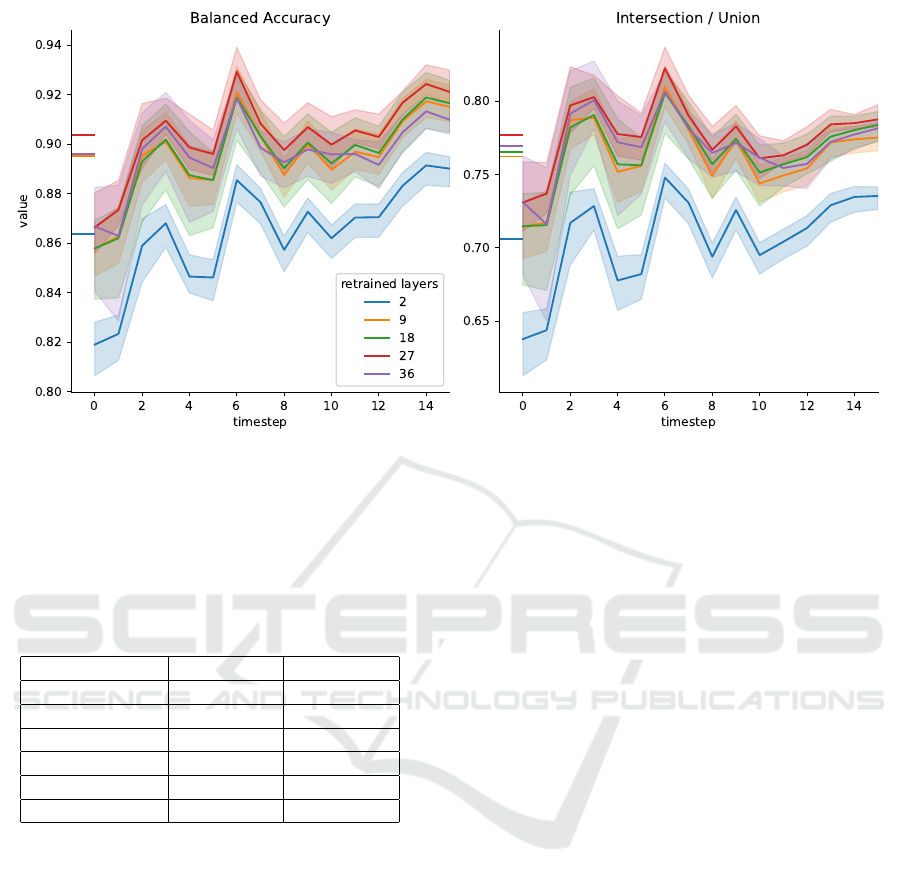
Figure 4: Balanced accuracy (left) and IoU (right) vs. image timestamp for transfer learning with varying number of retrained
layers for the partial MPB timeseries dataset. The shaded areas denote the min/max range over three independently trained
models. Horizontal lines next to y-axis indicate total mean values over the timeseries according to Tab. 1.
Table 2: Mean balanced accuracy and mean IoU for transfer
learning models trained on the partial MPB dataset and with
varying number of retrained layers. 0 retrained layers cor-
responds to the original DeLTA2 model. Error margins are
computed as 2 times the standard deviation over all test im-
ages and over three independently trained model replicates.
retrained layers mean BA mean IoU
0 0.85 0.65
2 0.86 ± 0.04 0.71 ±0.07
9 0.90 ± 0.04 0.76 ±0.06
18 0.90 ± 0.04 0.77 ±0.06
27 0.90 ± 0.04 0.78 ±0.05
36 0.90 ± 0.04 0.77 ±0.06
with only two retrained layers performing slightly
but insignificantly worse than the models with nine
or more retrained layers. Figure 4 shows the per-
formance metrics for images grouped by their times-
tamp. In this representation it becomes evident that
retraining only nine layers (25% of the DeLTA2 U–
Net) gives the same improvement as retraining the en-
tire model, while retraining only two layers performs
significantly worse.
Interestingly, both BA and IoU values for TL with
the partial dataset coincide with the respective val-
ues for the complete dataset (Tab. 1). We compare
our transfer learning results for the partial and for
the complete training dataset in more detail in Fig. 5.
Within error bars, transfer learning with 10 retrained
layers yields the same validation metrics in both cases
at each timepoint in the series.
From these results we conclude that the test eval-
uation of TL models is not correlated with the com-
plexity of the training dataset.
6 DISCUSSION
Not surprising, we observe significant improvement
in IoU and BA compared to the original DeLTA2
model when completely retraining the model on the
MPB dataset. We also confirmed that TL improves
performance of the segmentation model.
As a rather novel result, we observed that the per-
formance gain with complete retraining and with TL
can be achieved with training data of reduced com-
plexity compared to the evaluation test data.
This last result paves the way towards a segmen-
tation workflow without the laborious manual label-
ing of training data. Manual labeling could be re-
placed by automated unsupervised labeling of the low
complexity images with only few isolated cells. In a
growth experiment, these would typically be the very
early images in the time series. These can efficiently
be segmented by e.g. thresholding or edge detection.
Subsequently, a U–Net could be trained on this au-
tomatically labeled data and finally be applied to the
full complexity dataset.
Looking out to future research, the present ap-
proach to evaluate various segmentation models and
their retraining should be extended to other Deep
Learning Segmentation implementations as well as to
traditional segmentation techniques. The latter play
BIOIMAGING 2024 - 11th International Conference on Bioimaging
278
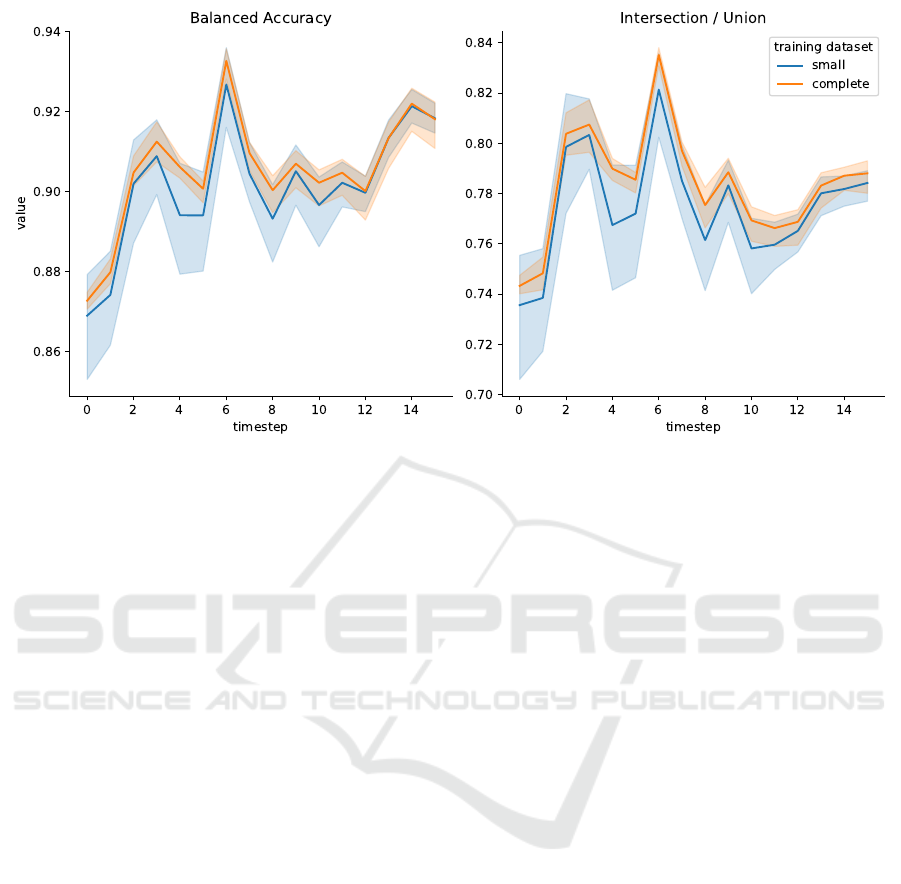
Figure 5: Balanced Accuracy (left) and IoU (right) vs. image timestamp for two models trained on different datasets: Orange
lines for training with the complete training dataset, blue lines for training with the partial training dataset. Shaded areas
indicate the min-max interval from 3 model replicates. The test metrics are plotted against the timestep of the timelapse
microscopy test dataset.
a crucial role in the envisioned automated segmenta-
tion workflow and should be well understood in order
to achieve the best possible automated ground truth
labeling for the subsequent deep learning training.
ACKNOWLEDGEMENTS
We acknowledge Jana Grote for generating and pro-
viding the image data and Octavio Reyes-Matte for
stimulating discussion. BG and CFG acknowledge
generous support by the Max Planck Society.
REFERENCES
Brown, T. B., Mann, B., Ryder, N., Subbiah, M., Kaplan, J.,
Dhariwal, P., Neelakantan, A., Shyam, P., Sastry, G.,
Askell, A., Agarwal, S., Herbert-Voss, A., Krueger,
G., Henighan, T., Child, R., Ramesh, A., Ziegler,
D. M., Wu, J., Winter, C., Hesse, C., Chen, M., Sigler,
E., Litwin, M., Gray, S., Chess, B., Clark, J., Berner,
C., McCandlish, S., Radford, A., Sutskever, I., and
Amodei, D. (2020). Language Models are Few-Shot
Learners. Technical report. arXiv:2005.14165 [cs]
type: article.
Campello, V. M. et al. (2021). Multi-Centre, Multi-
Vendor and Multi-Disease Cardiac Segmentation: The
M&Ms Challenge. IEEE Transactions on Medical
Imaging, 40(12).
Chollet, F. (2018). Deep Learning With Python. Manning
Publications.
Cutler, K. J., Stringer, C., Lo, T. W., Rappez, L., Strous-
trup, N., Brook Peterson, S., Wiggins, P. A., and
Mougous, J. D. (2022). Omnipose: a high-precision
morphology-independent solution for bacterial cell
segmentation. Nature Methods, 19(11).
Ducret, A., Quardokus, E. M., and Brun, Y. V. (2016). Mi-
crobej, a tool for high throughput bacterial cell detec-
tion and quantitative analysis. Nature Microbiology,
1(7).
Fortmann-Grote, C. and other (2023). Raw Data for ”Per-
formance Review of Retraining and Transfer Learn-
ing of DeLTA 2.0 for Image Segmentation for Pseu-
domonas fluorescens SBW25”.
Garc
´
ıa, V., Mollineda, R. A., and S
´
anchez, J. S. (2009). In-
dex of balanced accuracy: A performance measure for
skewed class distributions. In Araujo, H., Mendonc¸a,
A. M., Pinho, A. J., and Torres, M. I., editors, Pattern
Recognition and Image Analysis, volume 4 of Iberian
Conference on Pattern Recognition and Image Analy-
sis, IbPRIA. Springer, Berlin, Heidelberg.
Iman, M., Arabnia, H., and Rasheed, K. (2023). A review of
deep transfer learning and recent advancements. Tech-
nologies, 11.
Kim, H. E., Cosa-Linan, A., Santhanam, N., Jannesari, M.,
Maros, M. E., and Ganslandt, T. (2022). Transfer
learning for medical image classification: a literature
review. BMC Medical Imaging, 22(1).
LeCun, Y., Bengio, Y., and Hinton, G. (2015). Deep learn-
ing. Nature, 521(7553).
Ma, J., He, Y., Li, F., Han, L., You, C., and Wang, B. (2023).
Segment anything in medical images. arXiv preprint
arXiv:2304.12306.
Minaee, S., Boykov, Y., Porikli, F., Plaza, A., Kehtarnavaz,
N., and Terzopoulos, D. (2020). Image segmenta-
Performance Review of Retraining and Transfer Learning of DeLTA2 for Image Segmentation for Pseudomonas Fluorescens SBW25
279

tion using deep learning: A survey. arXiv:2001.05566
[cs]. version: 1.
O’Connor, O. M., Alnahhas, R. N., Lugagne, J.-B., and
Dunlop, M. J. (2022). Delta 2.0: A deep learning
pipeline for quantifying single-cell spatial and tempo-
ral dynamics. PLOS Computational Biology, 18(1).
Panigrahi, S. et al. (2021). Misic, a general deep learning-
based method for the high-throughput cell segmenta-
tion of complex bacterial communities. eLife, 10.
Peng, H. (2008). Bioimage informatics: a new area of en-
gineering biology. Bioinformatics, 24(17).
Rainey, P. B. and Travisano, M. (1998). Adaptive radiation
in a heterogeneous environment. Nature, 394(6688).
Ronneberger, O., Fischer, P., and Brox, T. (2015). U-
net: Convolutional networks for biomedical image
segmentation. In Lecture Notes in Computer Science.
Springer International Publishing.
Silby, M. W. et al. (2009). Genomic and genetic analyses of
diversity and plant interactions of pseudomonas fluo-
rescens. Genome Biology, 10(5).
Stephens, Z. D. et al. (2015). Big data: Astronomical or
genomical? PLOS Biology, 13(7).
Stringer, C., Wang, T., Michaelos, M., and Pachitariu, M.
(2021). Cellpose: a generalist algorithm for cellular
segmentation. Nature Methods, 18.
Thompson, I. et al. (1993). Quantitative and qualitative sea-
sonal changes in the microbial community from the
phyllosphere of sugar beet (Beta vulgaris). Plant and
Soil, 150(2).
Vaswani, A., Shazeer, N., Parmar, N., Uszkoreit, J., Jones,
L., Gomez, A. N., Kaiser, L., and Polosukhin, I.
(2017). Attention is All you Need. In Advances in
Neural Information Processing Systems, volume 30.
Curran Associates, Inc.
Weiss, K., Khoshgoftaar, T. M., and Wang, D. (2016). A
survey of transfer learning. Journal of Big Data, 3(1).
Yu, X., Wang, J., Hong, Q., Teku, R., Wang, S.-H., and
Zhang, Y. (2022). Transfer learning for medical im-
ages analyses: A survey. Neurocomputing, 489.
BIOIMAGING 2024 - 11th International Conference on Bioimaging
280
