Data Quality Aware Approaches for Addressing Model Drift of Semantic
Segmentation Models
Samiha Mirza
a
, Vuong D. Nguyen
b
, Pranav Mantini
c
and Shishir K. Shah
d
Quantitative Imaging Lab, Dept. of Computer Science, University of Houston, Texas, U.S.A.
Keywords:
Model Drift, Semantic Segmentation, Image Quality Assessment Metrics, Feature Learning, Data Selection,
Quality-Aware Models.
Abstract:
In the midst of the rapid integration of artificial intelligence (AI) into real world applications, one pressing
challenge we confront is the phenomenon of model drift, wherein the performance of AI models gradually
degrades over time, compromising their effectiveness in real-world, dynamic environments. Once identified,
we need techniques for handling this drift to preserve the model performance and prevent further degradation.
This study investigates two prominent quality aware strategies to combat model drift: data quality assessment
and data conditioning based on prior model knowledge. The former leverages image quality assessment met-
rics to meticulously select high-quality training data, improving the model robustness, while the latter makes
use of learned feature vectors from existing models to guide the selection of future data, aligning it with the
model’s prior knowledge. Through comprehensive experimentation, this research aims to shed light on the
efficacy of these approaches in enhancing the performance and reliability of semantic segmentation models,
thereby contributing to the advancement of computer vision capabilities in real-world scenarios.
1 INTRODUCTION
In recent years, the integration of artificial intelli-
gence (AI) into various domains has experienced a
remarkable surge, transforming the way we interact
with technology. The proliferation of AI applications,
ranging from natural language processing to com-
puter vision (Khaldi et al., 2022), has led to break-
throughs in numerous industries. Among the many
AI applications, semantic segmentation plays a piv-
otal role in object recognition, scene understanding,
and image analysis. It aims to assign class labels
to individual pixels within an image, thus enabling a
deeper understanding of the visual content. Seman-
tic segmentation finds practical application in diverse
fields, including autonomous driving, medical imag-
ing, robotics, and remote sensing, among others.
When these segmentation models are trained and
deployed in real-world settings, they undergo con-
stant updates and retraining using recently collected
datasets in conjunction with their existing training
a
https://orcid.org/0000-0003-3754-6894
b
https://orcid.org/0000-0002-2369-8793
c
https://orcid.org/0000-0001-8871-9068
d
https://orcid.org/0000-0003-4093-6906
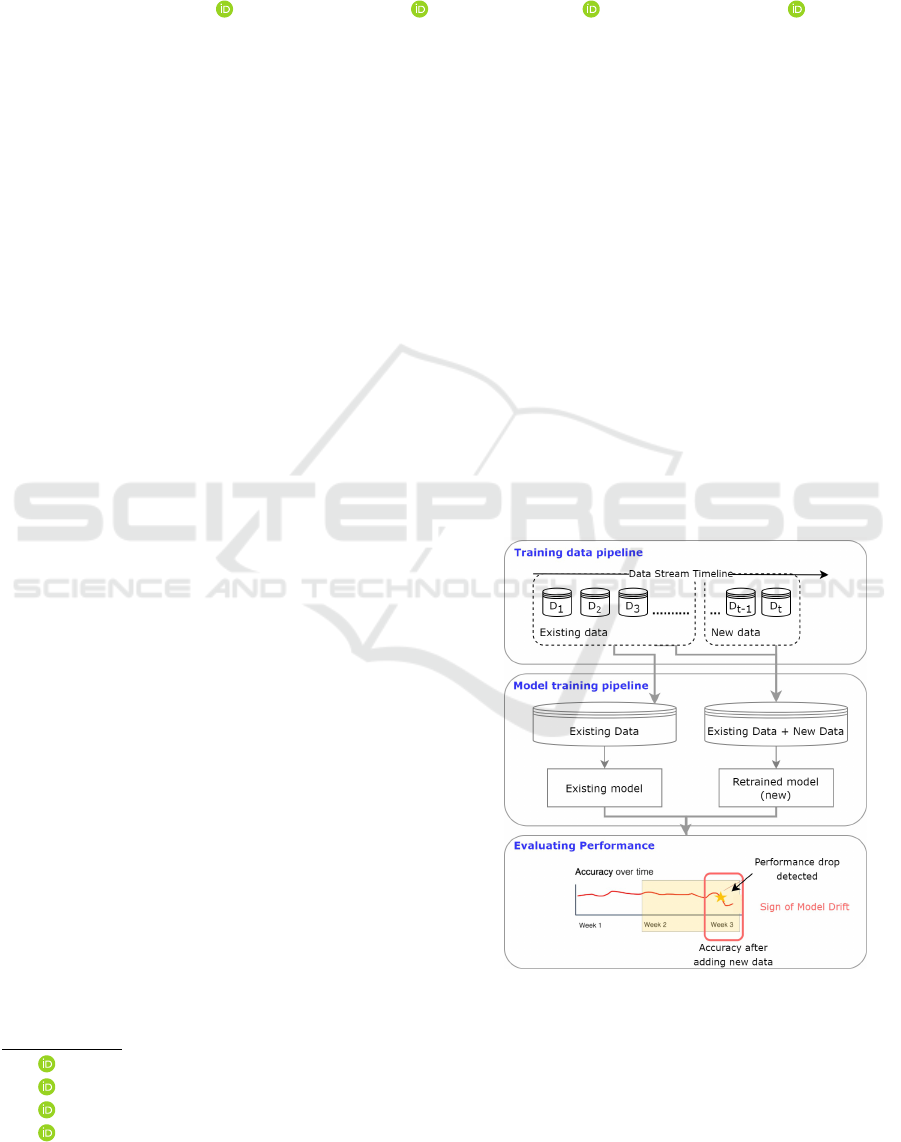
Figure 1: Occurrence of model drift. It may happen due to
a variety of reasons, with one major reason being the degra-
dation of the quality of the new data.
datasets (Tsymbal, 2004). Often, an issue arises when
these models are retrained, where their performance
tends to deteriorate with the addition of new data,
Mirza, S., Nguyen, V., Mantini, P. and Shah, S.
Data Quality Aware Approaches for Addressing Model Drift of Semantic Segmentation Models.
DOI: 10.5220/0012316000003660
Paper published under CC license (CC BY-NC-ND 4.0)
In Proceedings of the 19th International Joint Conference on Computer Vision, Imaging and Computer Graphics Theory and Applications (VISIGRAPP 2024) - Volume 3: VISAPP, pages
333-341
ISBN: 978-989-758-679-8; ISSN: 2184-4321
Proceedings Copyright © 2024 by SCITEPRESS – Science and Technology Publications, Lda.
333
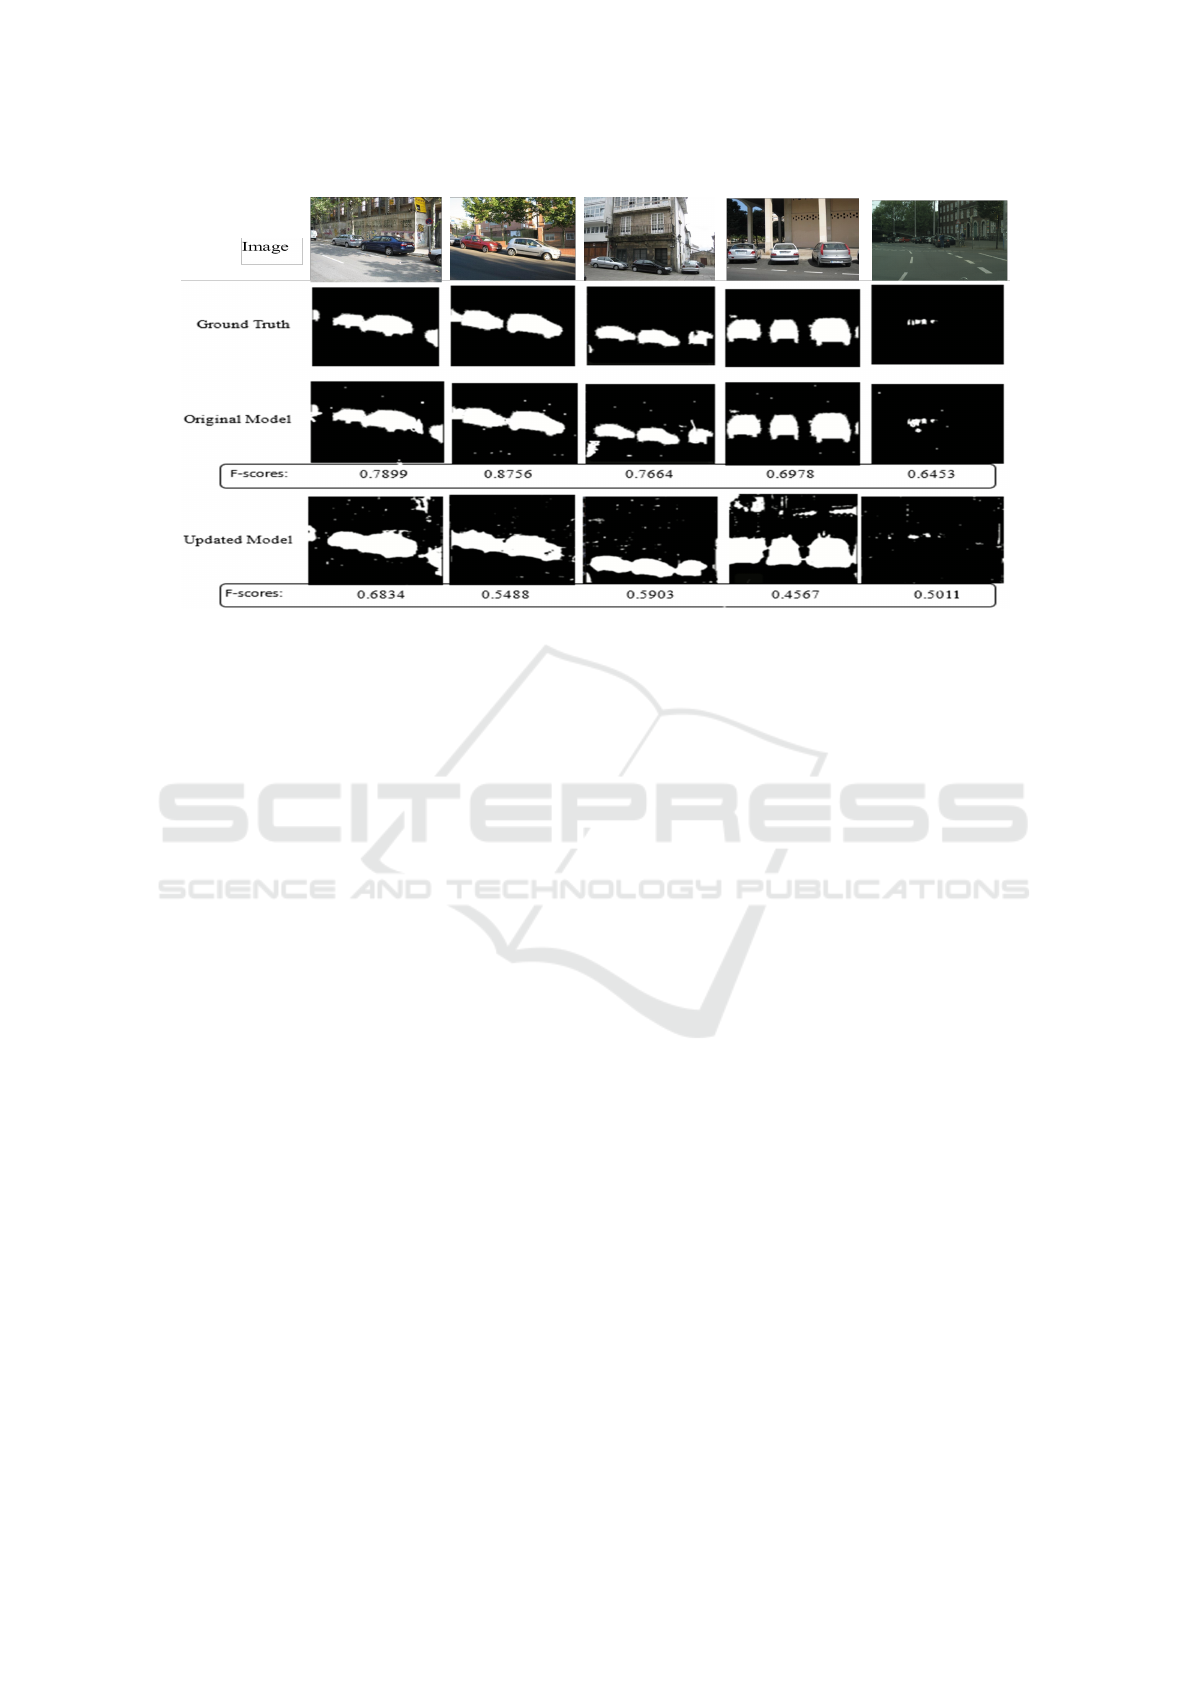
Figure 2: Comparison of model predictions between the original model, initially trained with initial datasets, and the updated
model, which incorporates both the initial datasets and newly acquired data. The updated model exhibits an increased occur-
rence of false positives and a corresponding reduction in F-score values when compared to the original model.
a phenomenon commonly referred to as model drift
(Whang et al., 2023). For instance, consider a salt
layer segmentation model in the oil and gas indus-
try (Devarakota et al., 2022). These models are ini-
tially trained and deployed for real-time prediction,
and are continuously updated (retrained) periodically
as more data is gathered. If the new data has a dif-
ferent distribution compared to the original data or
is of poor quality, the model performance progres-
sively degrades, resulting in numerous false predic-
tions. This phenomenon, as depicted in Figure 1, is
a manifestation of model drift, wherein the effective-
ness of AI models diminishes over time due to the in-
fusion of new data into the training pipeline (Whang
et al., 2023).
Figure 2 shows an example of model drift in a
vehicle segmentation model trained on autonomous
driving datasets (Zhou et al., 2017) (Zhou et al.,
2019), (Cordts et al., 2016), (Everingham et al.,
2010). In this case, two models are trained: the first
using the original dataset and the latter using both the
original and new data. As illustrated in Figure 2, we
observe a decline in model performance, character-
ized by an increase in false positives and a subse-
quent decrease in F-scores following the addition of
new data. This prompts the fundamental question of
how to select future data that does not compromise
model performance.
One reason for the degradation is due to addition
of poor quality data. When low-quality or noisy data
is included, the model could learn from incorrect or
misleading information, leading to suboptimal per-
formance (Zha et al., 2023). Another cause for de-
cline in performance is when the distribution of the
new data differs from that of the old data and fails to
adequately represent the underlying domain (Bayram
et al., 2022). Recognizing these drifts is essential for
continuous model maintenance and, once these drifts
are recognized, we need techniques to combat and
handle this shift to prevent further model degradation.
In this paper, we investigate two major approaches
to address the issue of model drift over time. If the
model encounters unexpected data quality issues in
retraining that were not present in the old training
data, it may perform poorly. Thus, spanning from the
idea that the performance shift is due to the addition of
noisy or distorted data, the first investigated approach
considers the intrinsic quality of the data itself (Jo-
hannes et al., 2023). Our second approach involves
conditioning data selection based on the model’s ex-
isting knowledge. We use the learned feature vectors
from these models as a guide for selecting future data
that aligns with its prior knowledge. This creates a
more harmonious connection between the model’s in-
sights and the selected data.
Our main contributions are as follows: (1) to con-
sider the data quality for updating the models, we pro-
pose the use of IQA metrics to select new data for
retraining the models; (2) we propose retaining the
knowledge from the current production model by se-
lecting future data based on the features learnt by this
current model; and (3) we present extensive experi-
ments on multiple benchmark datasets, to highlight
the effectiveness of these approaches.
VISAPP 2024 - 19th International Conference on Computer Vision Theory and Applications
334

2 RELATED WORKS
In literature, studies have explored two main types
of model drift: concept drift and data drift (Bayram
et al., 2022). Concept drift arises when the statisti-
cal properties of the target variable, data distribution,
or underlying relationships between variables change
over time, rendering previously learned concepts less
relevant or outdated (Webb et al., 2016). An example
is observed in email spam detection, where evolving
spammer tactics can impact model performance over
time (Guerra-Manzanares et al., 2022). Data drift,
on the other hand, occurs when the statistical prop-
erties of new data have changed (Ackerman et al.,
2020). This change may result from significant dif-
ferences between test and training data or variations
in the quality of new data compared to existing train-
ing data, which is investigated in this paper.
2.1 Concept Drift
Significant research has been conducted on identify-
ing concept drift (Lu et al., 2018). Wang et al. (Wang
et al., 2022) introduced the Noise Tolerant Drift De-
tection Method (NTDDM) to identify concept drifts
in data streams, addressing noise commonly present
in real-world applications like those from the Inter-
net of Things. NTDDM employs a two-step approach
to distinguish real drifts from noise-induced false
alarms. Lacson et al. (Lacson et al., 2022) addressed
model drift in a machine learning model for predict-
ing diagnostic testing, employing two approaches: re-
training the original model with augmented recent
data and training new models. Their findings indicate
that training models with augmented data provided
better recall and comparable precision. Other re-
searches, such as (Wang and Abraham, 2015), (Dries
and R
¨
uckert, 2009), and (Klinkenberg and Joachims,
2000), also explore methods to identify concept drift.
2.2 Data Drift
Rahmani et al. (Rahmani et al., 2023) explored var-
ious scenarios of data drift in clinical sepsis predic-
tion, encompassing changes in predictor variable dis-
tribution, statistical relationships, and major health-
care events like the COVID-19 pandemic. The study
suggests that properly retrained models, particularly
eXtreme Gradient Boosting (XGB), outperform base-
line models in most scenarios, highlighting the pres-
ence of data drift. Davis et al. (Davis et al., 2019)
addressed model drift in clinical prediction using non-
parametric methods. Their approach involves a two-
stage bootstrapping method to update models, miti-
gating overfitting impact in recommendations. The
second stage assesses predictions on samples of the
same size as the updating set, considering uncertainty
linked to the updating sample size in the decision-
making process. Other works, such as (Ackerman
et al., 2021) and (Hofer and Krempl, 2013), also in-
vestigate data drift.
In this paper, we investigate drift due to data qual-
ity changes. While prior research has predominantly
centered around concept drift, data drift’s impact, par-
ticularly in segmentation, has been overlooked. We
aim to fill this gap by emphasizing the importance
of data quality in model pipeline. Notably, our ap-
proach uses quality-aware metrics, providing solu-
tions to tackle the challenges associated with data
drift and enhancing the robustness of segmentation.
3 PROPOSED METHODS
Problem Formulation. Our objective is to develop
methods for selecting suitable images or data to add
to our dataset pipeline for model retraining, all while
mitigating degradation in model performance. As
illustrated in Figure 3 let’s consider that we pos-
sess an initial training dataset, denoted as S
old
=
{D
1
,D
2
,···D
n
}, which is used for training model
M
old
. We have new data S
new
= {D
1
,···D
m
} to incor-
porate into our pipeline, so we can update our model
M
new
, using S
old
and appropriate data from S
new
. To
establish a criterion for selecting the appropriate data
S
select
, we need to find a function G that obtains S
select
(which prevents model degradation) from S
new
as fol-
lows:
S
selected
= G (S
new
), (1)
where S
selected
⊆ S
new
, and G denotes an approach to
select data from S
new
. The following two approaches
give our proposed criteria for this selection.
3.1 Data Quality Based Approach
This section outlines the methodology for enhancing
the performance of a baseline U-Net (Ronneberger
et al., 2015) model (M
old
) by incorporating a data
quality-based approach. The core idea behind this ap-
proach is to leverage quantitative image quality as-
sessment (IQA) metrics to assess the quality of each
image within the training dataset and subsequently se-
lect a subset of matched quality data from the new
data for model refinement. To evaluate the quality of
individual images within a set of available datasets
D
all
, we employ IQA metrics. For each image I
i
in
D
all
, we compute a quantitative quality value, denoted
as σ
i
, using these metrics, computed as:
Data Quality Aware Approaches for Addressing Model Drift of Semantic Segmentation Models
335

Figure 3: Incorporating quality-aware data selection into the ML pipeline: Existing model M
old
is trained with S
old
, and new
data S
new
needs integration. Criterion G explores data selection from S
new
without causing negative effects, preventing model
drift. Two criteria are investigated: data quality-based and feature learning-based. We compare performance between M
old
and updated model M
new
.
σ
i
= F (I
i
), (2)
where, F represents a function that encapsulates the
investigated IQA metrics, generating a scalar value σ
i
for each image I
i
∈ D
all
.
With the set of quality values S
σ
=
{σ
0
,σ
1
,...σ
n
},n = |D
all
| computed for all im-
ages in D
all
, we proceed to analyze the distribution
of these values. We aim to distinguish between
high-quality and low-quality images based on a
predefined quality threshold T . Formally, we define a
binary selection function S(σ
i
) as follows:
S(σ
i
) =
(
1, if σ
i
≥ T
0, if σ
i
< T
(3)
Images for which S(σ
i
) = 1 are considered high-
quality and are chosen for model training, while those
for which S(σ
i
) = 0 are deemed low-quality and are
discarded. This technique relies on an optimal selec-
tion of T which avoids two scenarios: (1) too high
threshold, which causes the model to stop learning;
and (2) too low threshold, which causes the model to
capture noise.
Blind/Referenceless Image Spatial Quality Eval-
uator (BRISQUE). In this work, we investigated
BRISQUE (Mittal et al., 2012), a no-reference IQA
algorithm designed to evaluate the quality of digital
images without requiring a reference image for com-
parison. It operates by analyzing statistical properties
of the image such as luminance, texture, compression
etc. It spans from the idea that the distribution of pixel
intensities of natural images differs from that of dis-
torted images. First, a Mean Subtracted Contrast Nor-
malization (MSCN) is performed as follows:
ˆ
I(i, j) =
I(i, j) − µ(i, j)
σ(i, j) +C
, (4)
where i = 1, 2, ..., M and j = 1,2,...,N are the spa-
tial indices, M and N are the image height and width
respectively,
ˆ
I is the resulting MSCN image. µ(i, j)
is local mean field which is the Gaussian Blur of the
original image. σ(i, j) is the local variance field which
is the squared difference of original image and µ.
MSCN normalization is effective for pixel intensities,
but considering pixel relationships is crucial. So, pair-
wise products of MSCN image with a shifted version
of the MSCN image along four orientations: Hori-
zontal (H), Vertical (V), Left-Diagonal (D1), Right-
Diagonal (D2). The resulting five images are fitted
to a Generalized Gaussian Distribution (GGD) to cre-
ate a feature vector. These statistical features serve as
input for a pretrained regression model, trained on a
large dataset annotated by human subjects, to predict
the BRISQUE score.
3.2 Feature Vector Learning Based
Approach
In order to ensure the reliability and improvement of
the training data as we gather more data for the mod-
els, we investigate another approach, depicted in Fig-
ure 4, where we incorporate a conditioning mecha-
nism that takes into account the data on which the cur-
rent model was trained. We make use of feature vec-
tors having the richest information extracted from the
bottleneck layers of the segmentation network to train
a simple Support Vector Machine (SVM) that learns
to distinguish the true and false predictions made by
the trained network on the test data. The purpose of
this network is to guide the feature learning of the re-
trained models on newly acquired dataset.
Consider that we have a baseline model M
a
trained
by an initial dataset which is assumed to be represen-
tative of our domain of interest. Then we test M
a
on
VISAPP 2024 - 19th International Conference on Computer Vision Theory and Applications
336
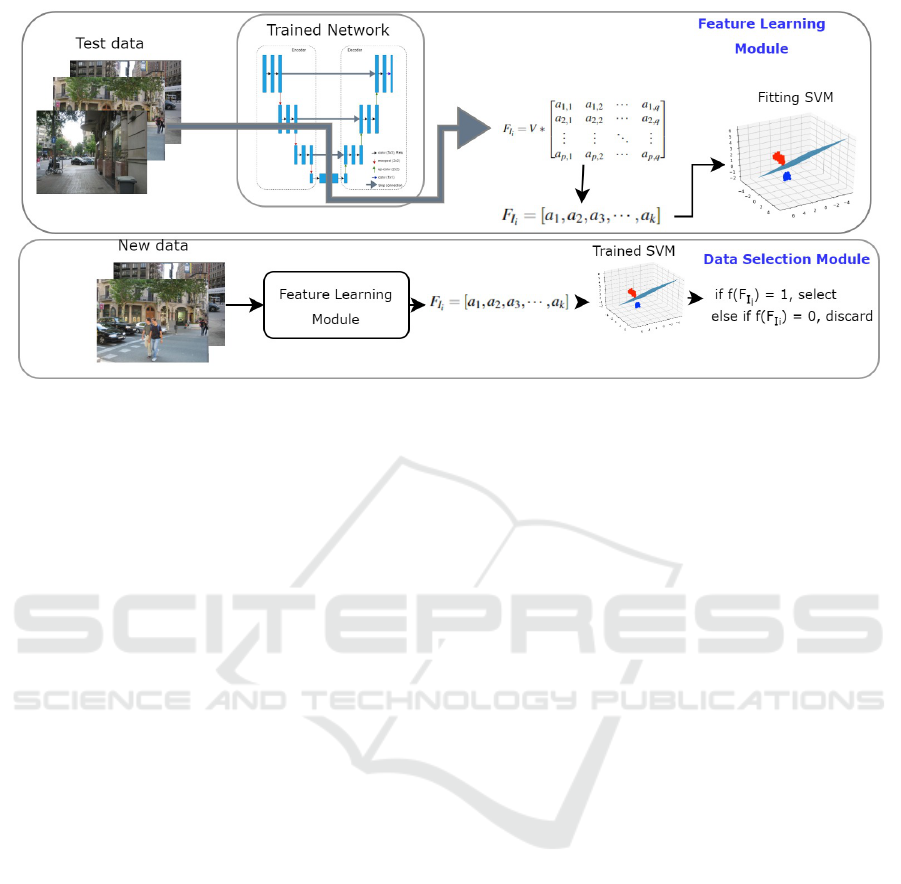
Figure 4: Illustration of the proposed approach. In the feature learning module, the feature vector representation are first learnt
using an SVM on the prior segmentation network in production. Then any new data that needs to be added for retraining the
segmentation net, passes through the feature learning module and is fit to the trained SVM to predict if it must be selected for
further model training or discarded.
our evaluation dataset D
test
to obtain the prediction
masks. Dice metric is computed to measure the ac-
curacy of the obtained masks. For each I
i
∈ D
test
, the
dice value is evaluated against a threshold to catego-
rize each result as true or false. After passing D
test
through the trained model M
a
we also take the output
from the bottleneck layer of the U-net and obtain a
feature vector set for image I
i
∈ D
test
, given as:
F
I
i
= V ∗
a
1,1
a
1,2
··· a
1,q
a
2,1
a
2,2
··· a
2,q
.
.
.
.
.
.
.
.
.
.
.
.
a
p,1
a
p,2
··· a
p,q
(5)
After obtaining V vectors of size p × q we apply spa-
tial pyramid pooling (He et al., 2015) to partition and
pool information from different regions of the fea-
ture maps, and this gives an aggregated representation
that retains vital contextual and positional informa-
tion while reducing the dimensionality to a 1D vector
for every I
i
∈ D
test
.
F
I
i
= [a
1
,a
2
,a
3
,··· , a
k
] (6)
Once we obtain the 1D vector, we use it as features
to train an SVM model that learns to distinguish the
vector representations for true and false predictions.
Subsequently, new data is then passed through the
SVM, allowing for the data selection of true predic-
tions that are then chosen for further model training.
By conditioning the selection of future data on this
network, we theorize that we are fine tuning the new
data on the current model. Hence, we ensure that the
prior knowledge of the model is preserved leading to
retaining the model performance.
4 EXPERIMENTS
4.1 Datasets and Evaluation Methods
Datasets Used. We use three benchmark datasets
for semantic segmentation namely the Adverse Envi-
ronment Conditions dataset (ADE20K) (Zhou et al.,
2017) (Zhou et al., 2019), Cityscapes (Cordts et al.,
2016), and PASCAL Visual Object Classes (VOC)
(Everingham et al., 2010) dataset. ADE20K consists
of 480 × 600 images belonging to nearly 150 classes.
Cityscapes contains annotations for 30 classes and
VOC comprises 20 classes. For the sake of testing our
approach, we focus on segmenting one object of inter-
est from these datasets. Before passing the images to
train the model, they are resized to 256 × 256 with 3
channels. In total the training data comprises of 800
images from ADE20K, 800 from Cityscapes and 300
from VOC. The test dataset D
test
is created by taking
100 images from each of these 3 datasets that are not
part of the training data. The initial results obtained
on D
test
using the U-net model trained with different
combinations of the 3 datasets as training sets is given
in Table 3.
Evaluation Metrics. To evaluate the models we
employ three main metrics: the dice coefficient, the
Area Under the Curve (AUC) of Precision-Recall
Data Quality Aware Approaches for Addressing Model Drift of Semantic Segmentation Models
337

Table 1: Comparing the performance of the baseline model trained with D
orignal
which consists of all the initial undistorted
images from Cityscapes, ADE, and VOC to the performance of the model trained with 70% of images from D
orignal
having
low BRISQUE and 30% from D
distorted
having high BRISQUE score. The model performance drops when high BRISQUE
scored images are added for training.
No. Training Dataset Dice PR score F-score
1 D
orignal
(Baseline) 0.404864 0.589132 0.289338
2 2/3 D
orignal
+ 1/3 D
distorted
0.369254 0.549964 0.36924
Table 2: Comparing the performance of the model trained with D
distorted
which consists of distorted versions of all images
from Cityscapes, ADE, and VOC to the performance of the model trained with D
′
distorted
which contains selected images
having BRISQUE < 60, meaning higher quality images. The model performance better when we prune images having high
BRISQUE.
No. Training Dataset Dice PR score F-score
1 D
distorted
0.309860 0.386605 0.208074
2 D
′
distorted
0.371031 0.484460 0.260145
(PR score), and the F-score. The dice coefficient
quantifies the degree of overlap between our model’s
predicted binary segmentation mask and the ground
truth, providing a measure of segmentation quality.
Meanwhile, the AUC of the PR curve offers a com-
prehensive assessment of binary classification per-
formance, capturing the trade-off between precision
and recall at various thresholds. Lastly, the F-score,
which is the harmonic mean of precision and recall,
provides a balanced evaluation, particularly valuable
when dealing with class imbalances.
4.2 Model Architecture
The semantic segmentation model architecture on
which all the experiments are performed is the U-
net (Ronneberger et al., 2015). The U-net fol-
lows an encoder-decoder architecture, wherein the
encoder extracts high-level features through a con-
tracting path involving operations like convolution
and max-pooling. The decoder, mirroring the en-
coder, employs transposed convolutions to gradually
increase spatial dimensions. Skip connections to cor-
responding encoder layers aid in preserving details.
During training the binary cross-entropy loss function
is minimized.
5 RESULTS AND DISCUSSION
5.1 Approach 1: Results on IQA
Metrics Based Selection
To test the IQA metric based selection, we first need
to assess where our data stands in terms of quantita-
tive quality. Hence we compute the BRISQUE, for
all the images in the three datasets as shown in Figure
5. This distribution shows that the perceptual qual-
ity of these images is good. However, this is not al-
ways the case in real world scenarios where we might
end up acquiring severely degraded data and retrain-
ing the model using this noisy data. Hence, to assess
if using IQA metrics aids in filtering out the noisy
data, we first distort theses images to degrade their
quality. Consider our original data pool denoted by
D
original
, with every image of dimension M × N, i.e.
I
M×N
∈ D
original
, we perform a pyramidal downscal-
ing followed by a pyramidal upscaling. For each pixel
(i, j) in the downscaled image I
′
, the corresponding
pixel value is computed by averaging the values of
the four neighboring pixels in I as follows:
I
′
(i, j) =
I(i − 1, j + 1) + I(i + 1, j + 1)
4
(11)
+
I(i − 1, j − 1) + I(i + 1, j − 1)
4
,
where i = 1, ..., M/2 and j = 1, ..., N/2. Then, in up-
scaling, for each pixel (i, j) in the desired upscaled
image I
′′
(where i ranges from 1 to M and j ranges
from 1 to N), the corresponding pixel value is directly
copied from the nearest pixel in the downscaled im-
age I
′
as follows:
I
′′
(i, j) = I
′
((i/2),( j/2)),i ∈ M, j ∈ N (12)
The final distorted image I
′′
will have a blurring
effect. The IQA metric values for the distorted set
D
distorted
are depicted in Figure 5, where we can see
a clear degradation in the values reflecting this reduc-
tion in quality.
To investigate how adding high valued BRISQUE
scored images to the dataset pipeline affect the model
performance, we perform an experiment where we in-
clude 70% images from D
orignal
, and 30% of images
VISAPP 2024 - 19th International Conference on Computer Vision Theory and Applications
338
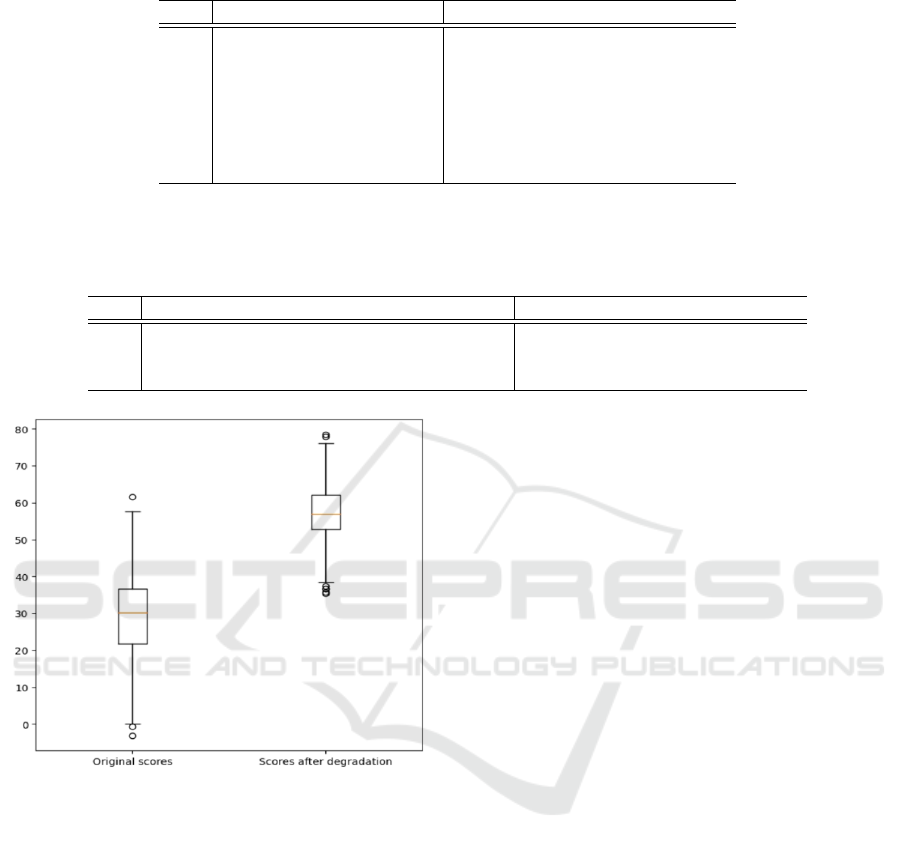
Table 3: Initial performance on D
test
of the U-net model trained using different combinations of the three datasets.
No. Training Dataset Dice PR score F-score
1 Cityscapes 0.375370 0.580734 0.307178
2 ADE 0.513763 0.645072 0.391683
3 VOC 0.245870 0.459835 0.154959
4 Cityscapes + VOC 0.286961 0.545884 0.186165
5 Cityscapes + ADE 0.493080 0.645643 0.370273
6 ADE + VOC 0.389131 0.617254 0.276805
7 Cityscapes + VOC + ADE 0.404864 0.589132 0.289338
Table 4: Performance of trained U-nets on D
test
using the feature vector learning approach. The first row shows the initial
performance of the model on ADE dataset. As more data is added to the pipeline without any data selection strategy, the
model performance degrades as seen in row 2, due to noisy data. Upon applying the selection strategy on the new datasets,
we see that it preserves the prior knowledge and prevents further performance degradation in row 3.
No. Training Dataset Dice PR score F-score
1 ADE 0.513763 0.645072 0.391683
2 ADE + Cityscapes + VOC (Baseline Model) 0.404864 0.589132 0.289338
3 ADE + (Cityscapes +VOC)
SelectedData
0.462565 0.618605 0.342391
Figure 5: Distribution of original images, D
original
BRISQUE scores and BRISQUE scores for images after
image degradation (D
distorted
). Lower BRISQUE score in-
dicate better quality. The original images distribution re-
flects an overall high perceptual quality images. After
degradation, we see an overall increase in BRISQUE due
to a poor quality.
from D
distorted
. The performance achieved by con-
ducting this experiment is demonstrated in Table 1. It
is observed that when we have images having high
BRISQUE scores (meaning poor quantitative qual-
ity), the model performance degrades as we see the
PR score drops to 0.549964 from 0.589132 as com-
pared to the baseline model trained purely with all
D
orignal
. This indicates a decreased ability to correctly
classify true positives while maintaining a similar rate
of false positives, due to the introduction of lower-
quality images.
Further investigations explore the impact of data
quality on model training, focusing on distorted im-
ages in datasets D
distorted
and D
′
distorted
. The for-
mer includes distorted versions of Cityscapes, ADE,
and VOC images, while the latter selectively includes
high-quality images with BRISQUE scores below 60.
Table 2 summarizes the model’s performance on these
datasets. Training with D
distorted
yields a dice coeffi-
cient of 0.309860, a PR score of 0.386605, and an F-
score of 0.208074. Contrastingly, utilizing D
′
distorted
results in significantly improved metrics: a dice coef-
ficient of 0.371031, a PR score of 0.484460, and an
F-score of 0.260145. This improvement underscores
the substantial benefit of data curation using IQA met-
rics, ensuring high-quality inputs for model training.
5.2 Approach 2: Results on Feature
Learning Based Method
In this approach, we first perform a systematic ex-
ploration of various training datasets for U-Net mod-
els and examine their performance on our test dataset
D
test
. Our initial objective is to identify a bench-
mark model for our proposed method. To this end,
we trained and evaluated multiple U-Net models us-
ing different combinations of three diverse datasets,
ADE, Cityscapes, and VOC. The performance results
of these models are given in Table 3. Among these,
we observed that the U-Net model trained solely
on the ADE dataset exhibits the best performance,
achieving a dice coefficient of 0.513763, PR score of
0.645072, and and F-score of 0.391683. Hence, we
consider this model as our preferred choice for the
initial production model in our deployment environ-
ment.
Data Quality Aware Approaches for Addressing Model Drift of Semantic Segmentation Models
339
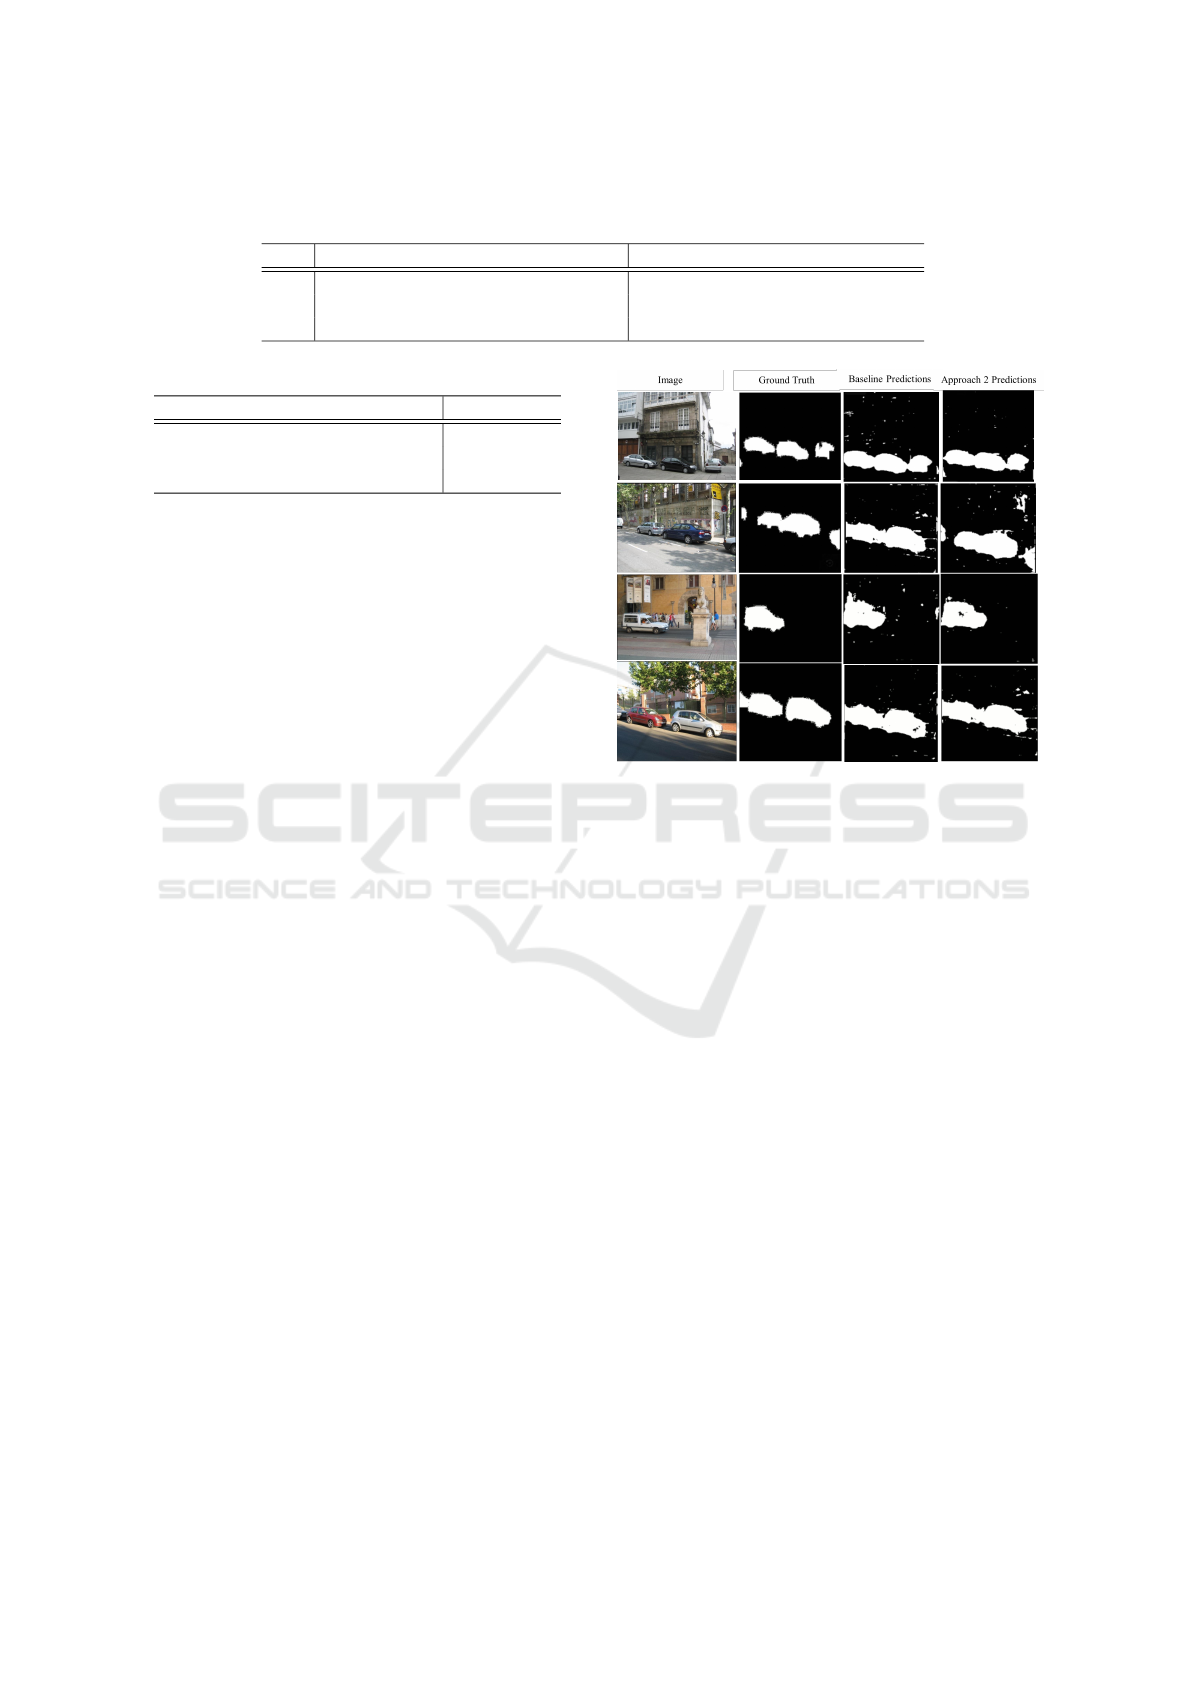
Table 5: Comparing results of the two approaches: (Cityscapes +V OC)
F
uses feature learning, and (Cityscapes +VOC)
Q
involves quality-based selection with BRISQUE T < 40. Both are compared to the baseline model.
No. Training Dataset Dice PR score F-score
1 ADE+ Cityscapes + VOC (baseline) 0.404864 0.589132 0.289338
2 ADE+ (Cityscapes +VOC)
F
0.462565 0.618605 0.342391
3 ADE+ (Cityscapes +VOC)
Q
0.437014 0.626327 0.322737
Table 6: Dataset size statistics.
Data # of Images
ADE 800
Cityscapes + VOC 1100
Selected from Cityscapes + VOC 550
Spanning from our initial formulated problem,
we add Cityscapes and VOC, to the initial dataset
pipeline, which was trained using only ADE. It can
be seen that the model suffers degradation in perfor-
mance, shown by the dice value falling from from
0.513763 to 0.404864 and the PR score dropping
from 0.645072 to 0.589132. To handle this drop,
we introduce our feature vector learning approach,
which involves leveraging the ADE-trained U-Net as
a base for selecting images from additional datasets,
Cityscapes and VOC, to be added to the retraining of
the model.
The results of this selection are illustrated in Ta-
ble 4. Table 6 presents the number of images selected
by this approach. Applying the feature-based data se-
lection strategy to new datasets yields substantial per-
formance improvements, evident in higher dice coef-
ficient, PR, and F-score metrics. This improvement
surpasses the baseline model (ADE + Cityscapes +
VOC), which uses all available images without any
selection. Our method not only maintains high per-
formance with the ADE dataset but also adapts effec-
tively to diverse data sources. This adaptability is cru-
cial in real-world scenarios with continuous dataset
updates, showcasing the robustness and practical ap-
plicability of our proposed methodology for semantic
segmentation tasks. Some prediction visualizations
are depicted in Figure 6.
5.3 Comparing the Two Approaches
Both approaches demonstrate an overall perfor-
mance improvement, as shown in Table 5. The
quality-based method excels in reducing false
positives, as indicated by slight improvements in
PR scores and F-scores. On the other hand, the
feature vector learning-based approach enhances
dice, F-score, and reduces false predictions, though
not as prominently as the quality-based method. If
the primary goal is to minimize false predictions, the
Figure 6: Visualizing predictions made by the trained mod-
els. Approach 2 predictions are shown in the last column
of the image, where we see a visual reduction of the false
positives compared with the baseline model predictions.
quality-based approach appears to be the preferred
choice, showcasing its efficacy.
6 CONCLUSIONS
In this work we investigate two strategies to handle
model drift: data quality assessment and data condi-
tioning based on prior model knowledge. The former
relies on image quality metrics to meticulously select
high-quality training data, thereby bolstering model
robustness. In contrast, the latter leverages learned
feature vectors from existing models to guide the se-
lection of future data, aligning it with the model’s
prior knowledge. Through extensive experimentation,
we provide valuable insights into the effectiveness of
these approaches in enhancing the performance and
reliability of semantic segmentation models. These
findings underscore the significance of data quality
and alignment with prior knowledge in sustaining the
efficacy of AI models in dynamic real-world environ-
ments, thus contributing to the ongoing advancement
of computer vision capabilities.
VISAPP 2024 - 19th International Conference on Computer Vision Theory and Applications
340

REFERENCES
Ackerman, S., Farchi, E., Raz, O., et al. (2020). Detec-
tion of data drift and outliers affecting machine learn-
ing model performance over time. arXiv preprint
arXiv:2012.09258.
Ackerman, S., Raz, O., Zalmanovici, M., and Zlotnick, A.
(2021). Automatically detecting data drift in machine
learning classifiers. arXiv preprint arXiv:2111.05672.
Bayram, F., Ahmed, B. S., and Kassler, A. (2022). From
concept drift to model degradation: An overview on
performance-aware drift detectors. Knowledge-Based
Systems.
Cordts, M., Omran, M., Ramos, S., Rehfeld, T., et al.
(2016). The cityscapes dataset for semantic urban
scene understanding. In CVPR.
Davis, S. E., Greevy Jr, R. A., Fonnesbeck, C., Lasko, T. A.,
et al. (2019). A nonparametric updating method to
correct clinical prediction model drift. Journal of the
American Medical Informatics Association.
Devarakota, P., Gala, A., Li, Z., Alkan, E., et al. (2022).
Deep learning in salt interpretation from r&d to de-
ployment: Challenges and lessons learned. In Second
International Meeting for Applied Geoscience & En-
ergy.
Dries, A. and R
¨
uckert, U. (2009). Adaptive concept drift
detection. Statistical Analysis and Data Mining: The
ASA Data Science Journal.
Everingham, M., Van Gool, L., Williams, C. K., et al.
(2010). The pascal visual object classes (voc) chal-
lenge. International journal of computer vision.
Guerra-Manzanares, A., Luckner, M., and Bahsi, H. (2022).
Android malware concept drift using system calls: de-
tection, characterization and challenges. Expert Sys-
tems with Applications.
He, K., Zhang, X., Ren, S., and Sun, J. (2015). Spatial pyra-
mid pooling in deep convolutional networks for visual
recognition. IEEE transactions on pattern analysis
and machine intelligence.
Hofer, V. and Krempl, G. (2013). Drift mining in data: A
framework for addressing drift in classification. Com-
putational Statistics & Data Analysis.
Johannes, J., Michael, V., Niklas, K., et al. (2023). Data-
centric artificial intelligence.
Khaldi, K., Mantini, P., and Shah, S. K. (2022). Unsuper-
vised person re-identification based on skeleton joints
using graph convolutional networks. In International
Conference on Image Analysis and Processing.
Klinkenberg, R. and Joachims, T. (2000). Detecting concept
drift with support vector machines. In ICML.
Lacson, R., Eskian, M., Licaros, A., et al. (2022). Machine
learning model drift: predicting diagnostic imaging
follow-up as a case example. Journal of the Ameri-
can College of Radiology.
Lu, J., Liu, A., Dong, F., et al. (2018). Learning under con-
cept drift: A review. IEEE transactions on knowledge
and data engineering.
Mittal, A., Moorthy, A. K., and Bovik, A. C. (2012). No-
reference image quality assessment in the spatial do-
main. IEEE Transactions on image processing.
Rahmani, K., Thapa, R., Tsou, P., Chetty, S. C., Barnes,
G., et al. (2023). Assessing the effects of data drift
on the performance of machine learning models used
in clinical sepsis prediction. International Journal of
Medical Informatics.
Ronneberger, O., Fischer, P., and Brox, T. (2015). U-net:
Convolutional networks for biomedical image seg-
mentation. In MICCAI.
Tsymbal, A. (2004). The problem of concept drift: defi-
nitions and related work. Computer Science Depart-
ment, Trinity College Dublin.
Wang, H. and Abraham, Z. (2015). Concept drift detection
for streaming data. In IJCNN.
Wang, P., Jin, N., Woo, W. L., et al. (2022). Noise tolerant
drift detection method for data stream mining. Infor-
mation Sciences.
Webb, G. I., Hyde, R., Cao, H., et al. (2016). Characterizing
concept drift. Data Mining and Knowledge Discovery.
Whang, S. E., Roh, Y., Song, H., and Lee, J.-G. (2023).
Data collection and quality challenges in deep learn-
ing: A data-centric ai perspective. The VLDB Journal.
Zha, D., Bhat, Z. P., Lai, K.-H., Yang, F., et al. (2023). Data-
centric artificial intelligence: A survey.
Zhou, B., Zhao, H., Puig, X., Fidler, S., et al. (2017). Scene
parsing through ade20k dataset. In CVPR.
Zhou, B., Zhao, H., Puig, X., Xiao, T., et al. (2019). Se-
mantic understanding of scenes through the ade20k
dataset. International Journal of Computer Vision.
Data Quality Aware Approaches for Addressing Model Drift of Semantic Segmentation Models
341
